USD/CAD Bulls in Control, Eyeing 1.48 Resistance?USD/CAD has been riding a well-defined ascending channel since mid-February, pushing toward 1.45 after bouncing off its 50-EMA support. The pair remains in a firm uptrend, with bulls showing resilience despite intraday pullbacks.
🔍 Technical Overview:
✅ Trending Higher – Price action remains inside the rising channel.
✅ Support Holding Strong – The 50-EMA (1.4366) has acted as dynamic support.
✅ Momentum Intact – RSI at 64 is bullish but not yet overbought.
✅ MACD Slightly Flat – Suggesting momentum is steady but not accelerating significantly.
📌 Key Levels to Watch:
🔹 1.4500-1.4520 – Immediate resistance; a breakout could push toward 1.48.
🔹 1.4360-1.4400 – Key support zone, aligned with trendline & 50-EMA.
🔹 1.4800 – Major resistance from early February; bulls need a breakout for a larger move.
💡 Trading Outlook:
🔺 Bullish case: A clean breakout above 1.4520 could fuel a run toward 1.48, especially if broad USD strength continues.
🔻 Bearish case: A close below 1.4360 would break the channel, signaling a possible pullback toward 1.42.
Bulls remain in charge for now, but the rally needs follow-through to sustain the upside momentum. Keep an eye on that 1.45 handle!
What’s your next move—ride the trend or wait for a pullback?
USDCAD.PRO.OTMS trade ideas

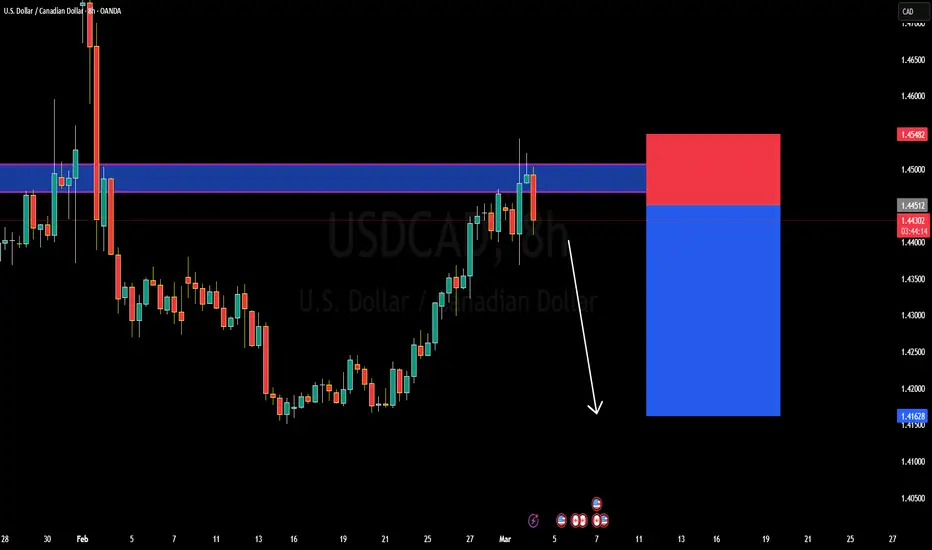
USDCAD ANALYSISPrice is currently at a monthly resistance also forming a triple top pattern. Price is expected to rally down and we have currently seen the formation of a double top or ''M'' pattern on the lower time fame signifying that the pair will soon be selling off. I will go in once i get my confirmations.
Enjoy the ride.

USDCAD Long/Buy Opportunity USDCAD has been in a strong uptrend, and this is driven by the introduction of tariffs under the Trump administration. I believe USDCAD will continue to go up.

USDCAD: Short Trading Opportunity
USDCAD
- Classic bearish pattern
- Our team expects retracement
SUGGESTED TRADE:
Swing Trade
Sell USDCAD
Entry - 1.4430
Stop - 1.4481
Take - 1.4328
Our Risk - 1%
Start protection of your profits from lower levels
❤️ Please, support our work with like & comment! ❤️

USD/CAD BEST PLACE TO SELL FROM|SHORT
Hello, Friends!
USD-CAD uptrend evident from the last 1W green candle makes short trades more risky, but the current set-up targeting 1.409 area still presents a good opportunity for us to sell the pair because the resistance line is nearby and the BB upper band is close which indicates the overbought state of the USD/CAD pair.
✅LIKE AND COMMENT MY IDEAS✅

USDCAD H4 ShortThe price has approached a significant Resistance level. According to the analysis I expect a breakout from this level. But do not forget about the fundamental data, which can affect the breakdown of the level. Don't forget to use stop loss

Why USDCAD Dropping? Technical and fundamentalsUSDCAD is currently trading around 1.44200, facing strong resistance at this level. The pair has tested this resistance multiple times and is showing signs of rejection, indicating a potential bearish reversal. If sellers gain control, we could see a downward move toward the 1.42200 target. This setup aligns with key technical patterns, suggesting that the rejection from resistance could drive further downside momentum.
From a technical perspective, the resistance level at 1.44200 has proven to be a strong barrier for buyers, leading to repeated pullbacks. If price fails to break above this zone, bearish pressure is likely to increase. A confirmed rejection with a strong bearish candlestick formation could provide further confirmation of a downtrend, making this a high-probability short setup.
Fundamentally, USDCAD’s movement is influenced by the strength of the US dollar and oil prices, as Canada’s economy is heavily linked to crude oil. Any rebound in oil prices could strengthen the Canadian dollar, adding to the bearish case for USDCAD. Additionally, market expectations regarding Federal Reserve interest rate policy and economic data releases could play a crucial role in shaping the pair’s next move.
In summary, USDCAD is facing significant resistance at 1.44200, with clear rejection signals indicating potential downside toward 1.42200. Traders should watch for further bearish confirmations while considering fundamental drivers like oil price fluctuations and central bank policies to validate the trade setup.
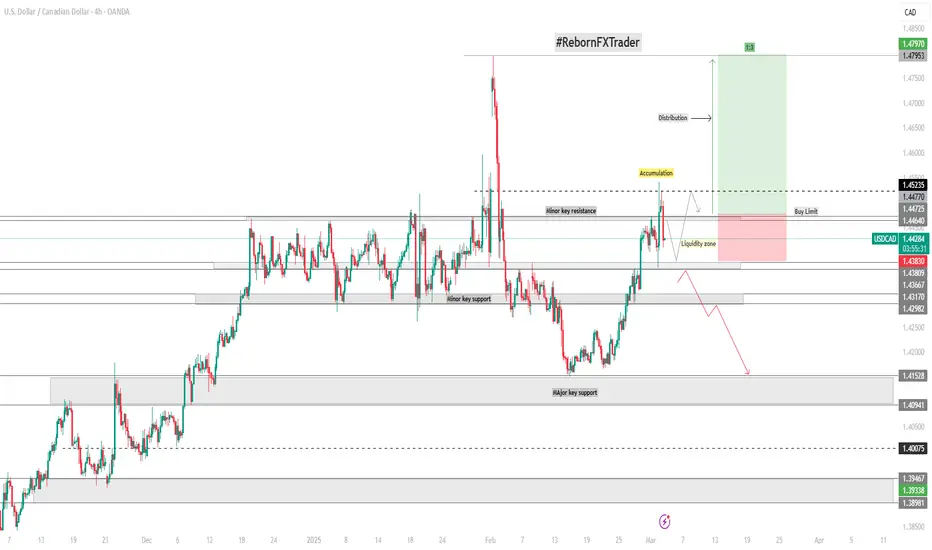
USD/CAD 4-Hour Timeframe AnalysisUSD/CAD 4-Hour Timeframe Analysis
The USD/CAD pair is currently in a consolidation phase following a significant bullish breakout. The price recently surged to the upside, reaching the resistance level at 1.47900, before retracing due to a large volume of seller activity. This retracement drove the price down to the minor key support at 1.43000, and further tested the major key support at 1.41600.
Buyers then regained control, pushing the price upward and breaking through several minor resistance levels, including the 1.44700 mark. Following this breakout, the price has shown signs of accumulation, suggesting a potential stop-loss hunt within the liquidity zone.
A critical area of interest remains the 1.44700 level. Our strategy is to wait for a confirmed breakout above this minor key resistance. Once the 4-hour candle closes above this level, we will closely monitor price action for further confirmation of sustained bullish momentum toward the next key resistance level.
Key Technical Levels:
Resistance: 1.44700, 1.47970 (next minor key resistance)
Support: 1.43000 (minor key support), 1.41600 (major key support)
Fundamental Insight:
As of March 4, 2025, President Donald Trump's administration has implemented new tariffs on imports from Canada, effective immediately. These measures impose a 25% tariff on most Canadian goods entering the United States, with exceptions for energy products like crude oil and natural gas, which are subject to a 10% tariff. (Source: WSJ.COM)
The decision to enforce these tariffs follows a month-long delay intended to allow negotiations addressing issues such as fentanyl smuggling and migration. However, President Trump deemed these efforts insufficient, leading to the activation of the tariffs.
Stricter Canadian Tariffs: These newly enforced tariffs may strengthen the USD due to protectionist measures, increasing upward pressure on USD/CAD.
Canadian Economic Impact: Increased costs on Canadian exports may weigh on the CAD, further supporting USD strength.
Additionally, the USD remains supported by its safe-haven status amid global uncertainties. Any hawkish rhetoric emphasizing U.S. economic resilience could further support USD strength, while dovish signals may lead to CAD appreciation.
Market Outlook:
Given the current technical structure and recent tariff developments, we maintain a bullish outlook on USD/CAD. We will closely monitor the 1.44700 level and observe how price reacts to further trade policy developments.
📌 Disclaimer:
This analysis is for informational and educational purposes only and should not be considered financial advice. Trading involves substantial risk, and past performance is not indicative of future results. Always conduct your own research and consult with a financial professional before making any investment decisions.
USDCADLooking Ahead: USD/CAD Forecast for the Coming Years
When analyzing the future outlook of USD/CAD over the next few years, several key factors come into play, including economic policies, commodity prices, and overall market sentiment.

USDCAD Bullish Continuation - Will Buyers Push Toward 1.45660?OANDA:USDCAD is currently trading within an ascending channel, maintaining a bullish structure. The price has broken above a key resistance zone and is now pulling back for a potential retest. This level previously acted as resistance and may now turn into support, aligning with a bullish continuation.
If buyers confirm support at this zone, the price is likely to move upward toward the 1.45660 target. However, a failure to hold this level could indicate a potential shift in momentum.
Traders should monitor for bullish confirmation signals, such as bullish engulfing candles, strong wicks rejecting the support zone, or increased buying volume, before considering long positions.
Let me know your thoughts or any additional insights you might have! 🚀

USDCAD Surges to 1.47979 – Bulls in Full Control! 🔥 USDCAD Surges to 1.47979 – Bulls in Full Control! 🚀
The USDCAD pair has rallied aggressively, reaching 1.47979 as bullish momentum dominates the market. With strong buying pressure and key resistance levels being tested, traders are eyeing potential breakouts or retracements. Keep an eye on market fundamentals and technical signals for the next move!
#USDCAD #ForexTrading #USDCADRally #MarketAnalysis #TradingSignals

USD/CAD H4 | Falling to multi-swing-low supportUSD/CAD is falling towards a multi-swing-low support and could potentially bounce off this level to climb higher.
Buy entry is at 1.4402 which is a multi-swing-low support that aligns with the 38.2% Fibonacci retracement level.
Stop loss is at 1.4335 which is a level that lies underneath a pullback support and the 50.0% Fibonacci retracement.
Take profit is at 1.4549 which is a swing-high resistance that aligns with the 61.8% Fibonacci retracement level.
High Risk Investment Warning
Trading Forex/CFDs on margin carries a high level of risk and may not be suitable for all investors. Leverage can work against you.
Stratos Markets Limited (www.fxcm.com):
CFDs are complex instruments and come with a high risk of losing money rapidly due to leverage. 63% of retail investor accounts lose money when trading CFDs with this provider. You should consider whether you understand how CFDs work and whether you can afford to take the high risk of losing your money.
Stratos Europe Ltd (www.fxcm.com):
CFDs are complex instruments and come with a high risk of losing money rapidly due to leverage. 63% of retail investor accounts lose money when trading CFDs with this provider. You should consider whether you understand how CFDs work and whether you can afford to take the high risk of losing your money.
Stratos Trading Pty. Limited (www.fxcm.com):
Trading FX/CFDs carries significant risks. FXCM AU (AFSL 309763), please read the Financial Services Guide, Product Disclosure Statement, Target Market Determination and Terms of Business at www.fxcm.com
Stratos Global LLC (www.fxcm.com):
Losses can exceed deposits.
Please be advised that the information presented on TradingView is provided to FXCM (‘Company’, ‘we’) by a third-party provider (‘TFA Global Pte Ltd’). Please be reminded that you are solely responsible for the trading decisions on your account. There is a very high degree of risk involved in trading. Any information and/or content is intended entirely for research, educational and informational purposes only and does not constitute investment or consultation advice or investment strategy. The information is not tailored to the investment needs of any specific person and therefore does not involve a consideration of any of the investment objectives, financial situation or needs of any viewer that may receive it. Kindly also note that past performance is not a reliable indicator of future results. Actual results may differ materially from those anticipated in forward-looking or past performance statements. We assume no liability as to the accuracy or completeness of any of the information and/or content provided herein and the Company cannot be held responsible for any omission, mistake nor for any loss or damage including without limitation to any loss of profit which may arise from reliance on any information supplied by TFA Global Pte Ltd.
The speaker(s) is neither an employee, agent nor representative of FXCM and is therefore acting independently. The opinions given are their own, constitute general market commentary, and do not constitute the opinion or advice of FXCM or any form of personal or investment advice. FXCM neither endorses nor guarantees offerings of third-party speakers, nor is FXCM responsible for the content, veracity or opinions of third-party speakers, presenters or participants.

USDCAD SELL ANALYSIS SMART MONEY COCNEPT Here on Usdcad price has form a supply around area 1.44581 of supply and is likely to continue go down as more seller will come and push price down so trader should go for short with expect profit target of 1.43558 and 1.42562 . Use money management


USD CAD is on fireTariffs are coming from the U.S., which will impact the USD/CAD chart. I believe this is just a pullback, and it will rise further to reach 1.47 again.

USDCAD FORECASTINGTraders! I love this pair because, as we always say, the market moves by leaving clues behind. And this is what happened to this pair. After a strong move to the downside, I saw the price go back to the footprint area just to grab liquidity so it could gain more power to continue pushing to the downside.
However in higher timeframe, it is not clear, we need to be a little bit patient to wait for the market to give us a stronger signal

USD/CAD: Strong Supply Level – A Shift in Trend Ahead?Welcome back! Let me know your thoughts in the comments!
** USDCAD Analysis !
We recommend that you keep this pair on your watchlist and enter when the entry criteria of your strategy is met.
Please support this idea with a LIKE and COMMENT if you find it useful and Click "Follow" on our profile if you'd like these trade ideas delivered straight to your email in the future.
Thanks for your continued support! Welcome back! Let me know your thoughts in the comments!

Investors betting on de-escalation in trade tension| FX ResearchInvestors come into the new week with some hope that we will see a de-escalation in trade tension. US tariffs on Mexico and Canada are scheduled to go into effect tomorrow, though there have been indications that there is good reason to believe it won't be the 25% tariffs that President Trump had said initially.
Risk assets have responded accordingly, with the US dollar off across the board except against the yen, and US equity futures pointing up. The euro has gotten an added boost after inflation data came out hotter than expected. The ECB is expected to cut rates later this week, but the inflation data could influence a less dovish policy stance from the ECB.
Looking ahead, we get Canada manufacturing PMIs, US ISM manufacturing, construction spending, and some Fed speak.
Exclusive FX research from LMAX Group Market Strategist, Joel Kruger

UPDATE USDCADUpdate on analysis, currently in a great position to look for sell opportunities!!! BE ON THE LOOKOUT

USD/CAD – High Probability Long SetupHey guys, welcome back! I'm Skeptic, and today I want to share an interesting long setup on USD/CAD that could present a solid trading opportunity. Let's break it down!
📌 1D Timeframe Analysis
After the previous uptrend, USD/CAD entered a long consolidation phase within a daily range.
Recently, we saw a fake breakout of the range low, followed by strong bullish momentum, indicating a potential attempt to break the key resistance at 1.45172.
If this breakout is successful, we could see higher targets being tested.
📌 4H Timeframe & Entry Plan
🔹 Trigger: Entry after the breakout of 1.44545 resistance.
🔹 Execution: You can either place a stop-buy order or wait for a breakout confirmation on lower timeframes.
🔹 Stop-Loss: Below 1.43677 (safe level).
🔹 Target: Holding towards the daily resistance at 1.45172 and beyond.
📌 Why take this trade?
We are anticipating the daily breakout before it happens, rather than chasing it after the fact.
If you wait for confirmation above 1.45172, you may need a wider stop-loss, making the entry less favorable due to increased volatility.
📉 Risk management remains key! Make sure to size your position accordingly and avoid overleveraging.
💬 What’s your take on this USD/CAD setup? Drop your thoughts below!
🚀 See you in the next analysis!

Bullish bounce?USD/CAD is falling towards the support level which is a pullback support that lines up with the 38.2% Fibonacci retracement and could bounce from this level to our take profit.
Entry: 1.4360
Why we like it:
There is a pullback support level that lines up with the 38.2% Fibonacci retracement.
Stop loss: 1.4307
Why we like it:
There is a pullback support that is slightly below the 50% Fibonacci retracement.
Take profit: 1.4486
Why we like it:
There is a pullback resistance level which is a pullback resistance that is slightly above the 50% Fibonacci retracement.
Enjoying your TradingView experience? Review us!
Please be advised that the information presented on TradingView is provided to Vantage (‘Vantage Global Limited’, ‘we’) by a third-party provider (‘Everest Fortune Group’). Please be reminded that you are solely responsible for the trading decisions on your account. There is a very high degree of risk involved in trading. Any information and/or content is intended entirely for research, educational and informational purposes only and does not constitute investment or consultation advice or investment strategy. The information is not tailored to the investment needs of any specific person and therefore does not involve a consideration of any of the investment objectives, financial situation or needs of any viewer that may receive it. Kindly also note that past performance is not a reliable indicator of future results. Actual results may differ materially from those anticipated in forward-looking or past performance statements. We assume no liability as to the accuracy or completeness of any of the information and/or content provided herein and the Company cannot be held responsible for any omission, mistake nor for any loss or damage including without limitation to any loss of profit which may arise from reliance on any information supplied by Everest Fortune Group.

USD/CAD LongIncoming pullback on Usd/Cad Cad is weak and there are no signs that it will turn in near future. I'm looking to go long on this pair and aim for highs at 1.47880
Wait for price to come closer to support around 1.3400 before going long.
