USDCAD Technical & Order Flow Analysis (Swing Trading)Our analysis is based on multi-timeframe top-down analysis & fundamental analysis.
Based on our view, the price will rise to the monthly level.
DISCLAIMER: This analysis can change anytime without notice and is only for assisting traders in making independent investment decisions. Please note that this is a prediction, and I have no reason to act on it, and neither should you.
Please support our analysis with a like or comment!
USDCAD.PRO.OTMS trade ideas

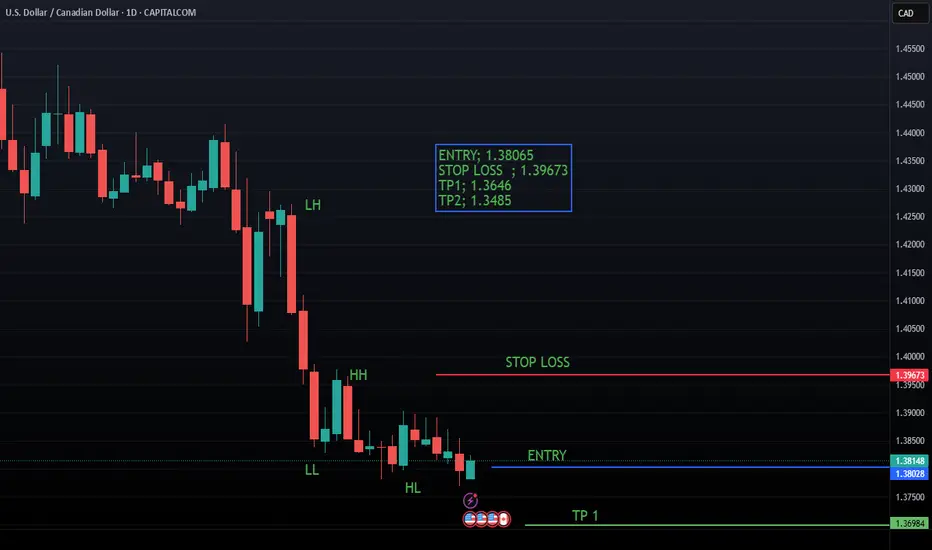
usdcad sell tradeThe Relative Strength Index (RSI) is showing a downward trend, indicating weakening momentum. Additionally, the Moving Average Convergence Divergence (MACD) is showing a bearish crossover, further supporting the potential for a downward move


USDCAD LONGMarket structure bullish on HTFs DH
Entry at both Weekly and Daily AOi
Weekly Rejection at AOi
Daily Rejection at AOi
Previous Structure point Daily
Around Psychological Level 1.38500
H4 Candlestick rejection
Rejection from Previous structure
Levels 4.1
Entry 95%
REMEMBER : Trading is a Game Of Probability
: Manage Your Risk
: Be Patient
: Every Moment Is Unique
: Rinse, Wash, Repeat!
: Christ is King.

Market Analysis: USD/CAD DipsMarket Analysis: USD/CAD Dips
USD/CAD declined and now consolidates below the 1.3850 level.
Important Takeaways for USD/CAD Analysis Today
- USD/CAD started a fresh decline after it failed to clear the 1.3900 resistance.
- There is a major bearish trend line forming with resistance at 1.3815 on the hourly chart at FXOpen.
USD/CAD Technical Analysis
On the hourly chart of USD/CAD at FXOpen, the pair climbed toward the 1.4000 resistance zone before the bears appeared. The US Dollar formed a swing high near 1.3890 and recently declined below the 1.3850 support against the Canadian Dollar.
There was also a close below the 50-hour simple moving average and 1.3820. The bulls are now active near the 1.3770 level. The pair is now consolidating losses below the 23.6% Fib retracement level of the downward move from the 1.3892 swing high to the 1.3768 low.
If there is a fresh increase, the pair could face resistance near the 1.3800 level. The next key resistance on the USD/CAD chart is near the 1.3815 level.
There is also a major bearish trend line forming with resistance at 1.3815. If there is an upside break above 1.3815, the pair could rise toward the 1.3845 resistance or the 61.8% Fib retracement level of the downward move from the 1.3892 swing high to the 1.3768 low.
The next major resistance is near the 1.3890 zone, above which it could rise steadily toward the 1.3950 resistance zone. Immediate support is near the 1.3770 level.
The first major support is near 1.3720. A close below the 1.3720 level might trigger a strong decline. In the stated case, USD/CAD might test 1.3640. Any more losses may possibly open the doors for a drop toward the 1.3550 support.
This article represents the opinion of the Companies operating under the FXOpen brand only. It is not to be construed as an offer, solicitation, or recommendation with respect to products and services provided by the Companies operating under the FXOpen brand, nor is it to be considered financial advice.

Possibility of uptrend The price is expected to consolidate above the support area, then if the resistance trend line is broken, a continuation of the uptrend is likely.

USDCAD - pay attention to what this market is telling youI like what this chart is telling me, do you see the same?
I took a short when that trend line got retested. The USD may be giving contradictory signals in different pairs, but for me this one is clear as day.
I hope it works out as I think!!
This is not a trade recommendation; it’s merely my own analysis. Trading carries a high level of risk, so only trade with money you can afford to lose and carefully manage your capital and risk. If you like my idea, please give a “boost” and follow me to get even more. Please comment and share your thoughts too!!
It’s not whether you are right or wrong, but how much money you make when you are right and how much you lose when you are wrong – George Soros

possibity of downtrendIt is expected that a trend change will form in the current support area and we will see the beginning of an upward trend. Otherwise, the correction will continue.
If the price crosses the support area and the support trend line, a long-term downtrend will be established.

USDCAD Near Key Trendline as Carney Wins ElectionUSDCAD remained relatively calm as Canadian election results began to come in. Mark Carney is projected to win, and the initial reaction was bullish for the Canadian dollar. However, the gains were short-lived, as the victory margin appears narrow.
Canada stands at a pivotal moment in its history. The newly announced tariffs will likely deal a heavy blow to the economy. Markets are cautious, recognizing that a slim majority could complicate budget negotiations and legislative decisions in Parliament. On the other hand, Carney’s background as a former central bank governor could provide economic credibility during a potential slowdown.
Carney stated, "We are over the shock of American betrayal. But we should never forget the lessons." He is expected to pursue damage-control with the U.S. through negotiation, while simultaneously turning toward the EU to boost trade. Although this blow may prove beneficial for Canada in the long run, the coming years could present serious challenges.
From a combined perspective including technical and fundamental side, the bullish trend channel in USDCAD may remain intact for now. The lower boundary of the four-year trend lies around 1.37. As long as this trendline holds, dips may present buying opportunities. For any meaningful upward movement, the 1.3670–1.37 zone must be clearly broken with multiple daily closes above. Until a breakout or breakdown occurs, range-bound and uncertain price action may persist between these levels.

Loonie Drops on Election Shock – Is USD/CAD Set to Rally Further⭐️The USD/CAD pair recovered from intraday losses, trading around 1.3840 in Tuesday’s early European session, as the Canadian dollar (CAD) weakened following Canada’s election results. Prime Minister Mark Carney of the Liberal Party retained power but secured only 167 of 343 seats, falling short of the majority needed for effective trade negotiations with the US. Carney declared the end of the US-led global trade system, unsettling the CAD. The USD gained from optimism in US-China trade relations, with Trump open to lowering tariffs, Beijing exempting some US imports, and ongoing talks with President Xi Jinping showing progress. Trump also proposed reducing auto tariffs, boosting market sentiment.
🔼BUY 1.37100 - 1.36900
SL 1.36600
TP1 1.37400
TP2 1.37900
🔽SELL 1.38800 - 1.39000
SL 1.39300
TP1 1.38500
TP2 Open

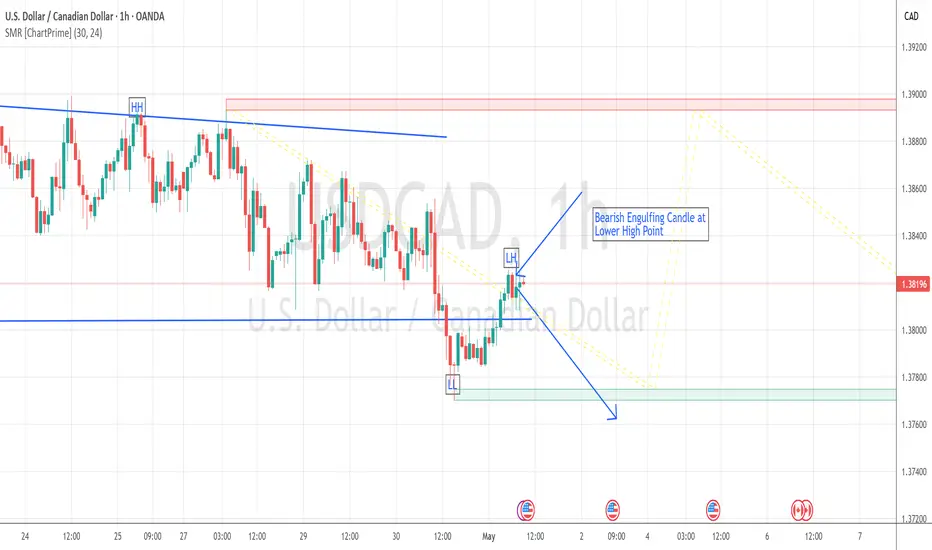
USDCAD 1 Hour Chart Bearish Engulfing Pattern at Higher LowUSDCAD 1 Hour Chart Bearish Engulfing Pattern at Higher Low
We wait for another Bearish Candle for Confirmation for another downward move
USDCAD- Possibility of a long
- loosing momentum on the downside.
- creating a double bottom.
- creating the W pattern as we look in the 1hr/4hr time frame
- bullish engulfing candlesticks confirming buyers are pushing the market
- rejected off major demand zones

USDCAD LongWe are in a support and we are in a support zone. hoping to purchase the pair at the current rate

USDCAD swing longsFrom fundamental analysis on CAD futures derived from "barchart.com". Currently as of writing (Monday 30th April 2025), we can see the CAD futures price increasing from this day but the Open Interest has been decreasing steadily so we can anticipate a reversal soon for the futures price (to flip bearish), which means bullish PA for USDCAD (this could also give you a slight insight/confirmation to DXY’s potential price).
Technicals outlined in chart using price action.

USDCAD LONG FORECAST Q2 W18 D30 Y25 USDCAD LONG FORECAST Q2 W18 D30 Y25
Professional Risk Managers👋
Welcome back to another FRGNT chart update📈
Diving into some Forex setups using predominantly higher time frame order blocks alongside confirmation breaks of structure.
Let’s see what price action is telling us today!
💡Here are some trade confluences📝
✅Intraday bullish breaks of structure
✅Tokyo ranges to be filled
✅Daily low rejection
✅1' order block identified
🔑 Remember, to participate in trading comes always with a degree of risk, therefore as professional risk managers it remains vital that we stick to our risk management plan as well as our trading strategies.
📈The rest, we leave to the balance of probabilities.
💡Fail to plan. Plan to fail.
🏆It has always been that simple.
❤️Good luck with your trading journey, I shall see you at the very top.
🎯Trade consistent, FRGNT X

TOP DOWN ANALYSIS ON USDCAD 4HR ON THE 4HR TIMEFRAME, We established the key monthly zone + weekly trendline + wide divergence all signaling bullish and hence rhyming with the monthly, weekly and daily bullish bias. Our confirmation will be the break of the 4hr trend line for a possible quick entry long!!

TOP DOWN ANALYSIS ON USDCAD DAILY TIMEFRAME ON THE DAILY TIMEFRAME, We established the major zone + the weekly trend line + momentum loss as price approached the key zone + tight divergence all signaling bullish!!

#USDCAD 1HUSDCAD (4H Timeframe) Analysis
Market Structure:
The price has broken above a key resistance level and is currently showing signs of a retest. A successful retest of the broken resistance as support indicates that buyers are maintaining control, suggesting potential for further upward movement.
Forecast:
A buy opportunity can be considered if the price confirms the retest and starts to show bullish momentum, supporting the continuation of the breakout move.
Key Levels to Watch:
- Entry Zone: Look for buying signals around the retest area of the previous resistance turned support.
- Risk Management:
- Stop Loss: Placed below the retest support zone to manage downside risk.
- Take Profit: Aim for higher resistance zones or key Fibonacci extension levels as potential targets.
Market Sentiment:
The breakout followed by a retest suggests a shift toward bullish sentiment. However, proper confirmation through bullish candlestick patterns or momentum indicators is advised before entering the trade.

Carney wins, US jobs are in spotlight. Short-term USDCAD reviewThe former BoE chief Mark Carney became the new PM of Canada. US JOLTs, ADP and NFP numbers are carefully monitored by USD traders. What could happen with MARKETSCOM:USDCAD ?
Let's find out.
FX_IDC:USDCAD
Let us know what you think in the comments below.
Thank you.
77.3% of retail investor accounts lose money when trading CFDs with this provider. You should consider whether you understand how CFDs work and whether you can afford to take the high risk of losing your money. Past performance is not necessarily indicative of future results. The value of investments may fall as well as rise and the investor may not get back the amount initially invested. This content is not intended for nor applicable to residents of the UK. Cryptocurrency CFDs and spread bets are restricted in the UK for all retail clients.

USD/CAD(20250429)Today's AnalysisMarket news:
The U.S. Treasury Department raised its second quarter debt forecast to $514 billion. U.S. Treasury Secretary: The "X Day" for the debt ceiling issue will be announced soon.
Technical analysis:
Today's buying and selling boundaries:
1.3845
Support and resistance levels:
1.3921
1.3892
1.3874
1.3816
1.3798
1.3769
Trading strategy:
If the price breaks through 1.3845, consider buying, the first target price is 1.3874
If the price breaks through 1.3816, consider selling, the first target price is 1.3798


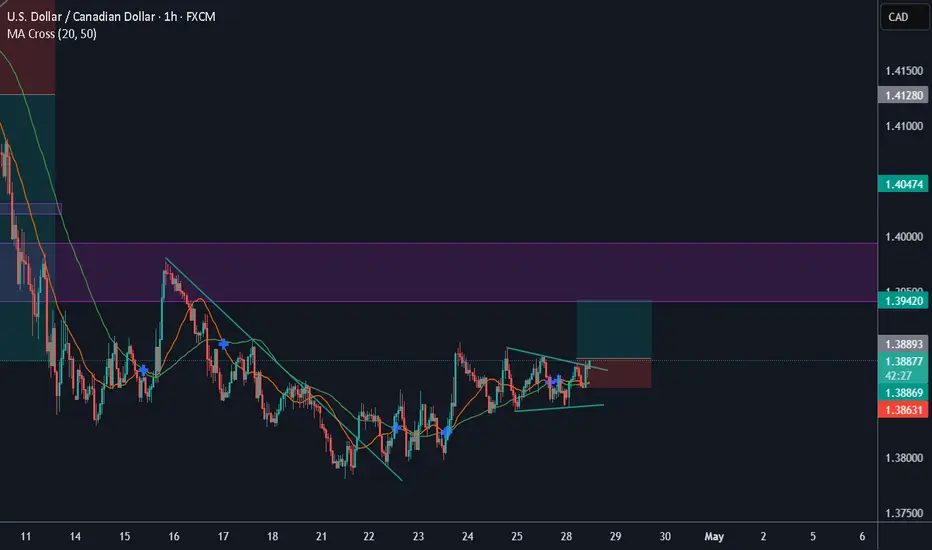
Triangle PatternThe price has formed a triangle pattern as a continuation of a previous breakout and now looks to make a bullish impulse
we had an inner pullback and now the price looks ready to make a bullish move, but we can also wait for an outer pullback for confirmation
WE ONLY TRADE PULLBACKS
DM FOR VIP SIGNALS