#USDCADLow risk with a reward of one to ten that will bring good profits. However, depending on the broker's spread, the stop can be set up to two pips higher.
USDCAD.PRO.OTMS trade ideas

USDCAD Technical Expert Review - 3 May 2025✅ Market Structure Summary:
The market entered a distribution phase, clearly forming equal highs and a head & shoulders–like pattern.
After breaking out of the descending wedge, price surged upward to tap the upper supply zone (gray), sweeping liquidity before dropping sharply.
We now see price reacting to a mid-demand zone, with another deeper demand zone resting below.
📍 Key Technical Zones:
🔹 Upper Gray Supply Zone:
This zone was tapped after liquidity was grabbed from the equal highs.
Strong bearish rejection with impulse candles confirms it as a valid shorting zone.
It remains active and could act as a trap if retested without proper bullish structure.
🔹 Mid-Demand Zone (current reaction point):
Price is currently reacting from this area.
Initial bullish reaction is visible, but the reaction isn't strong enough yet to confirm reversal.
Weak buyer pressure (wicky candles) suggests vulnerability.
🔹 Lower Demand Zone (main target if breakdown occurs):
If the current zone fails, price will likely drop toward this deeper demand block, which hasn't been mitigated yet.
This area could offer a more solid foundation for a bullish reversal.
🔮 Forecast Scenarios:
📉 Primary Bearish Scenario:
If price fails to create higher highs from the current mid-demand zone:
Expect a continuation down toward the lower gray demand zone.
If that breaks, price could target the green higher-timeframe demand around 1.37200.
📈 Alternative Bullish Scenario:
If price builds structure and forms a higher high from this zone:
A short-term rally back toward the upper supply zone is possible.
However, without a strong breakout, that area still holds risk for another sell-off.

USDCAD BUY900m @ 1.37 (Support) - 900m @ 1.389 (Break) - Targets @ 1.40 (TP) - Waiting for a Range Breakout

#usdcadYou can enter in two steps and the best entry is in the low-risk zone. The low-risk zone has a reward of 1 to 10, which can also be done risk-free, but I recommend being patient until you reach TP 10.

USDCAD BUY LongTrade with patience on this pair as there was election in Canada on this week. It is just my analysis. Let us Check how it works.

USDCAD INTRADAY sideways consolidationThe USDCAD pair is exhibiting a bearish sentiment, reinforced by the ongoing downtrend. The key trading level to watch is at 1.4060, which represents the current intraday swing low and the falling resistance trendline level.
In the short term, an oversold rally from current levels, followed by a bearish rejection at the 1.4060 resistance, could lead to a downside move targeting support at 1.3780, with further potential declines to 1.3730 and 1.3630 over a longer timeframe.
On the other hand, a confirmed breakout above the 1.4060 resistance level and a daily close above that mark would invalidate the bearish outlook. This scenario could pave the way for a continuation of the rally, aiming to retest the 1.4080 resistance, with a potential extension to 1.4160 levels.
Conclusion:
Currently, the USDCAD sentiment remains bearish, with the 1.4060 level acting as a pivotal resistance. Traders should watch for either a bearish rejection at this level or a breakout and daily close above it to determine the next directional move. Caution is advised until the price action confirms a clear break or rejection.
This communication is for informational purposes only and should not be viewed as any form of recommendation as to a particular course of action or as investment advice. It is not intended as an offer or solicitation for the purchase or sale of any financial instrument or as an official confirmation of any transaction. Opinions, estimates and assumptions expressed herein are made as of the date of this communication and are subject to change without notice. This communication has been prepared based upon information, including market prices, data and other information, believed to be reliable; however, Trade Nation does not warrant its completeness or accuracy. All market prices and market data contained in or attached to this communication are indicative and subject to change without notice.

USDCAD – DAILY OUTLOOK – APRIL 29Looking at the daily chart, USDCAD hasn’t done much in terms of our longer-term target but continues to reject 1.38618, which adds confluence to the bearish bias.
That being said, the consistent failure to push higher makes me doubt we’ll see the deeper pullback to 1.39621—unless we get a strong fundamental catalyst. So for now:
📉 Current sell zones:
– 1.37871
– 1.36647
🎯 First target = 1.34380 (300+ pips available)
Will reassess if any news shifts the bias, but structure-wise we stay short.

USDCAD SHORT IDEAUnder current market conditions, the area near 1.3849 has been identified as a critical resistance zone, where the AI model detects a high-probability trade setup.
From a technical perspective, a clear directional bias based on recent price action patterns. Suppose the market demonstrates increased volume and price stability above key moving averages in the 1.3849 area. In that case, traders are advised to monitor for trend-continuation entry opportunities in alignment with the prevailing momentum.
Profit targets are defined at 1.3819 and 1.3785, corresponding to logical technical support zones. These levels are designed for staged profit-taking across different trade management styles. Stop-loss should be strictly enforced at the designated level; once breached, the strategy is considered invalidated in order to limit potential downside.

TOP DOWN ANALYSIS ON USDCADMONTHLY TIME FRAME : Price dropped from a major swing high monthly zone however price is currently on another major zone again but haven't reacted as the monthly candle is not closed yet hence we wait for the monthly candle close for a possible price action on the monthly timeframe.

Daily Price Action: USDCAD Tuesday 4/29/2025In this video, we will be looking into the potential price action USDCAD.

USDCAD Triple TopSince 2015 up to 2025, USDCAD is moving inside a range from 1.20ish to 1.5ish. Currently, we are seeing another rejection to pass 1.5 area. On the previous years after hitting the 1.5 area, the price fell back to the 1.2 area which happened 2 times. Will this repeat the pattern again and go back the 1.2 area ?

Canadian Dollar Rises Amid Tariff Concerns and Oil GainsHello,
FX:USDCAD : The Canadian dollar slightly rose against the U.S. dollar, with bond yields reaching multi-month highs, partly recovering from recent declines due to U.S. trade tariff threats. The loonie traded at 1.4405 to the U.S. dollar, recovering from a near 5-year low in December. Concerns about potential U.S. tariffs and their impact on the Bank of Canada have influenced the market. Despite strong job data in December, investor confidence in further BoC rate cuts has waned. Speculators have increased bearish bets on the Canadian dollar. Meanwhile, the U.S. dollar gained against major currencies as expectations for Federal Reserve rate cuts diminished. Oil prices rose 2.9% to $78.82 per barrel due to anticipated U.S. sanctions on Russian oil. The Canadian 10-year yield increased to 3.507%, marking its highest level since July 9.
For this pair a bearish reversal is still anticipated in the near future!
No Nonsense. Just Really Good Market Insights. Leave a Boost
TradeWithTheTrend3344

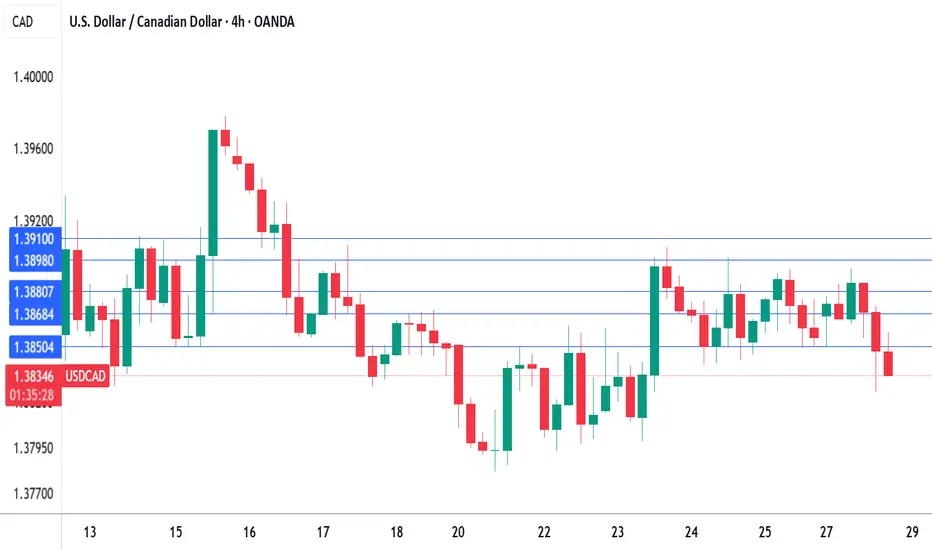
Canadian dollar in holding pattern on Election DayThe Canadian dollar is showing limited movement on Monday. In the European session, USD/CAD is trading at 1.3868, up 0.10% on the day. There are no economic releases out of the US or Canada today.
It's Election Day in Canada. Prime Minister Mark Carney, who has only been in office since March, is favored to win the election. Carney's Liberal Party was badly trailing the Conservatives but US President Trump has ignited Canadian nationalism and turned the election race upside down.
Trump has talked about annexing Canada and although most Canadians don't expect that to happen, there is strong resentment against the US tariff policy, which has hit Canada even though the two countries have a free trade agreement.
Carney is viewed as a strong leader who can stand up to Trump and the markets have priced in a Liberal majority. If the Liberals are forced to make a coalition with the smaller parties, the new government would be considered less stable and that would likely trigger some CAD weakness. If the Conservatives manage to pull out a surprise election victory, the Canadian dollar would likely get a boost.
Canada's retail sales declined 0.4% m/m in February but bounced back in March with a strong gain of 0.7%. On an annualized basis, retail sales slipped to 4.7% in February, down from a revised 5.3% in January.
The improvement in March was driven by consumers making purchases ahead of US tariffs, but consumer spending is likely to deteriorate. The Bank of Canada will be keeping a close eye and will have to consider further rate cuts if upcoming economic data is weak. The BoC maintained the cash rate at 2.75% earlier this month and meets next on June 4.
USD/CAD is testing resistance at 1.3868. Above, there is resistance at 1.3880 and 1.3910
1.3850 and 1.3838 are the next support levels

USDCAD Bounce from New Swing Low — Still BearishUSDCAD 🇺🇸🇨🇦 has created a new swing low at 1.37871 and is starting to bounce.
However, my overall bias remains bearish toward the next major target of 1.34380 — an easy 300 pips from where we are now.
🟡 Sell interest zones:
1.39621 (pullback and rejection)
1.37871 (continuation)
1.36647 (breakdown)
1.35432 (breakdown)
🎯 Final target: 1.34380 before reassessing.

possibility of uptrendIf the price breaks through the current resistance levels, the upward trend will likely continue.
Otherwise, the downward trend will likely continue to the specified support level.


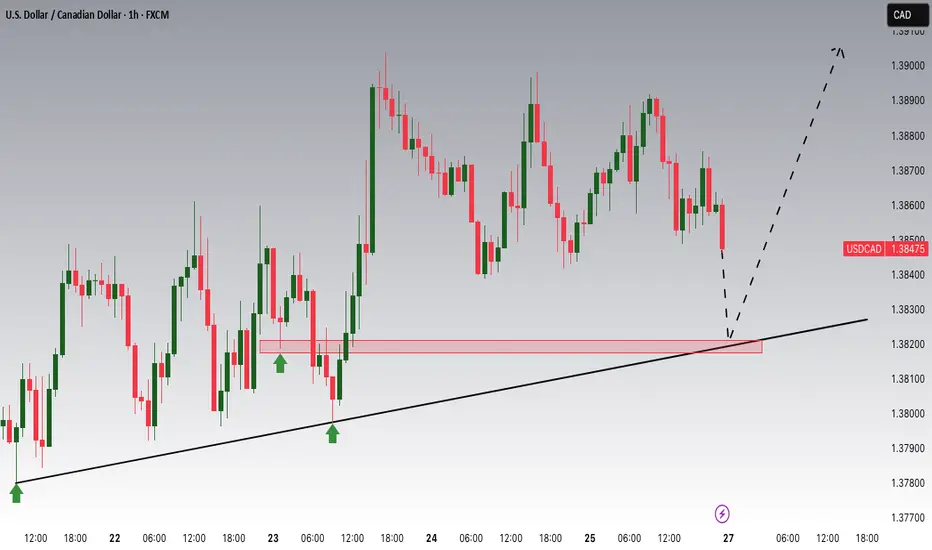
USDCAD Potential UpsidesHey Traders, in today's trading session we are monitoring USDCAD for a buying opportunity around 1.38200 zone, USDCAD is trading in an uptrend and currently is in a correction phase in which it is approaching the trend at 1.38200 support and resistance area.
Trade safe, Joe.
USDCAD: B tradeA page from my trading journal. Please take it with a grain of salt, as I’m still learning and growing 🌟
• Will become B+ if price pulls to VWAP and rejects
• A if it forms a failed breakout above 1.39 followed by strong bear reversal bar

[USDCAD] Trade ideaOn this forex pair I am now looking for a swing long position to build step by step. Here we have my main level of interest and the price action start to switch from short to potential long.
I take the trade and still manage it live.
Great Trade !

USDCAD Swing ShortJust set and forget. Trump's goal is for a weak Dollar to balance the trade deficit.

GBPCAD Short the bearish trend is still strong and after calculating the momentum, I decided to take at 1R position

USDCAD 15-Min Setup: Buyers Defend Crucial ZoneGood morning traders,
Trust you are doing great.
Kindly go through my analysis of USDCAD currency pair.
Overview
The USDCAD M15 chart presents a bullish price setup around the 1.38350–1.38410 support zone, with current price action consolidating just above this area.
Idea
Price bounced off the key support zone (blue box), suggesting buyer interest. The BB Squeeze momentum indicator shows weakening selling pressure, which could signal an upcoming bullish move.
Key Support: 1.38350
Upside Targets: 1.38650, 1.38880, and 1.39039
Invalidation: Setup fails if price breaks below 1.38280
From the fundamental context, we can see that the Canadian dollar (CAD) is moving more in sync with the U.S. dollar (USD) again, a return to its historical behavior. This happens because Canada was spared from certain tariffs, making its economy more closely tied to U.S. growth sentiment—a key bullish factor for CAD when the USD strengthens. But because CAD is now closely tied to U.S. sentiment, CAD won't weaken as sharply, which might explain why the price is consolidating instead of spiking aggressively. As such, we might see a slow but steady move on the pair as time progresses.
Conclusion
As long as the price holds above the 1.38350 support zone, a bullish continuation toward the mentioned targets is likely.
Cheers and happy trading.
