USDCAD I Weekly CLS I Model 1 I KL - OB I Target CLS LowYo Market Warriors ⚔️
BIG SHORT — if you’ve been riding with me, you already know:
🎯My system is 100% mechanical. No emotions. No trend lines. No subjective guessing. Just precision, structure, and sniper entries.
🧠 What’s CLS?
It’s the real smart money. The invisible hand behind $7T/day — banks, algos, central players.
📍Model 1:
HTF bias based on the daily and weekly candles closes,
Wait for CLS candle to be created and manipulated. Switch to correct LTF and spot CIOD. Enter and target 50% of the CLS candle.
For high probability include Dealing Ranges, Weekly Profiles and CLS Timing.
Trading is like a sport. If you consistently practice you can learn it.
“Adapt what is useful. Reject whats useless and add whats is specifically yours.”
David Perk aka Dave FX Hunter
💬 Don't hesitate to ask any questions or share your opinions
USDCAD trade ideas

USDCAD I Weekly CLS I Model 1 I Targe 50% CLSYo Market Warriors ⚔️
Fresh outlook drop — if you’ve been riding with me, you already know:
🎯My system is 100% mechanical. No emotions. No trend lines. No subjective guessing. Just precision, structure, and sniper entries.
🧠 What’s CLS?
It’s the real smart money. The invisible hand behind $7T/day — banks, algos, central players.
📍Model 1:
HTF bias based on the daily and weekly candles closes,
Wait for CLS candle to be created and manipulated. Switch to correct LTF and spot CIOD. Enter and target 50% of the CLS candle.
For high probability include Dealing Ranges, Weekly Profiles and CLS Timing.
Trading is like a sport. If you consistently practice you can learn it.
“Adapt what is useful. Reject whats useless and add whats is specifically yours.”
David Perk aka Dave FX Hunter
💬 Don't hesitate to ask any questions or share your opinions

USDCAD MARKET OUTLOOK📊 USDCAD Institutional Market Outlook
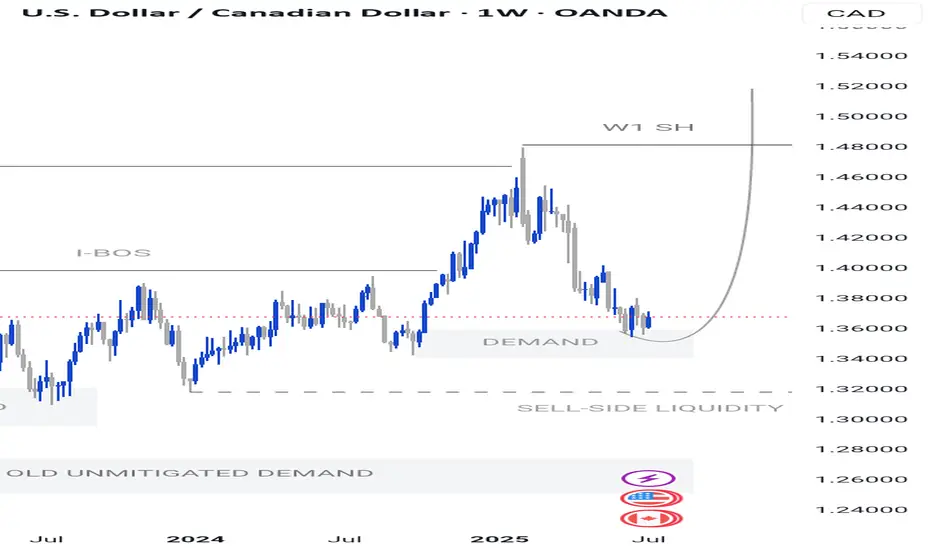
🔷 Monthly & Weekly Structure – Bearish Bias
A Monthly Fair Value Gap (FVG) was formed after a breakaway gap, closing all prior bullish FVGs. This signals strong bearish intent from institutions, with a likely draw toward the next key liquidity level at 1.34210.
Similarly, a Weekly FVG, also formed from a breakaway imbalance, is currently acting as an unmitigated supply zone. Historically, FVGs formed from breakaway moves are not revisited until the market completes its delivery to a main liquidity pool — in this case, the 1.34210 level.
Price is now consolidating below this weekly FVG, reinforcing a continuation bias rather than reversal.
🔹 Daily Structure – Short-Term Countertrend Rally
A bullish Daily FVG has recently formed, suggesting a possible short-term countertrend rally.
However, due to the breakaway nature of the weekly FVG, price is unlikely to reach back up to 1.3760 before continuing its bearish path.
A probable scenario: price may react from daily demand zones, push into a short-term premium area, then resume its decline toward 1.34210.
🌐 Fundamental Confluence
🟥 CAD Weakness:
U.S. tariff policy is placing heavy pressure on the Canadian economy, especially in autos, steel, and oil sectors.
Recent SECO reports and tariff-related projections expect a long-term GDP drag of ~2.1%.
Although oil prices have slightly rebounded, it's not enough to counterbalance the trade and policy headwinds.
🟩 USD Strength:
The U.S. dollar remains supported by global safe haven flows and a resilient macro backdrop.
No significant shift in Fed policy tone has emerged, and the USD continues to benefit from relative strength across multiple pairs.
| Timeframe | Bias | Reason |
| ------------ | ------------------------ | ------------------------------------------------------------------------- |
| Monthly | Bearish | Breakaway FVG + closed bullish zones → draw toward 1.34210 |
| Weekly | Bearish | Consolidation below breakaway supply zone |
| Daily | Short-term bullish | Countertrend move expected into local premium, likely to fail near 1.3760 |
| Fundamentals | Bearish CAD, Bullish USD | Tariff risks + economic divergence

Remains Below 1.3700 Ahead of CPI Data from the US and CADUSD/CAD Remains Below 1.3700 Ahead of CPI Data from the US and Canada
USD/CAD continues to decline ahead of inflation data from both the US and Canada.
The US inflation rate is expected to rise to 2.7% year-over-year in June, up from 2.4% recorded in May.
Meanwhile, Canada’s CPI is forecasted to increase by 1.9% year-over-year in June, up from 1.7% in May.
USD/CAD is trading around 1.3690 during the European session on Tuesday, following two days of gains. The pair is declining as the US dollar (USD) continues to weaken ahead of the June CPI data from the US. The inflation figures will provide new insights into the Federal Reserve's (Fed) monetary outlook.
📉 Market Outlook for USD/CAD – Possible Drop on CPI Release
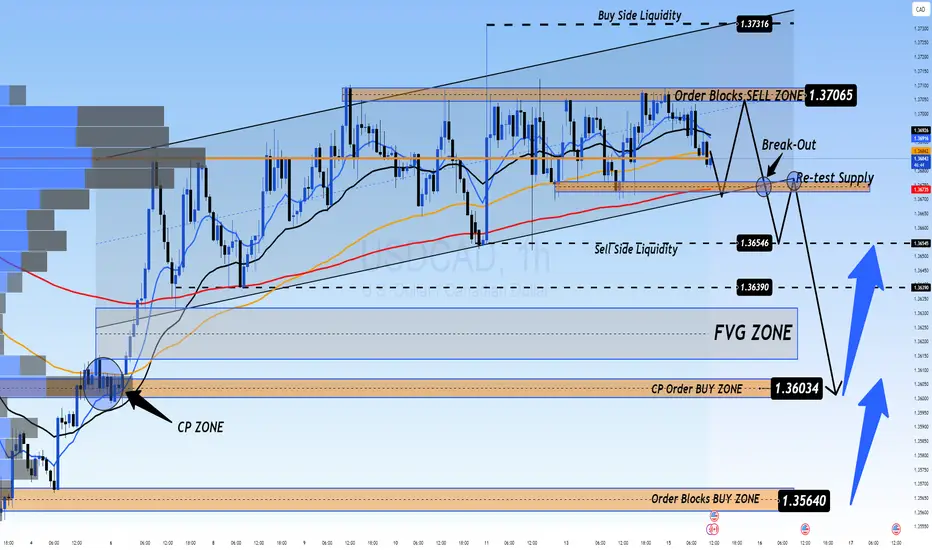
The USDCAD is still in a downtrend, and a sharp drop could occur with today’s CPI data release. Currently, there are two Buy Side Liquidity zones above and Sell Side Liquidity below, with the price balanced around the VPOC zone, which will soon decide the direction after the CPI announcement today.
Market liquidity still holds a FVG below, and with CPI data expected to favor USD, this could trigger a sharp drop towards this liquidity zone, possibly nearing CP OBS at 1.3600, followed by a potential rebound.
If price breaks CP zone, it may head toward a strong OB zone near 1.35xxx. Therefore, caution is advised when monitoring these OB zones.
🎯 Trading Strategy for Today
🟢 BUY ZONE: 1.36000
SL: 1.35500
TP: 1.36500 → 1.37000 → 1.37500 → ????
💬 What are your thoughts on USD/CAD ahead of the CPI data release? Do you expect a strong bounce or a continued decline? Share your views and join the conversation below!
👉 Follow for more updates and insights, and join the community to discuss real-time market moves!
USDCAD Potential DownsidesHey Traders, in today's trading session we are monitoring USDCAD for a selling opportunity around 1.37200 zone, USDCAD is trading in a downtrend and currently is in a correction phase in which it is approaching the trend at 1.37200 support and resistance area.
Trade safe, Joe.
4 HOUR CONFIRMATION- USDCAD ENTRY UPDATEPrice tapped in our Weekly Demand ideal 👌 for long buys.
Previously i anticipated a trend shift H4 as guide , cmp price just break our int previous high meaning change a in trend as we anticipated
Now waiting for price to drop to our int demand then we rise or the breaker block can hold - major reactions

USD Dollar Canadian Dollar AnalysisThe US dollar is gaining strength due to Trump tarrif polices but the strength will be short live. The downward movement might continue around 1.38404 with a stop loss of 1.38676 and take profit of 1.35287

USD/CAD) Down Trand Read The captionSMC trading point update
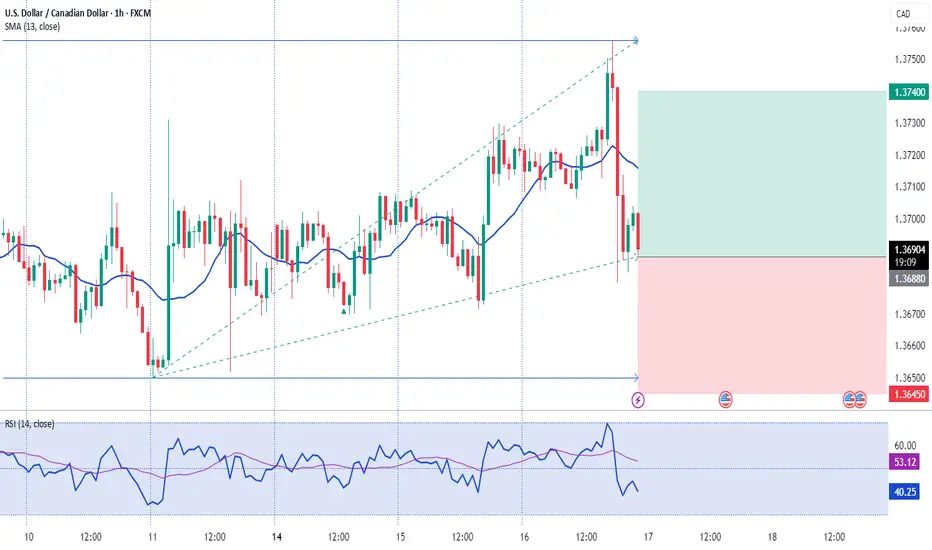
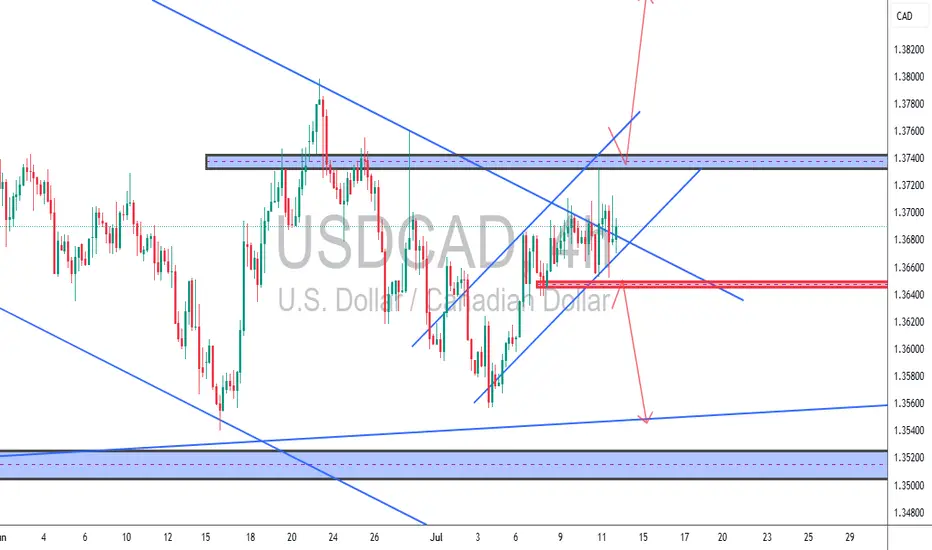
Technical analysis of USD/CAD (U.S. Dollar / Canadian Dollar) on the 1-hour timeframe, with a focus on a potential double-top formation at strong resistance, followed by a drop toward support:
---
Analysis Overview
Trend Structure: Downward-sloping channel with lower highs and lower lows.
Confluence Area: The current rally is approaching both the upper channel boundary and a significant horizontal resistance zone (~1.3660–1.3700).
---
Key Technical Elements
1. Resistance & Double-Top Setup
The price nears the resistance zone (yellow) where it previously reversed (noted by red arrows).
A cap-and-float pattern (double/top-like structure) is projected: price pushes higher, hesitates, tests resistance again, then fails—a sign of weakening bullish momentum.
2. EMA 200 Interaction
The 1-hour EMA 200 (blue line at ~1.3635) sits just below current price.
A failure to sustain above this level reinforces the bearish case.
3. RSI Overextension
RSI (14) is around 64–69, indicating near-overbought conditions on this timeframe, suggesting a potential pullback.
4. Price Targets
Initial target: Lower channel boundary near 1.3556 (highlighted support).
Extended target: Beneath to 1.3540, aligning with the broader Demand zone.
---
Proposed Trade Setup
Step Action Level
Entry Short near top of resistance/channel (after double-top confirmation) 1.3680–1.3700
Stop-Loss Above recent high and channel resistance ~1.3720
Take Profit 1 Near EMA 200/lower channel bounce ~1.3556
Take Profit 2 Extended move to demand zone ~1.3540
Estimated Move ~1.15% drop from midday highs –
---
Risk & Event Factors
Scheduled Canadian or U.S. data releases (icons shown) could introduce volatility and disrupt technical patterns.
A breakout above ~1.3720 would invalidate this bearish thesis and shift bias bullish.
Mr SMC Trading point
---
Summary
Expecting a cap-and-float double-top formation at key resistance near 1.3660–1.3700, followed by a trend continuation drop toward 1.3556–1.3540. The bearish setup is supported by a down-channel structure, EMA 200 failure, and overbought RSI conditions.
Please support boost 🚀 this analysis)

uptrendIt is expected that after some fluctuation and correction, the upward trend will continue. A break and consolidation above the resistance trend line will be a confirmation of the upward trend.
Otherwise, a continuation of the downward trend with a break of the green support range will be possible.

Potential bullish rise?The Loonie (USD/CAD) is reacting off the pivot and could rise to the 1st resistance which is a pullback resistance that aligns with the 127.2% Fibonacci extension.
Pivot: 1.3690
1st Support: 1.3619
1st Resistance: 1.3856
Risk Warning:
Trading Forex and CFDs carries a high level of risk to your capital and you should only trade with money you can afford to lose. Trading Forex and CFDs may not be suitable for all investors, so please ensure that you fully understand the risks involved and seek independent advice if necessary.
Disclaimer:
The above opinions given constitute general market commentary, and do not constitute the opinion or advice of IC Markets or any form of personal or investment advice.
Any opinions, news, research, analyses, prices, other information, or links to third-party sites contained on this website are provided on an "as-is" basis, are intended only to be informative, is not an advice nor a recommendation, nor research, or a record of our trading prices, or an offer of, or solicitation for a transaction in any financial instrument and thus should not be treated as such. The information provided does not involve any specific investment objectives, financial situation and needs of any specific person who may receive it. Please be aware, that past performance is not a reliable indicator of future performance and/or results. Past Performance or Forward-looking scenarios based upon the reasonable beliefs of the third-party provider are not a guarantee of future performance. Actual results may differ materially from those anticipated in forward-looking or past performance statements. IC Markets makes no representation or warranty and assumes no liability as to the accuracy or completeness of the information provided, nor any loss arising from any investment based on a recommendation, forecast or any information supplied by any third-party.

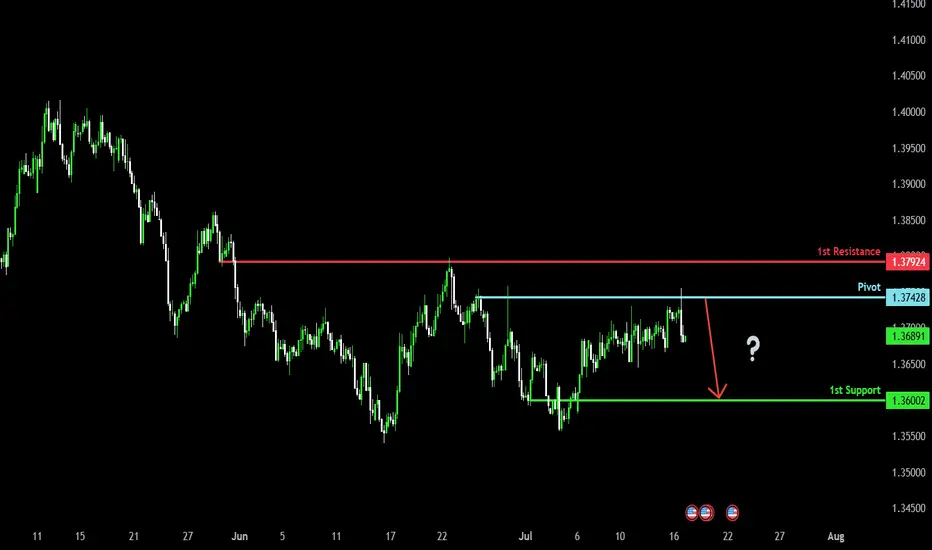
Bearish drop?The Loonie (USD/CAD) has rejected off the pivot which acts as a pullback resistance, and could drop to the 1st support.
Pivot: 1.3742
1st Support: 1.3600
1st Resistance: 1.3792
Risk Warning:
Trading Forex and CFDs carries a high level of risk to your capital and you should only trade with money you can afford to lose. Trading Forex and CFDs may not be suitable for all investors, so please ensure that you fully understand the risks involved and seek independent advice if necessary.
Disclaimer:
The above opinions given constitute general market commentary, and do not constitute the opinion or advice of IC Markets or any form of personal or investment advice.
Any opinions, news, research, analyses, prices, other information, or links to third-party sites contained on this website are provided on an "as-is" basis, are intended only to be informative, is not an advice nor a recommendation, nor research, or a record of our trading prices, or an offer of, or solicitation for a transaction in any financial instrument and thus should not be treated as such. The information provided does not involve any specific investment objectives, financial situation and needs of any specific person who may receive it. Please be aware, that past performance is not a reliable indicator of future performance and/or results. Past Performance or Forward-looking scenarios based upon the reasonable beliefs of the third-party provider are not a guarantee of future performance. Actual results may differ materially from those anticipated in forward-looking or past performance statements. IC Markets makes no representation or warranty and assumes no liability as to the accuracy or completeness of the information provided, nor any loss arising from any investment based on a recommendation, forecast or any information supplied by any third-party.
US Dollar Strengthens Following Trump’s Tariff DecisionUS Dollar Strengthens Following Trump’s Tariff Decision
US President Donald Trump has announced his decision to impose new tariffs:
→ For Canada, tariffs are set at 35%. They are scheduled to take effect on 1 August, although negotiations may take place before this date, potentially influencing Trump’s final stance.
→ For many other countries, tariffs may be set at 15% or 20%;
→ For the European Union, the exact tariff levels have not yet been disclosed.
Overall, Trump’s latest comments have added to the uncertainty surrounding the specific tariffs to be applied to each country. The financial markets reacted as follows:
→ The US dollar strengthened against other currencies (including the Canadian dollar);
→ Equity markets saw a modest decline.
Technical Analysis of the USD/CAD Chart
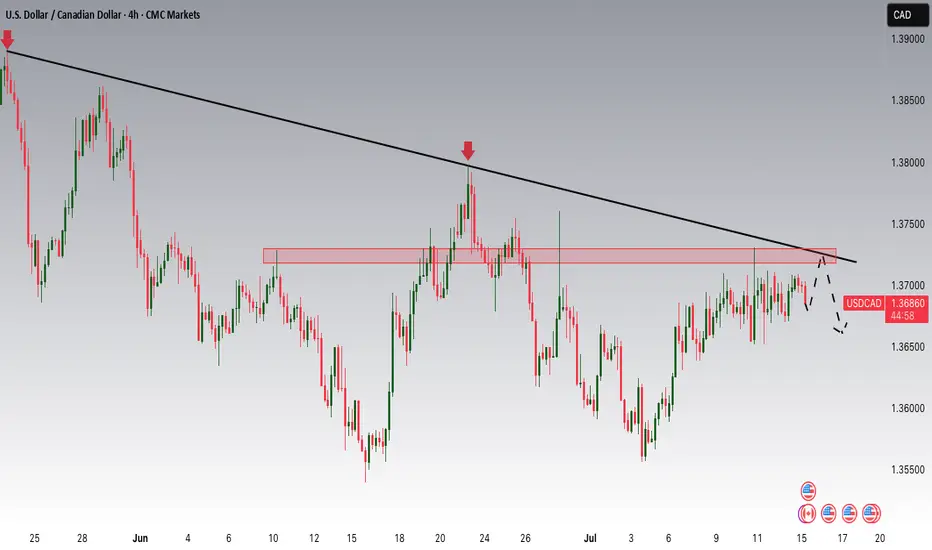
As soon as the announcement of a 35% tariff on Canadian imports to the US was made public, the USD/CAD rate spiked sharply (as indicated by the arrow), reaching levels last seen at the end of June. In the hours that followed, the pair stabilised.
Taking a broader view, the chart appears to show a triangular formation, which consists of:
→ A descending resistance line (R);
→ A key support level (S) around 1.3570.
From this perspective, it is worth noting that the bulls’ attempt to break above the resistance line amid the 35% tariff news did not succeed, indicating strong selling pressure.
At the same time, the price action of USD/CAD in early July allows us to identify a local support level (marked by the blue line). This suggests that, for now, the pair is consolidating within a formation bounded by the blue support line and resistance line R.
However, how long this consolidation will last, and which direction the breakout will take, will most likely depend on the next round of news regarding US–Canada trade negotiations.
This article represents the opinion of the Companies operating under the FXOpen brand only. It is not to be construed as an offer, solicitation, or recommendation with respect to products and services provided by the Companies operating under the FXOpen brand, nor is it to be considered financial advice.

SDCAD 4H – Compression at Resistance📉📈 USDCAD 4H – Compression at Resistance | Breakout or Rejection?
Price is consolidating near a major supply zone inside a wedge structure.
We're at a key decision point: a clean breakout above 1.3750 = bullish continuation; a rejection and break of minor trendline support = bearish drop back to demand.
🧠 TCB Strategy in play: waiting for breakout confirmation or reversal candle.
Long above 1.3750 → Target 1.3840
Short below 1.3660 → Target 1.3560
🎯 High RRR in both directions.
Bearish drop?The Loonie (USD/CAD) has rejected off the pivot which acts as a pullback resistance, and could drop to the 1st support.
Pivot: 1.3742
1st Support: 1.3600
1st Resistance: 1.3792
Risk Warning:
Trading Forex and CFDs carries a high level of risk to your capital and you should only trade with money you can afford to lose. Trading Forex and CFDs may not be suitable for all investors, so please ensure that you fully understand the risks involved and seek independent advice if necessary.
Disclaimer:
The above opinions given constitute general market commentary, and do not constitute the opinion or advice of IC Markets or any form of personal or investment advice.
Any opinions, news, research, analyses, prices, other information, or links to third-party sites contained on this website are provided on an "as-is" basis, are intended only to be informative, is not an advice nor a recommendation, nor research, or a record of our trading prices, or an offer of, or solicitation for a transaction in any financial instrument and thus should not be treated as such. The information provided does not involve any specific investment objectives, financial situation and needs of any specific person who may receive it. Please be aware, that past performance is not a reliable indicator of future performance and/or results. Past Performance or Forward-looking scenarios based upon the reasonable beliefs of the third-party provider are not a guarantee of future performance. Actual results may differ materially from those anticipated in forward-looking or past performance statements. IC Markets makes no representation or warranty and assumes no liability as to the accuracy or completeness of the information provided, nor any loss arising from any investment based on a recommendation, forecast or any information supplied by any third-party.

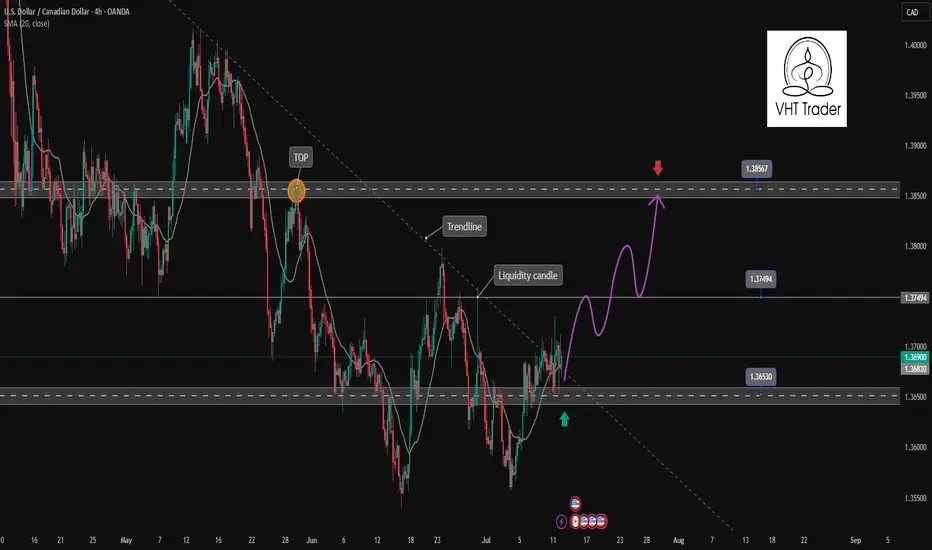
USDCAD is showing signs of bullish recovery✏️ OANDA:USDCAD has broken the Trendline structure to form a corrective uptrend. The price is still above the 20 SMA, indicating that the market's bullish momentum is still strong. The bullish wave may extend to 1.385. Pay attention to the reaction at the 1.375 liquidity candle wick zone for a positive DCA strategy.
📉 Key Levels
Support: 1.365
Resistance: 1.375-1.385
BUY Now: 1.365 (Strong support zone)
BUY Trigger: break and close above 1.375
Target: 1.385
Leave your comments on the idea. I am happy to read your views.
USDCAD (U.S. Dollar/Canadian Dollar) long (buy) setupUSDCAD (U.S. Dollar/Canadian Dollar) long (buy) setup. Here's the breakdown:
**Setup Overview**
* **Entry Level:** Around 1.3700
* **Take Profit (TP):** 1.3812 (upper green zone)
* **Stop Loss (SL):** 1.3638 (lower red zone)
**Technical Observations**
* Price is bouncing from a rising trendline (diagonal black line), suggesting bullish support.
* Price is trading above the 50 EMA, 21 EMA, and 7 EMA — indicating bullish momentum.
* A strong bullish candle with high volume occurred before consolidation, showing buyer interest.
* Tight consolidation near the entry level suggests potential for a breakout continuation upward.
**Bias**
* **Bullish** bias as long as price remains above the trendline and EMAs.
* The trade offers a favorable risk-to-reward ratio, targeting a \~110 pip gain vs. \~60 pip risk.
*Summary**
The chart shows a bullish trade setup on USDCAD based on trendline support, EMA alignment, and volume confirmation. A breakout above 1.3700 aims for 1.3812, while invalidation lies below 1.3638.

USDCAD D1 (Wave Analysis) - 11/7/2025USDCAD D1 (Wave Analysis) - 11/7/2025
As shown in chart, impulse Wave a or 1 is almost finished and we will go to corrective = wave b or 2.
as shown
regards,

USDCAD's Opportunity Bell Is Ringing — Don’t Miss Out!Hey there, my valued friends!
I’ve prepared a fresh USDCAD analysis just for you.
📌 If the 1.37245 level breaks, the next target will be 1.38000.
Every single like you send my way is the biggest motivation behind sharing these analyses.
🙌 Huge thanks to each and every one of you who supports me!
Would you like to add a visual or a catchy headline to boost engagement even more? I can help with that too.

SHORT USDCADyou can find your sell entry now cus its already at the poi reacting always remember lower tf mss still the best to me

UPDATE - PRICE HAS MITIGATED OUR DEMAND IDEAL FOR LONGSPreviously we were waiting for that retracement or pullback to Weekly Demand ideal for long buys
Now anticipating a trend change - Use H4 for confirmation then we can buy this to the moon.
I will drop the confirmation once confirmed
USD/CAD - Potential TargetsDear Friends in Trading,
How I see it,
PIVOT AREA @ 1.37000 - 1.37208
1) Pair is under fundamental pressure at this time.
2) We need a strong breach above PIVOT area to signal any
chance for broader bullish price action.
Keynote:
1.35775 = Key Demand
I sincerely hope my point of view offers a valued insight.
Thank you for taking the time to study my analysis.

Bearish drop?USD/CAD is rising towards the resistance level which is an overlap resistance at lines up with the 38.2% Fibonacci retracement and could drop from this level to our take profit.
Entry: 1.3706
Why we like it:
There is an overlap resistance that aligns with the 38.2% Fibonacci retracement.
Stop loss: 1.3746
Why we like it:
There is a swing high resistance.
Take profit: 1.3653
Why we like it:
There is a pullback support.
Enjoying your TradingView experience? Review us!
Please be advised that the information presented on TradingView is provided to Vantage (‘Vantage Global Limited’, ‘we’) by a third-party provider (‘Everest Fortune Group’). Please be reminded that you are solely responsible for the trading decisions on your account. There is a very high degree of risk involved in trading. Any information and/or content is intended entirely for research, educational and informational purposes only and does not constitute investment or consultation advice or investment strategy. The information is not tailored to the investment needs of any specific person and therefore does not involve a consideration of any of the investment objectives, financial situation or needs of any viewer that may receive it. Kindly also note that past performance is not a reliable indicator of future results. Actual results may differ materially from those anticipated in forward-looking or past performance statements. We assume no liability as to the accuracy or completeness of any of the information and/or content provided herein and the Company cannot be held responsible for any omission, mistake nor for any loss or damage including without limitation to any loss of profit which may arise from reliance on any information supplied by Everest Fortune Group.
