USD/CAD Battlelines Drawn at Former SupportUSD/CAD briefly registered in intraday low at 1.3540 last week before mounting a massive outside-weekly reversal off the yearly lows. The subsequent rally extended more than 1.9% off the low with the advance exhausting into resistance this week at 1.3795-1.3836- a region defined by the 61.8% retracement of the late-2023 advance, the April low-close, and the 23.6% retracement of the yearly range. Looking for inflection off this mark to offer guidance with the immediate recovery vulnerable while below.
Initial weekly support rests with the 61.8% retracement of the June range at 1.3639 with key support steady at the 1.618% extension of the February decline / 78.6% retracement at 1.3504/23- look for a larger reaction there If reached with a close below needed to mark resumption of the yearly downtrend. Subsequent support objectives rest with the 2024 low-week clow (LWC) at 1.3360 and the 2023 LWC at 1.3218.
A topside breach / close above the 2022 trendline (red) is needed to suggest a more significant low is in place / a larger recovery is underway with the next major technical consideration eyed at 1.3963-1.4018- a region defined by the 52-week moving average, the 2022 swing high and the 38.2% retracement. A weekly close above this key pivot zone is ultimately needed to invalidate the yearly downtrend in USD/CAD.
Bottom line: A rebound off the yearly channel is now approaching initial resistance at former support- looking for possible price inflection off the 1.3795-1.3835 zone into the monthly cross. From a trading standpoint, rallies would need to be limited to the 2022 trendline IF price is heading lower on this stretch / to validate a break of the multi-year uptrend with a close below 1.3504 still needed to mark resumption.
-MB
USDCAD trade ideas

USDCAD - Followed Oil💱 USDCAD Drop Aligned Perfectly with Oil Selloff
Instrument: USD/CAD
Timeframe: 15-Minute
Date: 23 June 2025
Indicator: ELFIEDT RSI + Reversion
🔍 What Happened:
While Crude Oil (WTI) began its sharp descent on Monday, the ELFIEDT system flagged a “DOWN” signal on USD/CAD — catching a clean reversal just above 1.3790.
This correlation isn't random. USD/CAD often mirrors oil’s movement in reverse — and ELFIEDT picked up on that dynamic perfectly.
As WTI tanked, CAD strength kicked in and USD/CAD sold off — just as our system anticipated.
💰 The Result:
From the top, price dropped well over 80 pips in a smooth, sustained move that lasted for days.
The signal:
✅ Caught the short high
✅ Delivered momentum without noise
✅ Confirmed cross-market alignment for confident entries
When both WTI and USD/CAD fire in sync, you know you're trading with structure.
📌 Why It Stands Out:
You didn’t need to know the macro correlation.
You didn’t need a complex multi-screen setup.
ELFIEDT simply printed the DOWN label, and price followed.
One system. One signal. Multiple assets—aligned.
📈 When Everything Aligns, Confidence Is Easy
The system gave short setups on WTI and USD/CAD on the same day — both delivering clean, profitable moves.
That’s the power of ELFIEDT — built to read shifts before they become obvious.

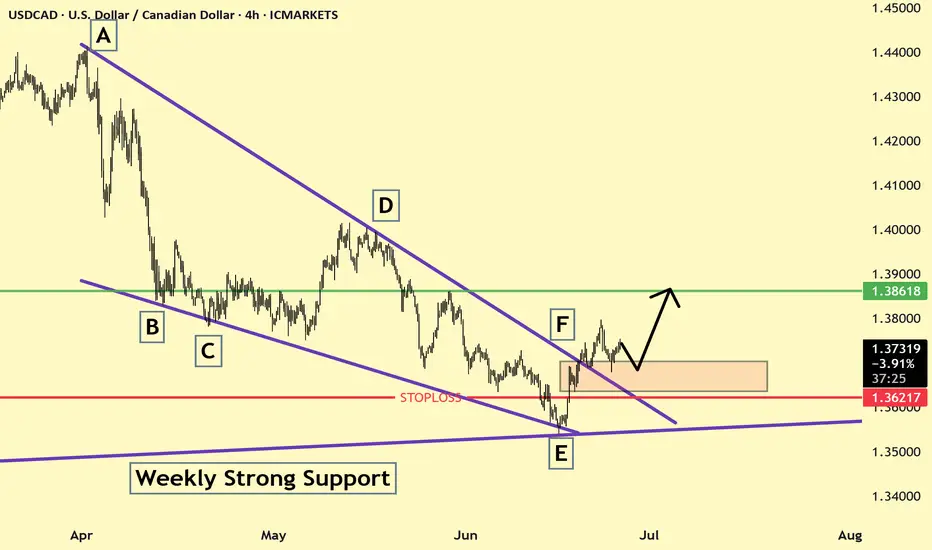
USDCAD Falling Wedge Breakout and Retest ScenarioThe USDCAD 4H chart shows a completed falling wedge pattern with a breakout near point F. Price is currently pulling back into a key demand zone, suggesting a bullish retest before a potential continuation toward the 1.38618 target. A strong weekly support level underpins the move, with stop loss set below 1.36217 to manage risk.
USDCAD oversold rally capped at 1.3800The USDCAD pair continues to trade within a broader bearish trend, with recent price action suggesting a temporary oversold rebound. The pair is currently attempting to recover from near-term lows, yet remains capped below a key technical resistance level.
Key Resistance: 1.3800 – This level marks a prior consolidation zone and represents immediate resistance. A test and rejection here would reinforce the broader bearish structure.
Support Levels:
1.3670 – First major support, aligning with previous demand zones.
1.3635 – Secondary support, potentially acting as a pivot in extended declines.
1.3600 – Psychological and structural support; a break below would strengthen the bearish case.
Bullish Scenario: A decisive breakout above 1.3800 with a daily close would invalidate the current bearish bias and could lead to a rally toward the 1.3850 and 1.3880 resistance zones.
Technical Indicators:
Momentum is showing early signs of recovery from oversold conditions, but lacks confirmation for trend reversal.
Moving averages are tilted lower, reinforcing downside pressure unless a sustained breakout occurs.
Conclusion:
The bias for USDCAD remains bearish below the 1.3800 resistance zone. A rejection at this level could trigger renewed downside pressure toward 1.3670 and beyond. However, a confirmed breakout above 1.3800 and a daily close would shift momentum in favor of the bulls, opening the path for further upside retracement. Traders should monitor price action closely at 1.3800 for directional confirmation.
This communication is for informational purposes only and should not be viewed as any form of recommendation as to a particular course of action or as investment advice. It is not intended as an offer or solicitation for the purchase or sale of any financial instrument or as an official confirmation of any transaction. Opinions, estimates and assumptions expressed herein are made as of the date of this communication and are subject to change without notice. This communication has been prepared based upon information, including market prices, data and other information, believed to be reliable; however, Trade Nation does not warrant its completeness or accuracy. All market prices and market data contained in or attached to this communication are indicative and subject to change without notice.

USDCAD-SELL strategy 3 hourly Reg. ChannelThe pair is same as other pairs, in BUY mode (USDX higher etc). OIL is stead, and any action could lead to another attempt pushing OIL price higher. we have two items to consider, one being USDX upward potential, and second, OIL price increases.
Technically we are overbought short-term and even 6-hourly is starting to look this way. We are above the reg.channel boundary, and indicators still positive.
Strategy SELL @ 1.3800-1.3840 area and take profit near 1.3637 for now.

USDCAD: Oil Price Weakness Weighs on CAD – Can USD Capitalize?USDCAD: Oil Price Weakness Weighs on CAD – Can USD Capitalize?
Hello TradingView community!
Today, let's analyze the USDCAD pair, which is showing interesting dynamics as the CAD faces pressure from falling oil prices.
🌍 Macro Drivers: CAD Struggles Amidst Lower Oil, USD Upside Limited
The USDCAD pair is caught in a tug-of-war between the Canadian Dollar (CAD) and the US Dollar (USD):
CAD pressured by oil: The Canadian Dollar has seen its gains trimmed, primarily weighed down by lower crude oil prices. Canada, being a major oil exporter, sees its currency directly impacted by these fluctuations.
Oil prices lower: A recent truce between Israel and Iran is keeping crude oil prices significantly lower (16% below Monday's highs), directly affecting CAD's strength.
USD's limited upside: Despite CAD's weakness, the US Dollar's upside attempts are being constrained by recent soft US economic data and persistent hopes for Federal Reserve (Fed) monetary policy easing.
In summary, USDCAD is seeing a slight upward tick due to a weaker CAD from oil price drops, but the USD's rally is somewhat capped by Fed easing expectations.
📊 Technical Analysis & USDCAD Trading Plan
Based on the USDCAD chart (H4/M30) provided:
Overall Trend: USDCAD is trading within an ascending channel, but shows signs of weakness near the channel's upper boundary. Price appears to be forming a lower high after a previous upward move.
Key Price Levels:
Potential SELL Zone (Resistance): Clearly identified around 1.36989. This is a strong resistance level, coinciding with recent local highs. Selling pressure is likely to emerge here.
Key Support (Potential BUY Zone): Around 1.36734 and further down at 1.36431. The 1.36431 level is particularly significant, aligning with a major Fibonacci level (1.382) and acting as a robust demand area from prior price action.
Moving Averages (EMAs): Price is trading near the EMAs (black, orange, red), indicating a consolidation phase and potential for a significant move.
Projected Price Action: The chart suggests that USDCAD could pull back from the current resistance zone (1.36989) towards the support levels below, particularly 1.36431, before potentially finding buying interest to resume an upward trend.
🎯 USDCAD Trading Plan:
SELL ZONE: 1.36989
SL: 1.37050
TP: 1.36900 - 1.36850 - 1.36800 - 1.36750 - 1.36700 - 1.36600 - 1.36500 - 1.36431
BUY ZONE: 1.36431
SL: 1.36300
TP: 1.36500 - 1.36550 - 1.36600 - 1.36650 - 1.36700 - 1.36750 - 1.36800 - 1.36900
⚠️ Key Factors to Monitor:
Crude Oil Prices: Any significant movements in crude oil will directly impact the CAD.
US Economic Data: Upcoming reports on inflation and employment from the US could heavily influence Fed policy expectations and USD strength.
Bank of Canada (BoC) Policy: Statements or decisions from the BoC will also be a critical factor affecting the CAD.
Trade smart and stay vigilant! Wishing everyone a successful USDCAD trading day!

USDCAD BUY OPPORTUNITY!!!Price is due for entry as our trading strategy is met. We’re buying from the current market price of 1.37297 our stop loss level is 1.37050 take profit at 1.37799

Bullish bounce off pullback support?The Loonie (USD/CAD) has bounced of the pivot and could rise to the 1st resistance which acts as a pullback resistance.
Pivot: 1.3674
1st Support: 1.3599
1st Resistance: 1.3793
Risk Warning:
Trading Forex and CFDs carries a high level of risk to your capital and you should only trade with money you can afford to lose. Trading Forex and CFDs may not be suitable for all investors, so please ensure that you fully understand the risks involved and seek independent advice if necessary.
Disclaimer:
The above opinions given constitute general market commentary, and do not constitute the opinion or advice of IC Markets or any form of personal or investment advice.
Any opinions, news, research, analyses, prices, other information, or links to third-party sites contained on this website are provided on an "as-is" basis, are intended only to be informative, is not an advice nor a recommendation, nor research, or a record of our trading prices, or an offer of, or solicitation for a transaction in any financial instrument and thus should not be treated as such. The information provided does not involve any specific investment objectives, financial situation and needs of any specific person who may receive it. Please be aware, that past performance is not a reliable indicator of future performance and/or results. Past Performance or Forward-looking scenarios based upon the reasonable beliefs of the third-party provider are not a guarantee of future performance. Actual results may differ materially from those anticipated in forward-looking or past performance statements. IC Markets makes no representation or warranty and assumes no liability as to the accuracy or completeness of the information provided, nor any loss arising from any investment based on a recommendation, forecast or any information supplied by any third-party.

usdcad buyon daily frame we are going up on usdcad but u must have patience , you know this pair move slowly

USDCAD BUY OPPORTUNITY Price pulled back to a support level of 1.36712 a pretty nice level where we’re looking forward to seeing more bullish price action development. This pullback support shares a confluence with a trendline with a Doji candlestick pattern. We should be looking for a confirmation to go long.

Bullish bounce?USD/CAD has bouned off the support level which is an overlap support and could rise from this level too ur take profit.
Entry: 1.3687
Why we like it:
There is an overlap support level.
Stop loss: 1.3668
Why we like it:
There is a pullback support level.
Take profit: 1.3740
Why we like it:
There is a pullback resistance level that lines up with the 50% Fibonacci retracement.
Enjoying your TradingView experience? Review us!
Please be advised that the information presented on TradingView is provided to Vantage (‘Vantage Global Limited’, ‘we’) by a third-party provider (‘Everest Fortune Group’). Please be reminded that you are solely responsible for the trading decisions on your account. There is a very high degree of risk involved in trading. Any information and/or content is intended entirely for research, educational and informational purposes only and does not constitute investment or consultation advice or investment strategy. The information is not tailored to the investment needs of any specific person and therefore does not involve a consideration of any of the investment objectives, financial situation or needs of any viewer that may receive it. Kindly also note that past performance is not a reliable indicator of future results. Actual results may differ materially from those anticipated in forward-looking or past performance statements. We assume no liability as to the accuracy or completeness of any of the information and/or content provided herein and the Company cannot be held responsible for any omission, mistake nor for any loss or damage including without limitation to any loss of profit which may arise from reliance on any information supplied by Everest Fortune Group.

USDCADThis chart shows a **USDCAD 1-hour analysis** with a clear **bearish bias**.
### Key points:
* **Weekly Area of Interest (AOI)**: Around 1.37818–1.38109 — strong resistance area where price previously rejected.
* **Daily AOI target**: Around 1.35953 — expected final target of the move.
* **Price structure**:
* The market is forming **lower highs and lower lows**, suggesting a downtrend.
* Price is currently below the **50 EMA (blue)** and testing the **200 EMA (red)**, showing weakening bullish momentum.
* **Volume Profile**: High volume node left behind above current price, indicating a likely area of supply/resistance.
* **Expected move**: A **pullback and consolidation** is anticipated, followed by a **strong bearish continuation** towards the Daily AOI zone.
This is a **short setup** based on market structure, EMAs, and volume profile, targeting a deeper retracement.

Subtle Trading Challenges: Under-Discussed Psychological and OpsWhile traders often focus on well-known pitfalls like fear, greed, or overtrading , there are other subtle issues that can quietly undermine trading consistency and mindset. Below are a few under-discussed problems – touching on both psychology and day-to-day operations that many traders face.
Self-Worth Tied to Trading Performance
Some traders unknowingly tie their self-esteem or sense of self-worth to their trading results. When they have a losing day, they don’t just lose money – they feel personally defeated. This can trigger intense negative self-talk and emotional reactions to losses, sometimes causing traders to abandon their strategy or second-guess decisions in the heat of the moment. Because admitting such vulnerability is often seen as a weakness in trading circles, this issue rarely gets openly discussed, even though it can greatly sabotage a trader’s confidence and long-term consistency.
Analysis Paralysis and Decision Fatigue
In the age of overflowing data, traders can fall into “analysis paralysis” – overanalyzing market information to the point where they can’t make a clear decision. With countless indicators, news feeds, and opinions, it’s easy to get bogged down comparing options until no clear choice emerges, and this inaction can lead to missed profitable opportunities. Moreover, the mental strain of constantly dissecting information can cause decision fatigue, quietly diminishing the quality of any trades that are made. Unlike impulsive errors, this problem often masquerades as diligence, so it doesn’t get much attention in public discussions – yet it can erode a trader’s decisiveness and stress levels over time.
Constant Strategy Switching (System Hopping)
Another subtle pitfall is the tendency to jump between trading strategies too frequently, known as “system hopping.” Eager for a perfect method, traders might abandon a system after just a couple of losing trades and immediately switch to a new approach, never giving any strategy enough time to prove its worth. This habit – often fueled by impatience or get-rich-quick expectations – means the trader is always restarting the learning curve and never capitalizing on a method’s long-term edge. It’s an operational inconsistency that traders seldom admit openly, but it quietly undermines confidence and prevents the development of a stable, repeatable trading process.
Each of these problems tends to fly under the radar in trading forums or education, yet they subtly impact consistency and mindset. By recognizing these lesser-discussed challenges, traders can begin to address them and strengthen their overall discipline and performance.

USDCAD BUYBy utilizing Fibonacci retracement levels, historical patterns, , we can formulate a hypothesis that the market might follow a similar trajectory if bullish sentiment prevails.

USDCAD Bearish OutlookTrend: Bearish (Lower highs and lower lows)
Key Resistance / Invalidation Level: 1.38121
Current Price: ~1.3700–1.3750 range
Expected Move: Further downside towards the 1.3500–1.3420 area unless price breaks and closes above 1.38121.
---
🎯 Trade Plan
Setup: Look for bearish entries on retracements towards the 1.3700–1.3750 area.
Invalidation: A confirmed breakout and close above 1.38121.
Target: 1.3500–1.3420 range.
--
⚡️ Summary
USDCAD remains in a downtrend, making lower highs and lower lows. As long as price stays below 1.38121, the bearish outlook is favored.
---
⚠️ Disclaimer
This is NOT financial advice. All trading involves significant risk, and you should only trade with money you can afford to lose. Always do your own analysis or consult with a qualified financial advisor before making any trading decisions.

Symmetry 📍 Hello traders, hope you’re having a great start to the trading week!
USD/CAD has just completed a clean bearish AB=CD symmetry pattern, and we now have confirmed structure shift from the Price Completion Zone (PCZ). Price is rejecting perfectly, and the bearish move is now underway.
🌀 What we’re seeing:
AB=CD symmetry completed right into the 127.2–161.8% extension
Rejection from the D point followed by a strong bearish candle
Structure has shifted — new lower low and confirmed lower high
Price is now flowing cleanly from the top, confirming the setup
📌 Key levels and confluence:
Pattern completed with symmetry and fib alignment
PCZ respected with immediate rejection
Structure confirms sellers are in control below the D point
🎯 Target:
TP1: 23.6% retracement of CD leg — locked in and already reacting
Extended downside remains possible if structure stays bearish
⚠️ Risk management:
Entry: After confirmation below the D point
Stop: Above the D high — pattern invalidation level
Setup is live — manage it with precision
🧠 The pattern completed, price shifted, and the move is now in progress. Let structure lead. TP1 at 23% keeps it sharp.
Pattern. Trigger. Structure. Repeat.
— TradeChartPatternsLikeThePros

USDCAD BUY signal USDCAD is approaching towards the order block and the 1.37000 psychological level.
I expect a rejection and a reverse from that zone

USD/CAD H1 | Overlap support at 38.2% Fibonacci retracementUSD/CAD is falling towards an overlap support and could potentially bounce off this level to climb higher.
Buy entry is at 1.3686 which is an overlap support that aligns closely with the 38.2% Fibonacci retracement.
Stop loss is at 1.3623 which is a level that lies underneath an overlap support and the 61.8% Fibonacci retracement.
Take profit is at 1.3773 which is a swing-high resistance.
High Risk Investment Warning
Trading Forex/CFDs on margin carries a high level of risk and may not be suitable for all investors. Leverage can work against you.
Stratos Markets Limited (tradu.com ):
CFDs are complex instruments and come with a high risk of losing money rapidly due to leverage. 63% of retail investor accounts lose money when trading CFDs with this provider. You should consider whether you understand how CFDs work and whether you can afford to take the high risk of losing your money.
Stratos Europe Ltd (tradu.com ):
CFDs are complex instruments and come with a high risk of losing money rapidly due to leverage. 63% of retail investor accounts lose money when trading CFDs with this provider. You should consider whether you understand how CFDs work and whether you can afford to take the high risk of losing your money.
Stratos Global LLC (tradu.com ):
Losses can exceed deposits.
Please be advised that the information presented on TradingView is provided to Tradu (‘Company’, ‘we’) by a third-party provider (‘TFA Global Pte Ltd’). Please be reminded that you are solely responsible for the trading decisions on your account. There is a very high degree of risk involved in trading. Any information and/or content is intended entirely for research, educational and informational purposes only and does not constitute investment or consultation advice or investment strategy. The information is not tailored to the investment needs of any specific person and therefore does not involve a consideration of any of the investment objectives, financial situation or needs of any viewer that may receive it. Kindly also note that past performance is not a reliable indicator of future results. Actual results may differ materially from those anticipated in forward-looking or past performance statements. We assume no liability as to the accuracy or completeness of any of the information and/or content provided herein and the Company cannot be held responsible for any omission, mistake nor for any loss or damage including without limitation to any loss of profit which may arise from reliance on any information supplied by TFA Global Pte Ltd.
The speaker(s) is neither an employee, agent nor representative of Tradu and is therefore acting independently. The opinions given are their own, constitute general market commentary, and do not constitute the opinion or advice of Tradu or any form of personal or investment advice. Tradu neither endorses nor guarantees offerings of third-party speakers, nor is Tradu responsible for the content, veracity or opinions of third-party speakers, presenters or participants.

USDCAD Sell opportunity - Daily trend down - at the top of Daily regression channel indicating sell, also hit FVG, which is holding below - hourly and 4H chart also confirming this is "likely" to move down rather than break to the upside.

USDCAD - Long triggered We have entered into the discount area of the most recent swing point on USDCAD. With doing this we have taken out all the areas of liquidity within the trading range so it was time to look for potential long moves.
Now at current price we have had a great example of AMD where by we
Accumulate
Manipulate
and then the hope is that we begin to distribute higher.
There was also a nice fair value gap that was left behind on the 5min
So all that was left to do was execute.
Let us see how it plays out.
Win or lose great entry super happy with the trade. Lets see how it goes
USD/CAD: Failed Break Leaves Bears in ControlWhether it’s Monday’s bearish pin candle, the rejection at the 50-day moving average, or what increasingly looks like an evening star pattern forming, directional risks for USD/CAD look to be skewing lower following the false break of 1.3750.
Those looking to position for renewed weakness could initiate shorts beneath 1.3750, with a stop above the level to guard against a reversal. 1.3650 and 1.3550 both stand as prospective targets, depending on the risk-reward profile you're seeking.
While momentum indicators are off their lows, with RSI (14) rolling over beneath 50 and MACD still in negative territory, the overall picture continues to favour downside over upside.
For those considering the setup, be aware Canadian inflation data will be released later Tuesday, with the key core rate (the average of the median and trimmed mean reads) expected to ease marginally to an annual clip of 3%. While offshore factors remain the dominant driver of USD/CAD moves, a stronger-than-expected result would likely benefit the trade.
Good luck!
DS

USDCAD BUY OPPORTUNITY Am seeing a buy Opportunities on usdcad.
Entry: 1.37200
Stoploss: 1.37041
Take profit: 1.38500
Always wait for chart pattern and Price action arround the entry before clicking the buy button
Comment your opinion pls.
For Account management. Contact me on X @shajudeakinoba1

SELL USDCADOverbought price after FOMC release yesterday has elevated price action to a sweet sell kill zone, we expect a deep bearish correction however remember that anything is possible.
