Bullish bounce?USD/CAD has bouned off the support level which is an overlap support and could rise from this level too ur take profit.
Entry: 1.3687
Why we like it:
There is an overlap support level.
Stop loss: 1.3668
Why we like it:
There is a pullback support level.
Take profit: 1.3740
Why we like it:
There is a pullback resistance level that lines up with the 50% Fibonacci retracement.
Enjoying your TradingView experience? Review us!
Please be advised that the information presented on TradingView is provided to Vantage (‘Vantage Global Limited’, ‘we’) by a third-party provider (‘Everest Fortune Group’). Please be reminded that you are solely responsible for the trading decisions on your account. There is a very high degree of risk involved in trading. Any information and/or content is intended entirely for research, educational and informational purposes only and does not constitute investment or consultation advice or investment strategy. The information is not tailored to the investment needs of any specific person and therefore does not involve a consideration of any of the investment objectives, financial situation or needs of any viewer that may receive it. Kindly also note that past performance is not a reliable indicator of future results. Actual results may differ materially from those anticipated in forward-looking or past performance statements. We assume no liability as to the accuracy or completeness of any of the information and/or content provided herein and the Company cannot be held responsible for any omission, mistake nor for any loss or damage including without limitation to any loss of profit which may arise from reliance on any information supplied by Everest Fortune Group.
USDCAD trade ideas

USDCADThis chart shows a **USDCAD 1-hour analysis** with a clear **bearish bias**.
### Key points:
* **Weekly Area of Interest (AOI)**: Around 1.37818–1.38109 — strong resistance area where price previously rejected.
* **Daily AOI target**: Around 1.35953 — expected final target of the move.
* **Price structure**:
* The market is forming **lower highs and lower lows**, suggesting a downtrend.
* Price is currently below the **50 EMA (blue)** and testing the **200 EMA (red)**, showing weakening bullish momentum.
* **Volume Profile**: High volume node left behind above current price, indicating a likely area of supply/resistance.
* **Expected move**: A **pullback and consolidation** is anticipated, followed by a **strong bearish continuation** towards the Daily AOI zone.
This is a **short setup** based on market structure, EMAs, and volume profile, targeting a deeper retracement.

Subtle Trading Challenges: Under-Discussed Psychological and OpsWhile traders often focus on well-known pitfalls like fear, greed, or overtrading , there are other subtle issues that can quietly undermine trading consistency and mindset. Below are a few under-discussed problems – touching on both psychology and day-to-day operations that many traders face.
Self-Worth Tied to Trading Performance
Some traders unknowingly tie their self-esteem or sense of self-worth to their trading results. When they have a losing day, they don’t just lose money – they feel personally defeated. This can trigger intense negative self-talk and emotional reactions to losses, sometimes causing traders to abandon their strategy or second-guess decisions in the heat of the moment. Because admitting such vulnerability is often seen as a weakness in trading circles, this issue rarely gets openly discussed, even though it can greatly sabotage a trader’s confidence and long-term consistency.
Analysis Paralysis and Decision Fatigue
In the age of overflowing data, traders can fall into “analysis paralysis” – overanalyzing market information to the point where they can’t make a clear decision. With countless indicators, news feeds, and opinions, it’s easy to get bogged down comparing options until no clear choice emerges, and this inaction can lead to missed profitable opportunities. Moreover, the mental strain of constantly dissecting information can cause decision fatigue, quietly diminishing the quality of any trades that are made. Unlike impulsive errors, this problem often masquerades as diligence, so it doesn’t get much attention in public discussions – yet it can erode a trader’s decisiveness and stress levels over time.
Constant Strategy Switching (System Hopping)
Another subtle pitfall is the tendency to jump between trading strategies too frequently, known as “system hopping.” Eager for a perfect method, traders might abandon a system after just a couple of losing trades and immediately switch to a new approach, never giving any strategy enough time to prove its worth. This habit – often fueled by impatience or get-rich-quick expectations – means the trader is always restarting the learning curve and never capitalizing on a method’s long-term edge. It’s an operational inconsistency that traders seldom admit openly, but it quietly undermines confidence and prevents the development of a stable, repeatable trading process.
Each of these problems tends to fly under the radar in trading forums or education, yet they subtly impact consistency and mindset. By recognizing these lesser-discussed challenges, traders can begin to address them and strengthen their overall discipline and performance.

USDCAD BUYBy utilizing Fibonacci retracement levels, historical patterns, , we can formulate a hypothesis that the market might follow a similar trajectory if bullish sentiment prevails.

USDCAD Bearish OutlookTrend: Bearish (Lower highs and lower lows)
Key Resistance / Invalidation Level: 1.38121
Current Price: ~1.3700–1.3750 range
Expected Move: Further downside towards the 1.3500–1.3420 area unless price breaks and closes above 1.38121.
---
🎯 Trade Plan
Setup: Look for bearish entries on retracements towards the 1.3700–1.3750 area.
Invalidation: A confirmed breakout and close above 1.38121.
Target: 1.3500–1.3420 range.
--
⚡️ Summary
USDCAD remains in a downtrend, making lower highs and lower lows. As long as price stays below 1.38121, the bearish outlook is favored.
---
⚠️ Disclaimer
This is NOT financial advice. All trading involves significant risk, and you should only trade with money you can afford to lose. Always do your own analysis or consult with a qualified financial advisor before making any trading decisions.

Symmetry 📍 Hello traders, hope you’re having a great start to the trading week!
USD/CAD has just completed a clean bearish AB=CD symmetry pattern, and we now have confirmed structure shift from the Price Completion Zone (PCZ). Price is rejecting perfectly, and the bearish move is now underway.
🌀 What we’re seeing:
AB=CD symmetry completed right into the 127.2–161.8% extension
Rejection from the D point followed by a strong bearish candle
Structure has shifted — new lower low and confirmed lower high
Price is now flowing cleanly from the top, confirming the setup
📌 Key levels and confluence:
Pattern completed with symmetry and fib alignment
PCZ respected with immediate rejection
Structure confirms sellers are in control below the D point
🎯 Target:
TP1: 23.6% retracement of CD leg — locked in and already reacting
Extended downside remains possible if structure stays bearish
⚠️ Risk management:
Entry: After confirmation below the D point
Stop: Above the D high — pattern invalidation level
Setup is live — manage it with precision
🧠 The pattern completed, price shifted, and the move is now in progress. Let structure lead. TP1 at 23% keeps it sharp.
Pattern. Trigger. Structure. Repeat.
— TradeChartPatternsLikeThePros

USDCAD BUY signal USDCAD is approaching towards the order block and the 1.37000 psychological level.
I expect a rejection and a reverse from that zone

USD/CAD H1 | Overlap support at 38.2% Fibonacci retracementUSD/CAD is falling towards an overlap support and could potentially bounce off this level to climb higher.
Buy entry is at 1.3686 which is an overlap support that aligns closely with the 38.2% Fibonacci retracement.
Stop loss is at 1.3623 which is a level that lies underneath an overlap support and the 61.8% Fibonacci retracement.
Take profit is at 1.3773 which is a swing-high resistance.
High Risk Investment Warning
Trading Forex/CFDs on margin carries a high level of risk and may not be suitable for all investors. Leverage can work against you.
Stratos Markets Limited (tradu.com ):
CFDs are complex instruments and come with a high risk of losing money rapidly due to leverage. 63% of retail investor accounts lose money when trading CFDs with this provider. You should consider whether you understand how CFDs work and whether you can afford to take the high risk of losing your money.
Stratos Europe Ltd (tradu.com ):
CFDs are complex instruments and come with a high risk of losing money rapidly due to leverage. 63% of retail investor accounts lose money when trading CFDs with this provider. You should consider whether you understand how CFDs work and whether you can afford to take the high risk of losing your money.
Stratos Global LLC (tradu.com ):
Losses can exceed deposits.
Please be advised that the information presented on TradingView is provided to Tradu (‘Company’, ‘we’) by a third-party provider (‘TFA Global Pte Ltd’). Please be reminded that you are solely responsible for the trading decisions on your account. There is a very high degree of risk involved in trading. Any information and/or content is intended entirely for research, educational and informational purposes only and does not constitute investment or consultation advice or investment strategy. The information is not tailored to the investment needs of any specific person and therefore does not involve a consideration of any of the investment objectives, financial situation or needs of any viewer that may receive it. Kindly also note that past performance is not a reliable indicator of future results. Actual results may differ materially from those anticipated in forward-looking or past performance statements. We assume no liability as to the accuracy or completeness of any of the information and/or content provided herein and the Company cannot be held responsible for any omission, mistake nor for any loss or damage including without limitation to any loss of profit which may arise from reliance on any information supplied by TFA Global Pte Ltd.
The speaker(s) is neither an employee, agent nor representative of Tradu and is therefore acting independently. The opinions given are their own, constitute general market commentary, and do not constitute the opinion or advice of Tradu or any form of personal or investment advice. Tradu neither endorses nor guarantees offerings of third-party speakers, nor is Tradu responsible for the content, veracity or opinions of third-party speakers, presenters or participants.

USDCAD Sell opportunity - Daily trend down - at the top of Daily regression channel indicating sell, also hit FVG, which is holding below - hourly and 4H chart also confirming this is "likely" to move down rather than break to the upside.

USDCAD - Long triggered We have entered into the discount area of the most recent swing point on USDCAD. With doing this we have taken out all the areas of liquidity within the trading range so it was time to look for potential long moves.
Now at current price we have had a great example of AMD where by we
Accumulate
Manipulate
and then the hope is that we begin to distribute higher.
There was also a nice fair value gap that was left behind on the 5min
So all that was left to do was execute.
Let us see how it plays out.
Win or lose great entry super happy with the trade. Lets see how it goes
USD/CAD: Failed Break Leaves Bears in ControlWhether it’s Monday’s bearish pin candle, the rejection at the 50-day moving average, or what increasingly looks like an evening star pattern forming, directional risks for USD/CAD look to be skewing lower following the false break of 1.3750.
Those looking to position for renewed weakness could initiate shorts beneath 1.3750, with a stop above the level to guard against a reversal. 1.3650 and 1.3550 both stand as prospective targets, depending on the risk-reward profile you're seeking.
While momentum indicators are off their lows, with RSI (14) rolling over beneath 50 and MACD still in negative territory, the overall picture continues to favour downside over upside.
For those considering the setup, be aware Canadian inflation data will be released later Tuesday, with the key core rate (the average of the median and trimmed mean reads) expected to ease marginally to an annual clip of 3%. While offshore factors remain the dominant driver of USD/CAD moves, a stronger-than-expected result would likely benefit the trade.
Good luck!
DS

SELL USDCADOverbought price after FOMC release yesterday has elevated price action to a sweet sell kill zone, we expect a deep bearish correction however remember that anything is possible.

Bullish bounce off overlap support?USD/CAD is falling towards the support level which is an overlap support that lines up with the 38.2% Fibonacci retracement an could bounce from this level to our take profit.
Entry: 1.3689
Why we like it:
There is an overlap support level that lines up with the 38.2% Fibonacci retracement.
Stop loss: 1.3647
Why we like it:
There is an overlap support level that lines up with the 61.8% Fibonacci retracement.
Take profit: 1.3815
Why we like it:
There is a pullback resistance level that aligns with the 145% Fibonacci extension.
Enjoying your TradingView experience? Review us!
Please be advised that the information presented on TradingView is provided to Vantage (‘Vantage Global Limited’, ‘we’) by a third-party provider (‘Everest Fortune Group’). Please be reminded that you are solely responsible for the trading decisions on your account. There is a very high degree of risk involved in trading. Any information and/or content is intended entirely for research, educational and informational purposes only and does not constitute investment or consultation advice or investment strategy. The information is not tailored to the investment needs of any specific person and therefore does not involve a consideration of any of the investment objectives, financial situation or needs of any viewer that may receive it. Kindly also note that past performance is not a reliable indicator of future results. Actual results may differ materially from those anticipated in forward-looking or past performance statements. We assume no liability as to the accuracy or completeness of any of the information and/or content provided herein and the Company cannot be held responsible for any omission, mistake nor for any loss or damage including without limitation to any loss of profit which may arise from reliance on any information supplied by Everest Fortune Group.

USDCAD-Expecting a PB to 1.42 and then HUGE FALL !!!DISCLAIMER : All labelling and wave counts done by me by manually and i will keep change according to the LIVE MARKET PRICE ACTION. So don't bias, hope on my trade plans...try to learn and make your own strategy...Following is not that much easy...I AM NOT RESPONSIBLE FOR ANY LOSSES IF U TOOK THE TRADE ACCORDING TO MY TRADE PLANS....THANKS LOT..CHEERS

USDCAD Still In a DowntrendAbout a week ago I posted that USDCAD is in a downtrend but I saw a potential for a retracement and a bounce in daily demand. The bounce happened and price retested a daily resistance zone. Now I believe the trend will continue to the downside.

USDCAD Eyes Oct 2022 Resistance Once AgainFollowing the U.S.–Iran strike over the weekend, the U.S. dollar strengthened, posting solid rebounds across major dollar pairs. The USD/CAD chart, in particular, climbed back toward the 1.38 level.
The pair is now eyeing a key resistance zone between 1.3840 and 1.3880, a range that has consistently held since October 2022. A decisive break and hold above this zone could pave the way for a continued rally toward the 1.40 mark.
Conversely, a drop back below 1.3600 could signal renewed downside risk for 2025, in line with the broader bearish trend that has defined the year so far.
— Razan Hilal, CMT

USD/CAD — Rising Wedge Reversal Loading…
A steep rising wedge has formed — a classic bearish pattern often signaling exhaustion.
Price is testing strong yellow resistance zones between 1.3795 – 1.3855.
Entry Dates:
📅 June 23 & 24 — ideal windows to catch a possible reversal.
📉 Bearish Targets:
→ 1.3750
→ 1.3700
→ 1.3640
→ More downside if momentum kicks in.
🧠 This setup screams “overbought squeeze → sharp drop”. Big players might be waiting to short the rip.

Bearish momentum to meet support on USDCAD: Looking for a bounceEvening, just wanted to share what I’m seeing on the USDCAD chart
Price on USDCAD has been in clear bearish momentum, but we’re now approaching a strong support zone, that’s held firm multiple times before, as I marked it on my chart. Price is approaching the zone again and I am taking it into account for a potential bounce.
I’ll be watching for bullish confirmation as usual requirement before entering. If that support holds, I’m targeting 1.38400 , totally achievable if momentum shifts.
BUT, if this zone breaks with momentum, I’ll reassess it and stay flexible.
💡 Reminder: Patience is power, no entry until price shows me something worth reacting to. This is not financial advice.

USDCAD is Nearing The Daily TrendHey Traders, in today's trading session we are monitoring USDCAD for a selling opportunity around 1.38500 zone, USDCAD is trading in a downtrend and currently is in a correction phase in which it is approaching the trend at 1.38500 support and resistance area.
Trade safe, Joe.

Market Analysis: USD/CAD Breaks HigherMarket Analysis: USD/CAD Breaks Higher
USD/CAD is rising and might aim for more gains above the 1.3765 resistance.
Important Takeaways for USD/CAD Analysis Today
- USD/CAD is showing positive signs above the 1.3720 support zone.
- There is a key bullish trend line forming with support at 1.3740 on the hourly chart at FXOpen.
USD/CAD Technical Analysis
On the hourly chart of USD/CAD at FXOpen, the pair formed a strong support base above the 1.3540 level. The US Dollar started a fresh increase above the 1.3600 resistance against the Canadian Dollar.
The bulls pushed the pair above the 1.3640 and 1.3700 levels. The pair cleared the 50-hour simple moving average and climbed above 1.3750. A high was formed at 1.3766 and the pair is now consolidating.
Initial support is near the 1.3740 level. There is also a key bullish trend line forming with support at 1.3740. The next major support is near the 1.3710 level or the 23.6% Fib retracement level of the upward move from the 1.3539 swing low to the 1.3766 high.
The main support sits near the 1.3650 zone on the USD/CAD chart. It is near the 50% Fib retracement level.
A downside break below the 1.3650 level could push the pair further lower. The next major support is near the 1.3595 support zone, below which the pair might visit 1.3540.
If there is another increase, the pair might face resistance near the 1.3765 level. A clear upside break above 1.3765 could start another steady increase. The next major resistance is the 1.3800 level. A close above the 1.3800 level might send the pair toward the 1.3880 level. Any more gains could open the doors for a test of the 1.4000 level.
This article represents the opinion of the Companies operating under the FXOpen brand only. It is not to be construed as an offer, solicitation, or recommendation with respect to products and services provided by the Companies operating under the FXOpen brand, nor is it to be considered financial advice.

Market Insights with Gary Thomson: 23 - 27 JuneMarket Insights with Gary Thomson: Canada Inflation, US Core Consumer Metrics, and Earnings Reports
In this video, we’ll explore the key economic events, market trends, and corporate news shaping the financial landscape. Get ready for expert insights into forex, commodities, and stocks to help you navigate the week ahead. Let’s dive in!
In this episode, we discuss:
— Inflation Rate in Canada
— US Durable Goods Orders
— US PCE Price Index, Personal Income & Personal Spending
— Corporate Earnings Statements
Don’t miss out—gain insights to stay ahead in your trading journey.
This video represents the opinion of the Companies operating under the FXOpen brand only. It is not to be construed as an offer, solicitation, or recommendation with respect to products and services provided by the Companies operating under the FXOpen brand, nor is it to be considered financial advice.

USD/CAD Tests Key Resistance Amid Mixed Global Economic SignalsTechnical Analysis
On the 4-hour chart, USD/CAD has broken above the 1.3746 resistance level, which corresponds to the top swing of the recent rally from 1.3687.
The breakout above this level is a bullish signal, reinforced by a positive RSI reading above 70, indicating strong buying momentum.
The MACD histogram is in positive territory, and the stochastic oscillator remains near overbought levels, showing sustained bullish energy.
Price action seems to retest the broken upper boundary of a descending channel drawn from the last high near 1.3723-1.3747.
This resistance zone near 1.3770-1.3783 also coincides with the 141.4% and 161.8% Fibonacci extensions, marking key targets for continuation should bulls maintain control.
Alternative Scenario
If the price fails to hold above the 1.3746 breakout level and retreats back below 1.3723 (61.8% Fibonacci retracement), we could see a pullback towards the lower support zone near 1.3687. A breakdown below this support may extend the correction into the mid-1.3600s, retesting the lower channel boundary.

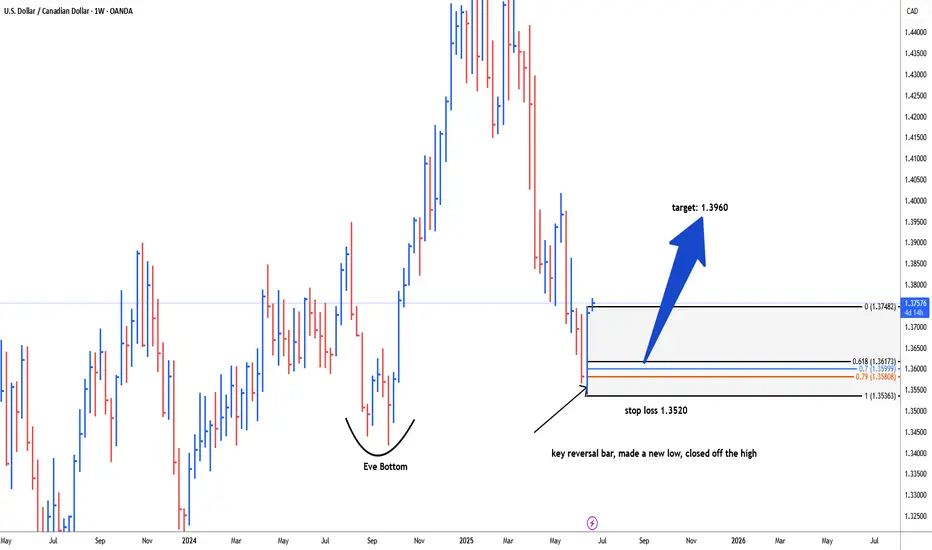
USDCAD possible bullish reversal for 1.3960#usdcad weekly key reversal bar, made a new low, closed off the high, early indication for reversal. It's better to wait for correction 61.8 fib level, 79.0 fib level and 79.0 fib level to reduce/secure drawdwon i.e. 1.3622-1.3585 is the area of interest for long trade. stop loss below key reversal bar i.e. 1.3520. target level: 1.3960