usdcad sell tradeThe Relative Strength Index (RSI) is showing a downward trend, indicating weakening momentum. Additionally, the Moving Average Convergence Divergence (MACD) is showing a bearish crossover, further supporting the potential for a downward move
USDCAD trade ideas
USDCAD Will Go Down From Resistance! Short!
Please, check our technical outlook for USDCAD.
Time Frame: 1D
Current Trend: Bearish
Sentiment: Overbought (based on 7-period RSI)
Forecast: Bearish
The market is trading around a solid horizontal structure 1.375.
The above observations make me that the market will inevitably achieve 1.362 level.
P.S
We determine oversold/overbought condition with RSI indicator.
When it drops below 30 - the market is considered to be oversold.
When it bounces above 70 - the market is considered to be overbought.
Disclosure: I am part of Trade Nation's Influencer program and receive a monthly fee for using their TradingView charts in my analysis.
Like and subscribe and comment my ideas if you enjoy them!

USDCAD: a long positionHello guys.
Divergence:
A bullish RSI divergence is noted, price made lower lows while RSI formed higher lows, signaling a potential bullish reversal.
Price Action:
Price has bounced strongly from around the 1.3570–1.3580 zone and is now approaching a descending trendline resistance.
Trade Setup:
Entry: 1.3718
Stop Loss: Below the breakout candle, near 1.3686
Take Profit: Around 1.3782
Risk-to-Reward: 1:3

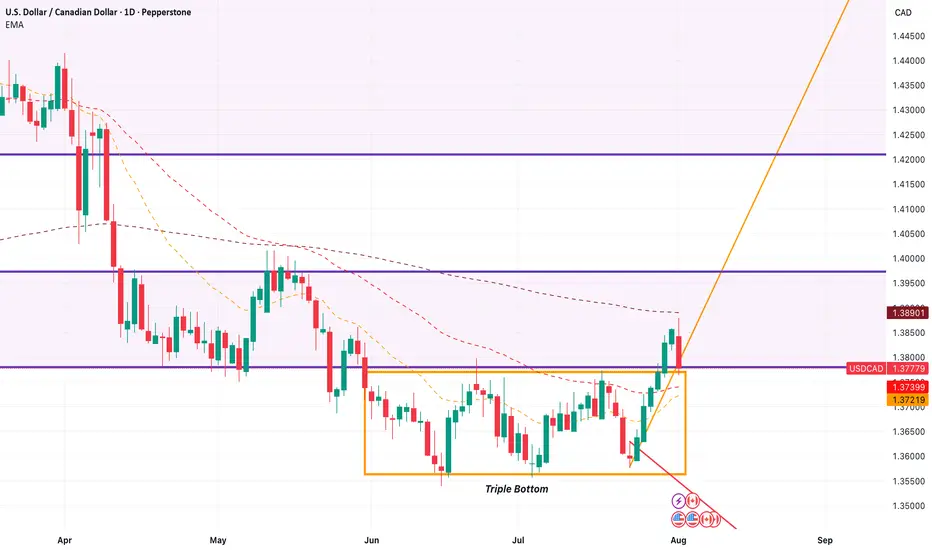
Triple Bottom seen on USDCADUSDCAD has a triple bottom which we can see.
Price already has started to break out and is heading upwards.
We know that, at the time of writing, USD has strength while CAD is weak. Which also supports the triple bottom.
Price broke through 1.37700
USDCAD: Bearish Structure with Rejection from Key Supply ArraysGreetings Traders,
In today’s analysis of USDCAD, recent price action confirms the presence of bearish institutional order flow. As a result, we aim to align ourselves with this directional bias by identifying strategic selling opportunities.
Key Observations:
Weekly Timeframe Insight:
Last week's candle rebalanced a weekly Fair Value Gap (FVG), indicating internal range price action. As a rule of thumb, once internal imbalances are addressed, the draw typically shifts toward external liquidity—located at the swing low, where the weekly liquidity pool resides.
H4 Resistance Alignment:
On the H4 timeframe, price shifted bearish and has since retraced into a bearish FVG that aligns precisely with a reclaimed bearish order block. The alignment of these bearish arrays strengthens the case for continued downside, making this zone a high-probability resistance area.
Trading Plan:
Entry Strategy:
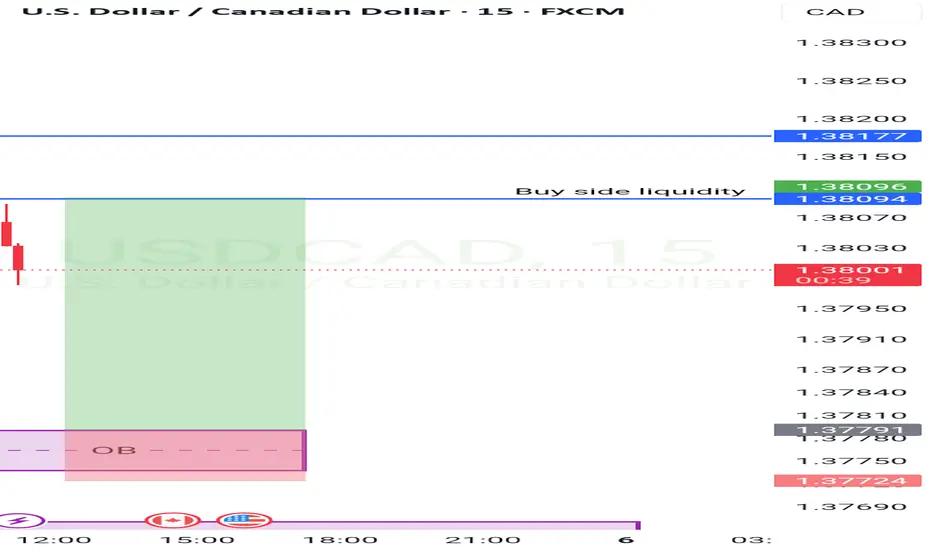
Look for bearish confirmation setups on the M15 or lower timeframes within the H4 supply arrays (FVG + OB confluence).
Target Objective:
The primary draw on liquidity lies within the discount range—targeting the liquidity pool below the most recent swing low.
For a detailed market walkthrough and in-depth execution zones, be sure to watch this week’s Forex Market Breakdown:
Stay patient, wait for your confirmations, and trade in alignment with the flow of smart money.
Kind regards,
The Architect 🏛️📉

USDCAD Update: Don’t Sleep on This Uptrend’s First LegYo traders, Skeptic from Skeptic Lab here! 🚀 USDCAD’s serving a hot long trigger for pattern traders chasing the first leg of a big uptrend! We’ve got an ascending triangle breakout on the daily, with bullish candles stacking up, hinting at a return to the weekly bullish trend. Too early to confirm, but the momentum’s fire.
📈 Today’s FOMC meeting’s got everyone buzzing—will Powell cut, hold, or drop resignation hints? Check the full setup in the video, but with crazy news like Federal Funds Rate
, s tick to high-probability trades, keep risk low, and no FOMO or revenge trading! Drop your thoughts, boost if it vibes <3

Buy USDCADLooking to buy it if it reaches my zone, though the market does whatever it wants, we ride along
USDCAD SELLUSD/CAD rallies further, approaches 1.3900 on higher levies to Canada
The US Dollar keeps marching higher, as the Canadian Dollar struggles after Trump decided to increase tariffs to Canada to 35% from the previous 25%, escalating the trading tension with one of its main trading partners. The US President justified his decision on Canada’s alleged reluctance to cooperate on curbing the traffic of fentanyl and other drugs across the US border
The year will be politically marked by Trump’s return to the White House. A Republican government is seen as positive for financial markets, but Trump’s pledge to cut taxes and impose tariffs on foreign goods and services may introduce uncertainty to both the political and economic landscape.
Canada’s political crisis peaked in late 2024 with a no-confidence vote against Prime Minister Justin Trudeau, leading to snap elections and a weakened Liberal minority government. Policy uncertainty and economic challenges dominate 2025’s outlook, raising concerns over market stability and investor confidence.
The BoC is set to continue easing interest rates through 2025, at least at a faster pace than the Fed is expected to, which could apply pressure on CAD’s already-rising rate differential.
SUPPORT 1.38444
SUPPORT 1.38039
SUPPORT 1.37621
RESISTANCE 1.38889
RESISTANCE 1.39049

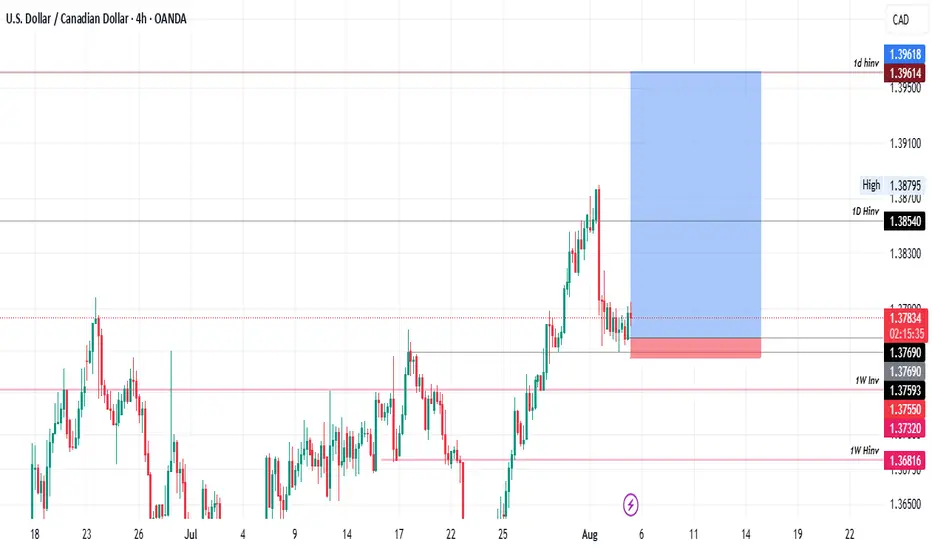
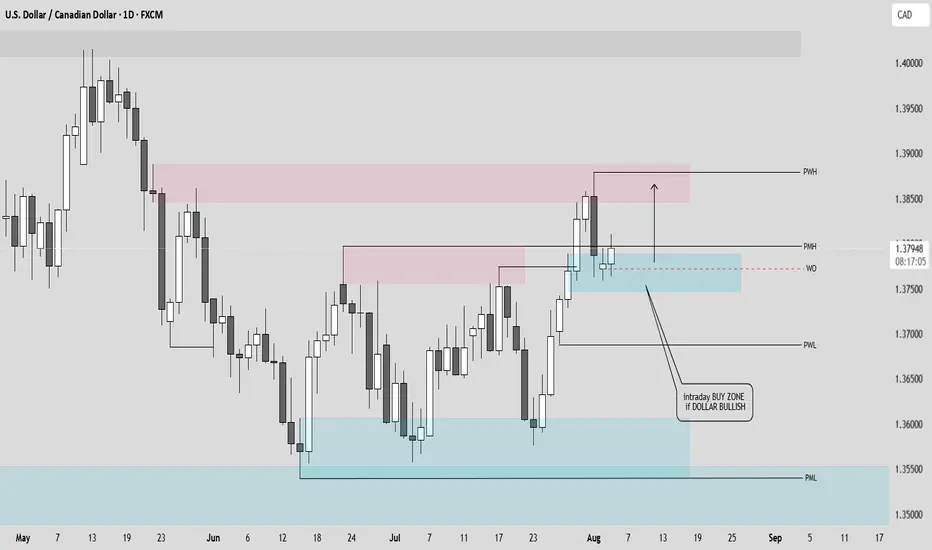
USDCAD Long?- In the monthly (higher timeframes), USDCAD is bullish.
- In the weekly timeframe, price reaction seems to trace a clear uptrend
- In the daily timeframe, it is also in a clear uptrend but at retracement phase due to a hidden 1 day invalidation.
- With our current 4hr timeframe forming what looks like an accumulation in an important psychological level we are tracing for low risk (14 Pips) high reward of up to 1:13 on the trade.
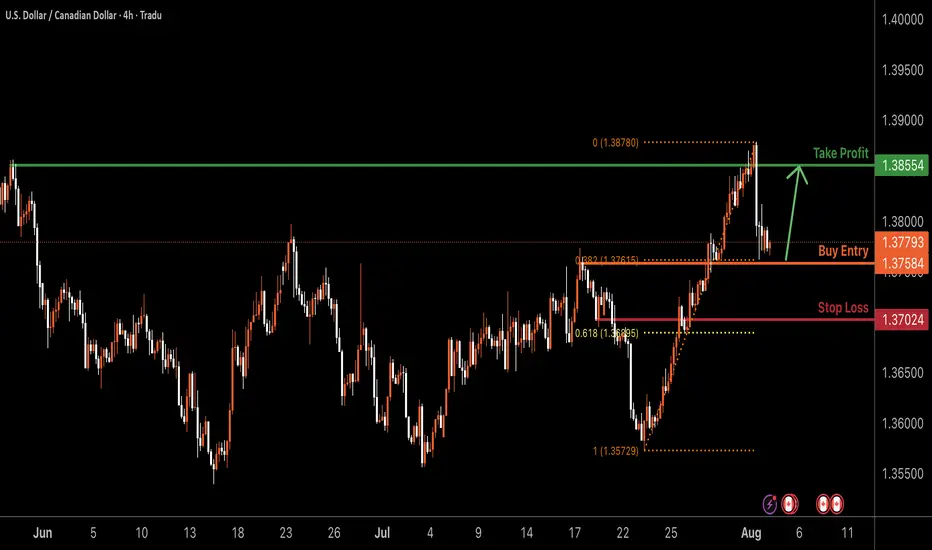
USDCAD H4 | Bullish bounce off pullback supportUSD/CAD is falling toward the buy entry, identified as a pullback support that aligns with the 38.2% Fibonacci retracement and could potentially bounce to the upside.
Buy entry is at 1.3758, which is a pullback support that lines up with the 38.2% Fibonacci retracement.
Stop loss is at 1.37024, which is a pullback support that is slightly above the 61.8% Fibonacci retracement.
Take profit is at 1.3855, which is a pullback resistance.
High Risk Investment Warning
Trading Forex/CFDs on margin carries a high level of risk and may not be suitable for all investors. Leverage can work against you.
Stratos Markets Limited (tradu.com ):
CFDs are complex instruments and come with a high risk of losing money rapidly due to leverage. 65% of retail investor accounts lose money when trading CFDs with this provider. You should consider whether you understand how CFDs work and whether you can afford to take the high risk of losing your money.
Stratos Europe Ltd (tradu.com ):
CFDs are complex instruments and come with a high risk of losing money rapidly due to leverage. 66% of retail investor accounts lose money when trading CFDs with this provider. You should consider whether you understand how CFDs work and whether you can afford to take the high risk of losing your money.
Stratos Global LLC (tradu.com ):
Losses can exceed deposits.
Please be advised that the information presented on TradingView is provided to Tradu (‘Company’, ‘we’) by a third-party provider (‘TFA Global Pte Ltd’). Please be reminded that you are solely responsible for the trading decisions on your account. There is a very high degree of risk involved in trading. Any information and/or content is intended entirely for research, educational and informational purposes only and does not constitute investment or consultation advice or investment strategy. The information is not tailored to the investment needs of any specific person and therefore does not involve a consideration of any of the investment objectives, financial situation or needs of any viewer that may receive it. Kindly also note that past performance is not a reliable indicator of future results. Actual results may differ materially from those anticipated in forward-looking or past performance statements. We assume no liability as to the accuracy or completeness of any of the information and/or content provided herein and the Company cannot be held responsible for any omission, mistake nor for any loss or damage including without limitation to any loss of profit which may arise from reliance on any information supplied by TFA Global Pte Ltd.
The speaker(s) is neither an employee, agent nor representative of Tradu and is therefore acting independently. The opinions given are their own, constitute general market commentary, and do not constitute the opinion or advice of Tradu or any form of personal or investment advice. Tradu neither endorses nor guarantees offerings of third-party speakers, nor is Tradu responsible for the content, veracity or opinions of third-party speakers, presenters or participants.
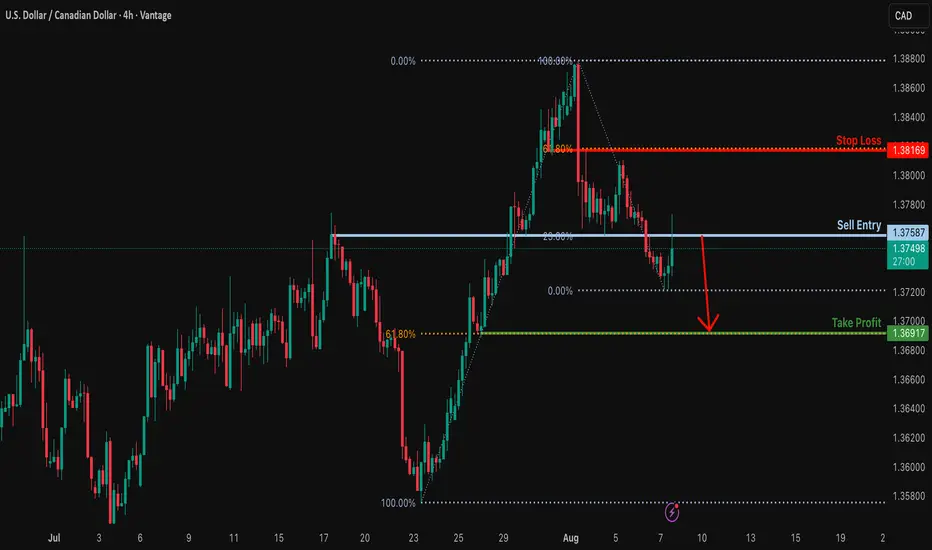
Potential bearish drop?The Loonie (USD/CAD) is reacting off the resistance levl which is an overlap resistance that lines up with the 23.6% Fibonacci retracement and could drop from this level to our take profit.
Entry: 1.3758
Why we like it:
There is an overlap resistance level that lines up with the 23.6% Fibonacci retracement.
Stop loss: 1.3816
Why we like it:
There is a pullback resistance level that aligns with the 61.8% Fibonacci retracement.
Take profit: 1.3691
Why we like it:
There is a pullback support level that aligns with the 61.8% Fibonacci retracement.
Enjoying your TradingView experience? Review us!
Please be advised that the information presented on TradingView is provided to Vantage (‘Vantage Global Limited’, ‘we’) by a third-party provider (‘Everest Fortune Group’). Please be reminded that you are solely responsible for the trading decisions on your account. There is a very high degree of risk involved in trading. Any information and/or content is intended entirely for research, educational and informational purposes only and does not constitute investment or consultation advice or investment strategy. The information is not tailored to the investment needs of any specific person and therefore does not involve a consideration of any of the investment objectives, financial situation or needs of any viewer that may receive it. Kindly also note that past performance is not a reliable indicator of future results. Actual results may differ materially from those anticipated in forward-looking or past performance statements. We assume no liability as to the accuracy or completeness of any of the information and/or content provided herein and the Company cannot be held responsible for any omission, mistake nor for any loss or damage including without limitation to any loss of profit which may arise from reliance on any information supplied by Everest Fortune Group.
USDCAD: Bulls Will Push
Looking at the chart of USDCAD right now we are seeing some interesting price action on the lower timeframes. Thus a local move up seems to be quite likely.
Disclosure: I am part of Trade Nation's Influencer program and receive a monthly fee for using their TradingView charts in my analysis.
❤️ Please, support our work with like & comment! ❤️

BUY OPPORTUNITY AFTER A TRIPLE BOTTOM This week I'm expecting for OANDA:USDCAD USDCAD to close bullish or at least to show lower time frame intraday momentum to the upside not only technically but also fundamentally.
#USDCAD Possible sale or possible purchase for this pair, whatever the market does first. When it reaches any of our marked zones. We will use an OBB or OBS. Using good R.R. management.

Usd/Cadafter three bottoms its time to go up , return to my last chart on CAD u can see what i have said, buy.

USD/CAD 1H Setup – Bearish Reversal Incoming? We’re closely watching the USD/CAD pair on the 1-hour timeframe, and the chart is flashing multiple high-probability reversal signals.
🔹 The trend has been bullish, but momentum is weakening.
🔹 A clear bearish divergence has formed on the oscillator.
🔹 A rising wedge — one of the most reliable reversal patterns — is fully developed and ready to break.
🔹 All signs point toward an imminent bearish shift, and we're preparing to catch the move early with a Sell Stop below the key Higher Low (HL).
📌 Trade Setup at a Glance:
Pair: USD/CAD
Timeframe: 1H
Trend: Bullish (for now)
Divergence: Bearish
Pattern: Rising Wedge
Bias: Bearish
Strategy: Sell Stop at HL Breakout
🟡 Entry: 1.38379 (Sell Stop)
🔴 Stop Loss: 1.38847
🟢 Take Profit 1: 1.37911 (R:R 1:1)
🟢 Take Profit 2: 1.37443 (R:R 1:2)
📊 Position Sizing & Risk Management
🔹 Lot Size: 0.25
🔹 Risk Per Trade: $200
🔹 Total Reward Target: Up to $300
🔹 Executing two trades – one targeting TP1, the second targeting TP2.
📈 Why This Setup Matters:
✅ Bearish divergence shows clear loss of bullish strength
✅ Rising wedge pattern aligns perfectly with reversal expectations
✅ Well-structured entry with favorable risk-to-reward
✅ Using a split-target strategy to lock in profits smartly
📣 Let’s Discuss!
💬 Drop your thoughts and analysis in the comments — how are you trading USD/CAD?
🔔 Follow me for more high-probability trade setups, chart breakdowns, and real-time analysis. Let’s trade smart and grow together! 🚀
#USDCAD #ForexSetup #RisingWedge #BearishDivergence #PriceActionTrading #SmartMoney #TrendReversal #FXSignals #SellSetup #TradingStrategy #ChartPatterns #BreakoutStrategy #TradeSmart #1HourChart #RiskReward #ForexTrade #TechnicalSetup #TradeIdeas #TradingCommunity #ForexEducation #TradersOfTradingView #SmartEntry #SwingTrading #TradingMindset #TradingViewSetup #ForexAnalysis

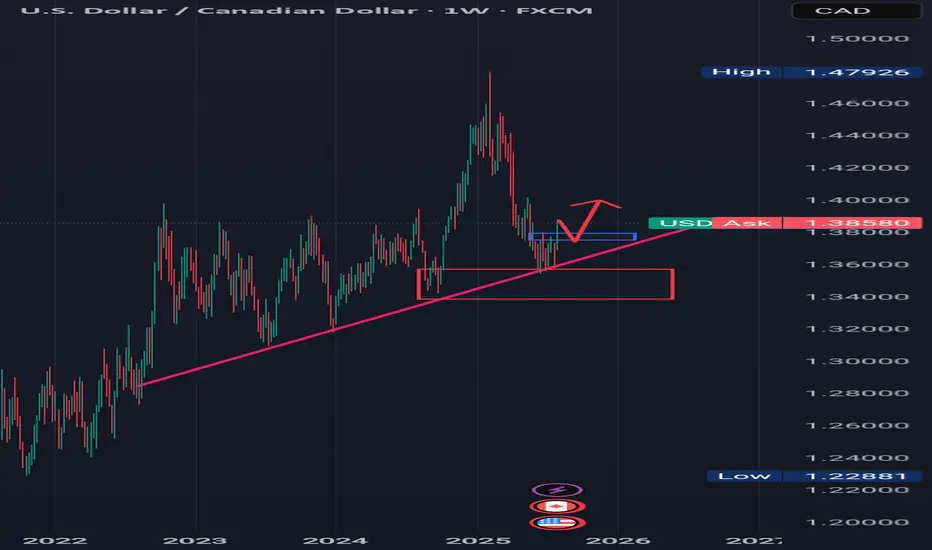
TREND REVERSAL CONFIRMATION Looking at the weekly timeframe for USDCAD, we can see that price action has respected a rising trendline and also reacted to a weekly bullish order block.
The Sell momentum for USDCAD has come to an end, so now we saw price action accumulating around the rising trend line and bullish order block.
Now there's a minor resistance which is indicated with a small blue rectangle in which price action has broken to the upside, I'm expecting price to complete an impulse correction leg or retrace to the blue rectangle or minor resistance and then from there continue to the upside.
........,...,.............................................
Please share your thoughts on this analysis, do you think the downward trend is over.
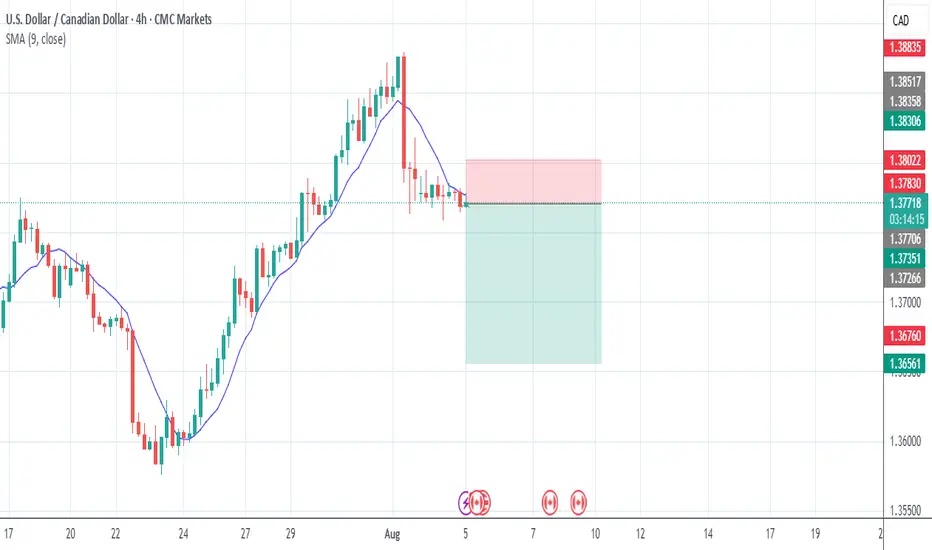
USDCAD BUY 1.3610On the 4-hour chart, USDCAD is experiencing a short-term oscillation and decline, with a bearish trend prevailing. Currently, attention can be paid to the area around 1.3610, which is a potential buy point for a bullish bat pattern and is within the previous demand zone.

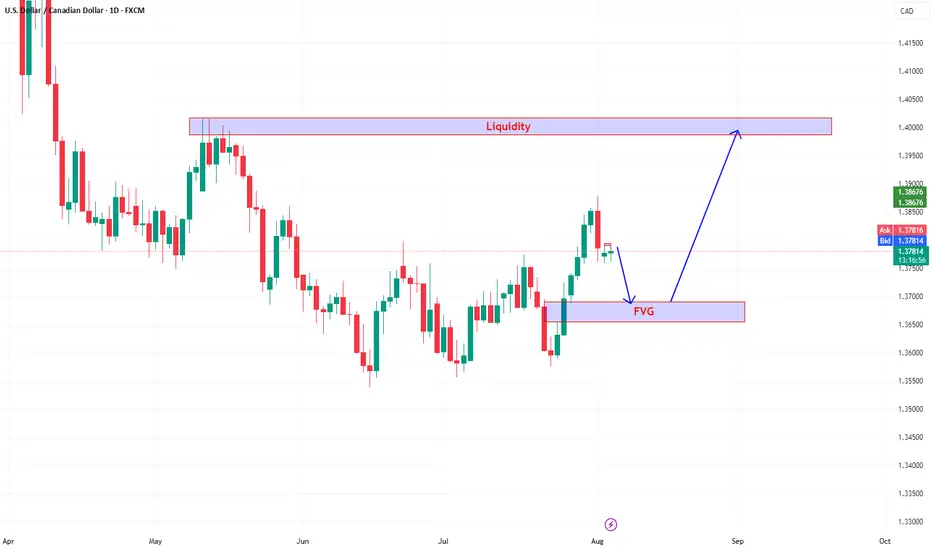
USDCAD is forming a bullish structure.We can a clear bullish structure forming after a series of higher highs and higher lows, indicating bullish momentum building. Recently, price rejected from a key swing high and appears to be pulling back. This pullback is targeting a Fair Value Gap (FVG) marked in the blue zone then bounce from the FVG zone back toward the overhead Liquidity Zone.
In the big picture ,it is seen as the end of Wave 4 This is likely to be the strart of downtrened in wave 1 of wave 5.

USDCAD Wave Analysis – 31 July 2025
- USDCAD broke resistance zone
- Likely rise to resistance level 1.3900
USDCAD currency pair recently broke the resistance zone located between the resistance level 1.3785 (upper border of the sideways price range from the start of June) and the 50% Fibonacci correction of the downward impulse from May.
The breakout of this resistance zone accelerated the active impulse wave 3, which belongs to medium-term impulse wave (B) from the start of July.
USDCAD currency pair can be expected to rise further to the next resistance level 1.3900 (target price for the completion of the active impulse wave 3).

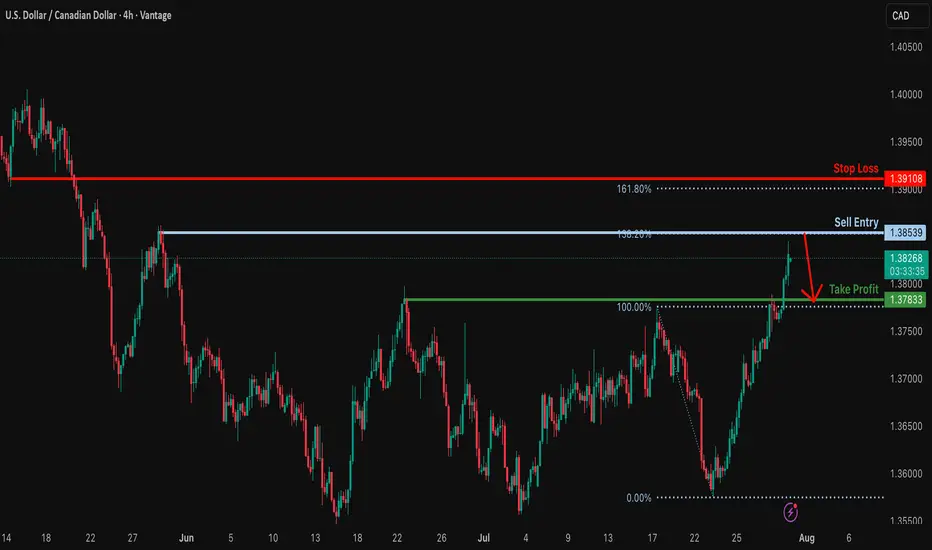
Could the Loonie reverse from here?The price is rising towards the resistance level, which is a swing high resistance that aligns with the 138.2% Fibonacci extension and could potentially reverse from this level to our take-profit.
Entry: 1.3853
Why we like it:
There is a swing high resistance that lines up with the 138.2% Fibonacci extension.
Stop loss: 1.3910
Why we like it:
There is a pullback resistance that is slightly above the 161.8% Fibonacci extension.
Take profit: 1.3783
Why we like it:
There is a pullback support.
Enjoying your TradingView experience? Review us!
Please be advised that the information presented on TradingView is provided to Vantage (‘Vantage Global Limited’, ‘we’) by a third-party provider (‘Everest Fortune Group’). Please be reminded that you are solely responsible for the trading decisions on your account. There is a very high degree of risk involved in trading. Any information and/or content is intended entirely for research, educational and informational purposes only and does not constitute investment or consultation advice or investment strategy. The information is not tailored to the investment needs of any specific person and therefore does not involve a consideration of any of the investment objectives, financial situation or needs of any viewer that may receive it. Kindly also note that past performance is not a reliable indicator of future results. Actual results may differ materially from those anticipated in forward-looking or past performance statements. We assume no liability as to the accuracy or completeness of any of the information and/or content provided herein and the Company cannot be held responsible for any omission, mistake nor for any loss or damage including without limitation to any loss of profit which may arise from reliance on any information supplied by Everest Fortune Group.
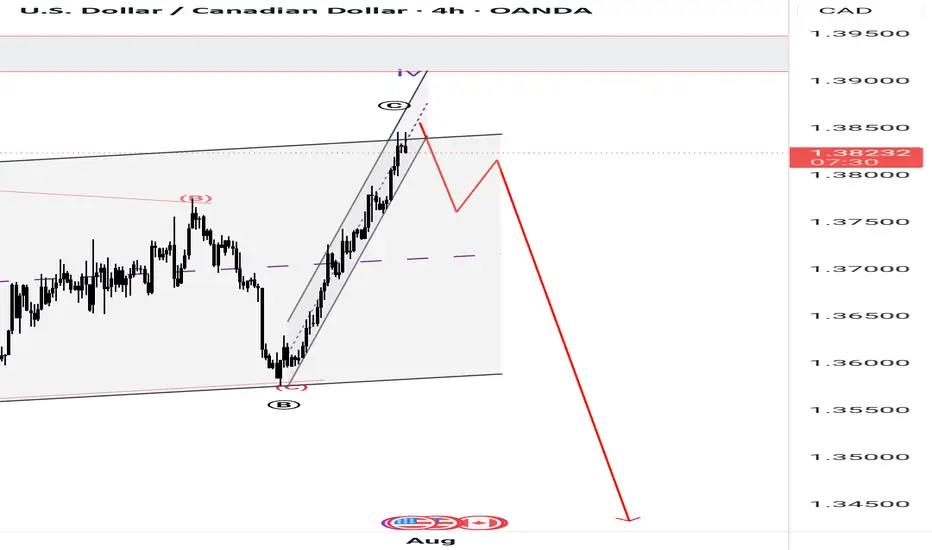
Potential BEARSAfter a prolonged and a complex correction, it looks out to be a FLAT CORRECTION with wave B producing a flat correction as well in a lower degree hence making it all complex. But at the moment we have a perfect channel AB=CD correction which prompts a continuation to the south. Fingers crossed 🤞 as the market rejects a resistance of the channel.