USD/CAD) Bearish trand analysis Read The captionSMC trading point update
Technical analysis of USD/CAD on the 3-hour timeframe reflects a bearish market outlook. Here’s a breakdown of the idea:
---
Trend Overview:
The pair is in a clear downtrend, confirmed by:
Lower highs and lower lows
Price trading below the 200 EMA
A bearish flag pattern in play
---
Key Zones & Levels:
1. Resistance Zones (Yellow boxes):
Upper zone (~1.3835 area): Previously tested and rejected (marked by the red arrow).
Mid-zone (~1.3745 area): Labeled as a resistance level, previously support turned resistance.
2. Support Zone:
The price is heading toward a projected target point at ~1.35584, which aligns with previous support.
---
Bearish Confirmation:
The price attempted a retracement but failed to break above the resistance level.
The structure shows a bearish continuation pattern, suggesting a move downward is likely.
---
Indicators:
RSI (Relative Strength Index):
Currently near 37, not oversold yet, but suggests bearish momentum is still strong.
Also shows slight bearish divergence (lower highs on RSI while price was consolidating).
---
Projection/Trade Idea:
Scenario: Break and retest of the current level (~1.3679), with a continuation to the target at 1.35584.
Risk Areas: Any break above 1.3745 could invalidate the setup.
Confirmation: A clean bearish candle below the minor support could confirm entry for short sellers.
Mr SMC Trading point
---
Summary:
This is a supply-and-demand + structure-based bearish setup. The market is showing weakness below resistance, and the next logical target is 1.35584, barring any macroeconomic reversal (e.g., USD or CAD news).
Please support boost 🚀 this analysis)
USDCAD trade ideas

USDCAD Bearish Bias: Beware Liquidity Traps & Reversal Risks.I'm currently keeping a close eye on USDCAD, which has been in a strong bearish trend. 📉
In this video, I explain how the market is unfolding across both the higher and lower timeframes, and why it’s critical to watch them in conjunction. On the lower timeframes, we often see a clean sequence of lower highs and lower lows, as the algos set up a seemingly a smooth trend. But traders should be cautious ⚠️
Why? Because on the higher timeframes, the market can easily pull back, triggering a liquidity hunt. This is often when the algorithm targets stop orders above recent highs, before resuming the trend 🧠💥
While my bias remains bearish, I'm also aware of the risk that the market could shift gears unexpectedly to run stops and shake out weak hands. This concept is fully broken down in the video — with examples of how to spot these traps and prepare accordingly 🎯

USDCAD Buy- Go for buy only when entry setup given
- Refine entry with smaller SL for better RR, if you know how
- keep looking for buy even if price goes one more down
A Message To Traders:
I’ll be sharing high-quality trade setups for a period time. No bullshit, no fluff, no complicated nonsense — just real, actionable forecast the algorithm is executing. If you’re struggling with trading and desperate for better results, follow my posts closely.
Check out my previously posted setups and forecasts — you’ll be amazed by the high accuracy of the results.
"I Found the Code. I Trust the Algo. Believe Me, That’s It."

USDCAD LONG FORECAST Q2 W25 D17 Y25USDCAD LONG FORECAST Q2 W25 D17 Y25
Professional Risk Managers👋
Welcome back to another FRGNT chart update📈
Diving into some Forex setups using predominantly higher time frame order blocks alongside confirmation breaks of structure.
💡Here are some trade confluences📝
✅1H order block
✅HTF 50 EMA
✅Intraday bullish breaks of structure to be identified
✅15’ order block identified
🔑 Remember, to participate in trading comes always with a degree of risk, therefore as professional risk managers it remains vital that we stick to our risk management plan as well as our trading strategies.
📈The rest, we leave to the balance of probabilities.
💡Fail to plan. Plan to fail.
🏆It has always been that simple.
❤️Good luck with your trading journey, I shall see you at the very top.
🎯Trade consistent, FRGNT X

Could the Loonie reverse from here?The price is reacting off the support level which lines up with the 100% and the 78.6% Fibonacci projection and could rise from this levl to our take profit.
Entry: 1.3544
Why we like it:
There is a support level at the 100% and the 78.6% Fibonacci projection.
Stop loss: 1.3516
Why we like it:
There is a support level at the 100% Fibonacci projection.
Take profit: 1.3595
Why we like it:
There is an overlap resistance level that aligns with the 50% FIbonacci retracement.
Enjoying your TradingView experience? Review us!
Please be advised that the information presented on TradingView is provided to Vantage (‘Vantage Global Limited’, ‘we’) by a third-party provider (‘Everest Fortune Group’). Please be reminded that you are solely responsible for the trading decisions on your account. There is a very high degree of risk involved in trading. Any information and/or content is intended entirely for research, educational and informational purposes only and does not constitute investment or consultation advice or investment strategy. The information is not tailored to the investment needs of any specific person and therefore does not involve a consideration of any of the investment objectives, financial situation or needs of any viewer that may receive it. Kindly also note that past performance is not a reliable indicator of future results. Actual results may differ materially from those anticipated in forward-looking or past performance statements. We assume no liability as to the accuracy or completeness of any of the information and/or content provided herein and the Company cannot be held responsible for any omission, mistake nor for any loss or damage including without limitation to any loss of profit which may arise from reliance on any information supplied by Everest Fortune Group.

USD/CAD - Fair Value GAP On USD/CAD , it's nice to see a strong sell-off from the price of 1.36130. It's also encouraging to observe a strong volume area where a lot of contracts are accumulated.
I believe that sellers from this area will defend their short positions. When the price returns to this area, strong sellers will push the market down again.
Fair Value GAP (FVG) and Volume cluster are the main reasons for my decision to go short on this trade.
Happy trading,
Dale

USD/CAD Plunges Towards Initial SupportUSD/CAD broke below key support last week with price attempting to mark a third consecutive weekly loss. A break of multi-year uptrend threatens further losses here with confluent support now within striking distance at 1.3504/23- a region defined by the 1.618% extension of the February decline and the 78.6% retracement of the late-2023 advance. Note that channel support converges on this threshold over the next few weeks- risk for possible exhaustion / price inflection into this zone.
Resistance now back at 1.3720/95 with bearish invalidation steady at 1.3958/77. A break below this pivot zone exposes the 2024 LWC at 1.3360 and the 2023 LWC at 1.3218.
-MB

usd cad for buying Hi usd cad good zone for buying now
good zone trend on small frame
volume for buying now

Short trade 🔻 USDCAD – Sell-side Trade
Date: Monday, 16th June 2025
Session: London Session AM
Time: 5:00 AM
Entry Timeframe: 1Hr TF
Trade Parameters
Entry: 1.35680
Take Profit: 1.34735 (+0.70%)
Stop Loss: 1.35965 (−0.21%)
Risk-Reward Ratio (RR): 3.32
🧠 Trade Reasoning
USDCAD has shown sustained bearish momentum on both 1Hr and 4Hr timeframes, with a clear lower high forming beneath the 1.35800 area. This trade was initiated on confirmation of a bearish rejection from a supply zone during the early London session volatility.

USDCAD 15 MINUTEYour chart on USD/CAD (15-minute timeframe) clearly shows a bearish breakdown from the ascending trendline, and here’s a quick analysis based on what you’ve marked:
---
📉 Technical Breakdown
🔻 Trendline Broken: Price has broken below the ascending trendline, indicating loss of bullish momentum.
🧱 Register Support (turned resistance): Price rejected after testing this area – confirms a bearish flip.
🧭 Support Zone (gray box): Price is currently testing this level. If it breaks below, continuation to TP is likely.
🎯 Target TP: Marked around 1.3625–1.3630, showing good confluence with prior swing lows.
---
✅ Bearish Bias Confirmation
This looks like a textbook setup:
Break of trendline ✅
Retest of broken support (now resistance) ✅

USDCAD may hit bottom amid DXY declineThe dollar is weakening. Against this background, the Canadian dollar is strengthening, which puts pressure on the price of the currency pair.
The key support is 1.3566. Breakdown of the level will strengthen the sell-off
The price is descending by “steps”. Consolidation - distribution, consolidation - distribution.
From the current range of 1.365 - 1.3566 I expect the same thing: downward momentum.
Scenario: consolidation and price sticking to 1.3566, decrease in volatility and squeeze to the urvon may lead to a breakdown and a fall.

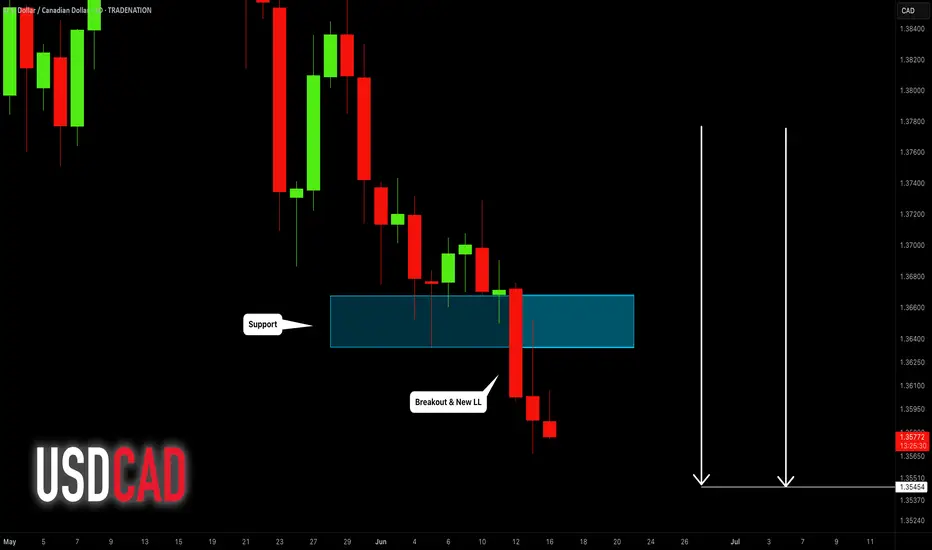
USDCAD Under Pressure: Chart Signals & Macro Forces Point South!The USDCAD pair is under clear pressure, as illustrated in this chart 📊. The visual structure highlights a persistent bearish trend, with price action consistently forming lower highs and lower lows. The chart is reinforcing the idea that sellers are dominating the market. Notably, the drawn arrow in the chart points toward previous higher timeframe lows, suggesting that these areas could be the next logical targets for price action if the current trend persists.
On the fundamental side, the US dollar has been weakened by dovish signals from the Federal Reserve and softer economic data, fueling expectations of potential rate cuts later this year 🏦. In contrast, the Canadian dollar has been buoyed by strong commodity prices—especially oil—and a relatively hawkish Bank of Canada. The bearish structure seen in the chart aligns with these macro drivers, as the CAD continues to benefit from both domestic strength and global demand for commodities.
Geopolitically, ongoing global trade tensions and shifting risk sentiment have further supported the Canadian dollar, as investors seek stability in commodity-backed currencies 🌍. The combination of these factors, as reflected in the chart, suggests that USDCAD remains vulnerable, and a move down to retest previous higher timeframe lows is a real possibility unless there’s a significant shift in the underlying fundamentals.
Traders should keep an eye on the key support zones highlighted in the chart, as these could provide clues for potential exhaustion or reversal in the current trend 🔎.
Disclaimer: This analysis is for informational purposes only and does not constitute financial advice. Please conduct your own research or consult a professional before making any trading decisions.

USD/CAD - Potential TargetsDear Friends in Trading,
How I see it,
Key Confluence - NOW RESISTANCE @ 1.36140
Potential "SHORT" Target:
1] Monitor psychological level @ 1.3500 for a possible bounce
2] 1.34400
Alternatively - A strong break above1.36500
Potential "LONG" Target -
1] 1.37320
I sincerely hope my point of view offers a valued insight.
Thank you for taking the time to study my analysis.

USDCAD: Bearish Trend Continues 🇺🇸🇨🇦
Amid the geopolitical tensions and a bullish rally on Crude Oil,
USDCAD is going to drop more.
The closest support that I see is 1.3545.
It will be the next goal for the sellers.
❤️Please, support my work with like, thank you!❤️
I am part of Trade Nation's Influencer program and receive a monthly fee for using their TradingView charts in my analysis.
USDCAD has formed a bullish bat patternOn the weekly chart, USDCAD formed a bullish bat pattern. The current market is in the previous demand area. You can consider buying around 1.3580, and the upside target is around 1.3943.

Bearish continuation for the Loonie?The price has rejected off the pivot and could drop to the 1st support which acts as a pullback support.
Pivot: 1.3725
1st Support: 1.3430
1st Resistance: 1.3837
Risk Warning:
Trading Forex and CFDs carries a high level of risk to your capital and you should only trade with money you can afford to lose. Trading Forex and CFDs may not be suitable for all investors, so please ensure that you fully understand the risks involved and seek independent advice if necessary.
Disclaimer:
The above opinions given constitute general market commentary, and do not constitute the opinion or advice of IC Markets or any form of personal or investment advice.
Any opinions, news, research, analyses, prices, other information, or links to third-party sites contained on this website are provided on an "as-is" basis, are intended only to be informative, is not an advice nor a recommendation, nor research, or a record of our trading prices, or an offer of, or solicitation for a transaction in any financial instrument and thus should not be treated as such. The information provided does not involve any specific investment objectives, financial situation and needs of any specific person who may receive it. Please be aware, that past performance is not a reliable indicator of future performance and/or results. Past Performance or Forward-looking scenarios based upon the reasonable beliefs of the third-party provider are not a guarantee of future performance. Actual results may differ materially from those anticipated in forward-looking or past performance statements. IC Markets makes no representation or warranty and assumes no liability as to the accuracy or completeness of the information provided, nor any loss arising from any investment based on a recommendation, forecast or any information supplied by any third-party.

USD/CAD H1 | Bearish downtrend to extend deeper?USD/CAD is rising towards a pullback resistance and could potentially reverse off this level to drop lower.
Sell entry is at 1.3615 which is a pullback resistance.
Stop loss is at 1.3660 which is a level that sits above the 50% Fibonacci retracement and an overlap resistance.
Take profit is at 1.3565 which is a swing-low support.
High Risk Investment Warning
Trading Forex/CFDs on margin carries a high level of risk and may not be suitable for all investors. Leverage can work against you.
Stratos Markets Limited (tradu.com ):
CFDs are complex instruments and come with a high risk of losing money rapidly due to leverage. 63% of retail investor accounts lose money when trading CFDs with this provider. You should consider whether you understand how CFDs work and whether you can afford to take the high risk of losing your money.
Stratos Europe Ltd (tradu.com ):
CFDs are complex instruments and come with a high risk of losing money rapidly due to leverage. 63% of retail investor accounts lose money when trading CFDs with this provider. You should consider whether you understand how CFDs work and whether you can afford to take the high risk of losing your money.
Stratos Global LLC (tradu.com ):
Losses can exceed deposits.
Please be advised that the information presented on TradingView is provided to Tradu (‘Company’, ‘we’) by a third-party provider (‘TFA Global Pte Ltd’). Please be reminded that you are solely responsible for the trading decisions on your account. There is a very high degree of risk involved in trading. Any information and/or content is intended entirely for research, educational and informational purposes only and does not constitute investment or consultation advice or investment strategy. The information is not tailored to the investment needs of any specific person and therefore does not involve a consideration of any of the investment objectives, financial situation or needs of any viewer that may receive it. Kindly also note that past performance is not a reliable indicator of future results. Actual results may differ materially from those anticipated in forward-looking or past performance statements. We assume no liability as to the accuracy or completeness of any of the information and/or content provided herein and the Company cannot be held responsible for any omission, mistake nor for any loss or damage including without limitation to any loss of profit which may arise from reliance on any information supplied by TFA Global Pte Ltd.
The speaker(s) is neither an employee, agent nor representative of Tradu and is therefore acting independently. The opinions given are their own, constitute general market commentary, and do not constitute the opinion or advice of Tradu or any form of personal or investment advice. Tradu neither endorses nor guarantees offerings of third-party speakers, nor is Tradu responsible for the content, veracity or opinions of third-party speakers, presenters or participants.

POSSIBLE BUY OPPORTUNITY ON USDCADUSDCAD has been pushing down for some time and is somewhat over sold. We seem to have found a good demand zone at which to go long!

USD/CAD Testing Channel Support – Watching for Bullish Rebound
USD/CAD is currently trading near the lower boundary of a well-defined descending channel. The price has shown signs of holding near 1.35660 support, which may lead to a short-term rebound.
If momentum builds, the first resistance to watch is 1.36083, followed by 1.36185. However, a confirmed break below 1.35660 would invalidate the bullish scenario and open room for further downside.


Bearish continuation?USD/CAD has rejected off the resistance level which is a pullback resistance and could drop from this level to our take profit.
Entry: 1.3595
Why we like it:
There is a pullback resistance level.
Stop loss: 1.3644
Why we like it:
There is an overlap resistance level that aligns with the 50% Fibonacci retracement.
Take profit: 1.3545
Why we like it:
There is a support level at the 100% and the 78.6% Fibonacci projection.
Enjoying your TradingView experience? Review us!
Please be advised that the information presented on TradingView is provided to Vantage (‘Vantage Global Limited’, ‘we’) by a third-party provider (‘Everest Fortune Group’). Please be reminded that you are solely responsible for the trading decisions on your account. There is a very high degree of risk involved in trading. Any information and/or content is intended entirely for research, educational and informational purposes only and does not constitute investment or consultation advice or investment strategy. The information is not tailored to the investment needs of any specific person and therefore does not involve a consideration of any of the investment objectives, financial situation or needs of any viewer that may receive it. Kindly also note that past performance is not a reliable indicator of future results. Actual results may differ materially from those anticipated in forward-looking or past performance statements. We assume no liability as to the accuracy or completeness of any of the information and/or content provided herein and the Company cannot be held responsible for any omission, mistake nor for any loss or damage including without limitation to any loss of profit which may arise from reliance on any information supplied by Everest Fortune Group.

USDCAD TRADE SETUPWait for retest the entry level then take a trade for Sell otherwise skip this setup

USDCAD - Medium term prediction - 16/06/25Given the daily down-trend and your clear break below the 1.3729 pivot, the path of least resistance is down toward 1.3420 rather than back up to 1.3729:
Trend
USD/CAD has been in a multi-month down-trend from the 1.4800 highs, carving lower highs and lower lows.
Broken support → resistance
That 1.3729 level failed as support in late May and should now act as resistance on any rally.
Momentum
Recent daily closes are rolling over into new lows, with no bullish divergence to suggest a reversal yet.
Slide to 1.3420 ~70% Down-trend continuation into the next demand zone
Rally back to 1.3729 ~30% Requires reclaiming 1.3600–1.3650 and bullish follow-through
