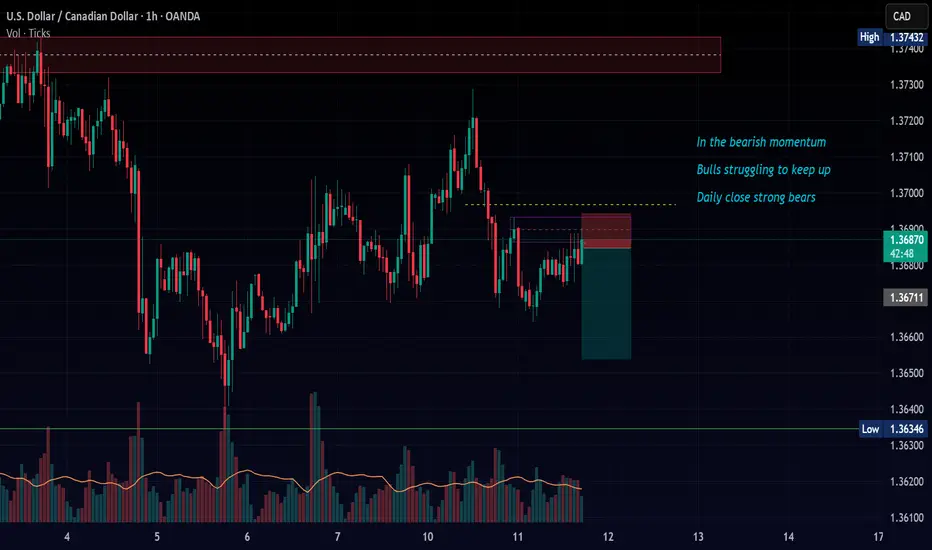
USDCAD – Sell Into Resistance Amid Bearish ContinuationSell Limit
Entry: 1.3700
Target: 1.3600
Stop Loss: 1.3750
Duration: Intraday
Expires: 13/06/2025 06:00
Technical Overview
The broader trend remains bearish, and current price action does not indicate a reversal of the recent downtrend.
A correction toward resistance at 1.3700 offers a low-risk short entry.
A move below 1.3625 would confirm renewed bearish momentum, aligning with the measured move target of 1.3575.
The short-term RSI has turned negative, reinforcing downside pressure.
Traders should remain aware of upcoming U.S. data, with the PPI release at 13:30 UTC potentially triggering short-term volatility.
Key Technical Levels
Resistance: 1.3675 / 1.3700 / 1.3725
Support: 1.3625 / 1.3600 / 1.3575
Disclosure: I am part of Trade Nation's Influencer program and receive a monthly fee for using their TradingView charts in my analysis.
USDCAD trade ideas

USDCAD SHORT FORECAST Q2 W24 D12 Y25USDCAD SHORT FORECAST Q2 W24 D12 Y25
Professional Risk Managers👋
Welcome back to another FRGNT chart update📈
Diving into some Forex setups using predominantly higher time frame order blocks alongside confirmation breaks of structure.
💡Here are some trade confluences📝
✅4H order block rejection
✅HTF 50 EMA
✅Intraday bearish breaks of structure to be identified
✅15’ order block identified
🔑 Remember, to participate in trading comes always with a degree of risk, therefore as professional risk managers it remains vital that we stick to our risk management plan as well as our trading strategies.
📈The rest, we leave to the balance of probabilities.
💡Fail to plan. Plan to fail.
🏆It has always been that simple.
❤️Good luck with your trading journey, I shall see you at the very top.
🎯Trade consistent, FRGNT X

usd/cad TRADE 2 i actully got on on this trade bang on the entry point IM LOOKING TO CONTINUE THE BULLISH AS IT is on the high time frames so lets just see if we canm create a new higher high and higher low

USDCAD 11/06/2025Weekly:
-Weekly resistance.
-Last weekly bearish candle could get filled.
Daily:
-Bearish W pattern.
-IC.
4H:
-Bearish W pattern.

usdcad short in 1H*The content on this analysis is subject to change at any time without notice, and is provided for the sole purpose of assisting traders to make independent investment decisions.

Bearish drop?USD/CAD has bounced off the support level which is a pullback support that lines up with the 138.2% Fibonacci extension and could potentially rise from this level to our take profit.
Entry: 1.645
Why we like it:
There is a pullback support level that lines up with the 138.2% Fibonacci extension.
Stop loss: 1.3624
Why we like it:
There is a support level at the 100% Fibonacci projection.
Take profit: 1.3689
Why we like it:
There is a pullback resistance level that aligns with the 50% Fibonacci retracement.
Enjoying your TradingView experience? Review us!
Please be advised that the information presented on TradingView is provided to Vantage (‘Vantage Global Limited’, ‘we’) by a third-party provider (‘Everest Fortune Group’). Please be reminded that you are solely responsible for the trading decisions on your account. There is a very high degree of risk involved in trading. Any information and/or content is intended entirely for research, educational and informational purposes only and does not constitute investment or consultation advice or investment strategy. The information is not tailored to the investment needs of any specific person and therefore does not involve a consideration of any of the investment objectives, financial situation or needs of any viewer that may receive it. Kindly also note that past performance is not a reliable indicator of future results. Actual results may differ materially from those anticipated in forward-looking or past performance statements. We assume no liability as to the accuracy or completeness of any of the information and/or content provided herein and the Company cannot be held responsible for any omission, mistake nor for any loss or damage including without limitation to any loss of profit which may arise from reliance on any information supplied by Everest Fortune Group.

Usdcad Sellim still believe the market can push down more it is reacting to the Daily zone and is respecting the 1hr supply line(green dots). ive extended the sl since my analysis is based on htf price action and trend

USDCAD Potential DownsidesHey Traders, in today's trading session we are monitoring USDCAD for a selling opportunity around 1.37100 zone, USDCAD is trading in a downtrend and currently is in a correction phase in which it is approaching the trend at 1.37100 support and resistance area.
Trade safe, Joe.


USDCAD Preparing for Major Breakout? | Key Levels + SetupUSDCAD is currently trading just below a key breakout zone at 1.36991, with strong demand holding the 1.36000 - 1.36800 range.
---
🔶 Technical Analysis:
✅ Support Zone (Demand):
The 1.3600 - 1.3680 region has acted as a strong base for several weeks now, with repeated tests and rejections confirming institutional interest.
✅ Resistance to Watch:
1.36991 – immediate breakout level
1.39744 – mid-range target
1.42591 – major supply/TP2 area
🟣 Volume Profile & LuxAlgo S&D:
Visible range & LuxAlgo show accumulation in the current zone, signaling a possible bullish reversal. Volume is increasing at key levels.
📉 Recent downtrend may be exhausted, as price forms a base and shows signs of strength from buyers.
---
🧠 Trade Idea:
🎯 Breakout Buy Setup:
Entry: Above 1.3700 (confirmation of breakout)
TP1: 1.3974
TP2: 1.4259
SL: Below 1.3640 (below demand zone)
📊 RR Ratio: ~1:2.5
---
⚠️ Watch This:
📅 Upcoming USD news (marked below chart) could act as a catalyst
💥 Breakout above 1.3700 with volume = potential strong bullish rally
---
📌 Summary:
USDCAD is consolidating in a high-demand area. A break above 1.3700 may trigger a bullish continuation targeting 1.3974 and possibly 1.4259. Patience and confirmation are key.
🚀 Are you watching this setup too? Drop your thoughts below!
#USDCAD #Forex #Breakout #LuxAlgo #SmartMoney #TradingView #PriceAction #4HSetup #ForexSignals

USDCAD INTRADAY downtrend resistance at 1.3750The USDCAD currency pair continues to exhibit a bearish sentiment, aligned with the broader downtrend. Recent price action suggests a corrective pullback is underway, testing previous resistance zones.
Key Resistance Level: 1.3750 — This marks a significant intraday consolidation area. A rejection at this level would reinforce bearish momentum.
Support Targets: If price fails to break above 1.3750 and turns lower, potential downside targets include:
1.3640 (near-term support)
1.3580 (intermediate support)
1.3530 (longer-term support)
On the bullish side, a confirmed breakout and daily close above 1.3750 would invalidate the current bearish bias. In that case, upside resistance levels to watch are:
1.3800 (psychological level)
1.3860 (major resistance zone)
Conclusion:
USDCAD remains technically bearish unless it achieves a sustained break above 1.3750. Traders should watch for a rejection at this key level to confirm further downside potential. A breakout above would shift the outlook to bullish, targeting higher resistance zones.
This communication is for informational purposes only and should not be viewed as any form of recommendation as to a particular course of action or as investment advice. It is not intended as an offer or solicitation for the purchase or sale of any financial instrument or as an official confirmation of any transaction. Opinions, estimates and assumptions expressed herein are made as of the date of this communication and are subject to change without notice. This communication has been prepared based upon information, including market prices, data and other information, believed to be reliable; however, Trade Nation does not warrant its completeness or accuracy. All market prices and market data contained in or attached to this communication are indicative and subject to change without notice.

Short ideaTrade as per your confluences & risks
I have the right to go wrong
My probability is just above 60%
THE USD CAD PAIR USD/CAD 1H Chart – Busy with Levels but the Bias is Clear 📊✨
Multiple confluences pointing to bullish intent: trendline support, key demand zones, and clean higher lows. Despite the clutter, price is respecting structure. Watching for a clean break above recent highs to ride the buy-side liquidity sweep. Eyes on 1.38+ 📈
#ForexTrading #USDCAD #SmartMoney #TechnicalAnalysis"

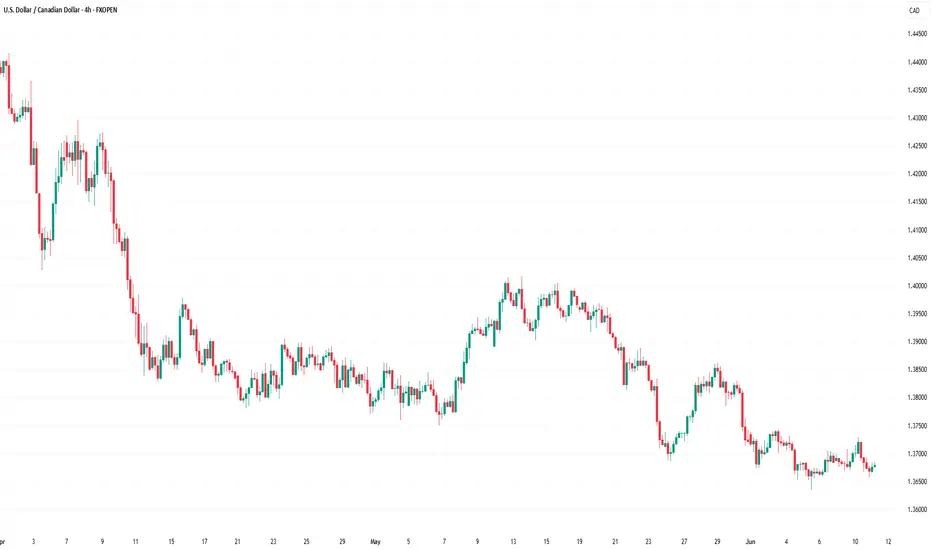
USD/CAD Holds Near 2025 LowUSD/CAD Holds Near 2025 Low
When we last analysed the USD/CAD chart on 4 June, we identified a descending channel that remains relevant.
On 5 June, the pair reached a new low for 2025, and it is possible that bears will attempt to extend this move further over the course of the month.
Why is USD/CAD declining?
The Canadian dollar appears to be strengthening amid speculation that a trade agreement between the US and Canada could be finalised soon — possibly on 15 June, when the G7 summit is due to be held in Canada.
Media reports highlight several indicators supporting this view:
→ Prime Minister Mark Carney stated that Canada will meet its NATO spending target of 2% of GDP.
→ Canada refrained from retaliatory tariffs on steel and aluminium.
→ The US ambassador to Canada confirmed that “secret” negotiations are ongoing.
Technical Analysis of the USD/CAD Chart
Note that the R-line, which divides the lower half of the descending channel into two equal parts, acted as resistance — price reversed downward from this line and accelerated lower (as indicated by the arrow). This reinforces the view that bears currently dominate the USD/CAD market.
For now, the 1.3650 level appears to be a support zone for bulls, but its strength may be tested today as markets react to US inflation data. The Consumer Price Index (CPI) report is scheduled for release today at 15:30 GMT+3. Be prepared for potential spikes in volatility.
This article represents the opinion of the Companies operating under the FXOpen brand only. It is not to be construed as an offer, solicitation, or recommendation with respect to products and services provided by the Companies operating under the FXOpen brand, nor is it to be considered financial advice.
Check the trend A trend change is expected to form within the current support area and we will see the start of an uptrend. A consolidation above the blue trend line will confirm the uptrend.

USDCAD Trade Signal – BUY NOW Entry Point: 1.36780USDCAD Trade Signal – BUY NOW
Entry Point: 1.36780
🎯 1st Target: 1.37000
🎯 Final Target: 1.37300
📈 Bullish momentum spotted on USDCAD
📊 Strong support at 1.3670 holding firm
🟢 Clean upside potential for short-term traders
🔍 Technicals show breakout confirmation
🧠 Risk Management is Crucial
📉 Recommended Stop-Loss: Below 1.36550
⚖️ Risk only 1–2% of your capital
🛑 No overleveraging — protect your account
💼 Ideal setup for intraday/swing traders
🧭 Let the market come to you
📌 Set alerts, stay focused
🕒 Be patient, follow your plan
🔁 Don’t chase, execute with precision
📢 Trade smart, trade safe!
💬 Drop your thoughts or results below 👇


usd/cadTRADE 2 looking for a long let the flow take it where its going just using momentum and following up on price movment


Bearish reversal off 61.8% Fibonacci resistance?USD/CAD is rising towards the resistance level which is a pullback resistance that aligns with the 61.8% Fibonacci retracement and could reverse from this level to our take profit.
Entry: 1.3703
Why we like it:
There is a pullback resistance level that lines up with the 61.8% Fibonacci retracement.
Stop loss: 1.3740
Why we like it:
There is a pullback resistance level.
Take profit: 1.3644
Why we like it:
There is a pullback support level.
Enjoying your TradingView experience? Review us!
Please be advised that the information presented on TradingView is provided to Vantage (‘Vantage Global Limited’, ‘we’) by a third-party provider (‘Everest Fortune Group’). Please be reminded that you are solely responsible for the trading decisions on your account. There is a very high degree of risk involved in trading. Any information and/or content is intended entirely for research, educational and informational purposes only and does not constitute investment or consultation advice or investment strategy. The information is not tailored to the investment needs of any specific person and therefore does not involve a consideration of any of the investment objectives, financial situation or needs of any viewer that may receive it. Kindly also note that past performance is not a reliable indicator of future results. Actual results may differ materially from those anticipated in forward-looking or past performance statements. We assume no liability as to the accuracy or completeness of any of the information and/or content provided herein and the Company cannot be held responsible for any omission, mistake nor for any loss or damage including without limitation to any loss of profit which may arise from reliance on any information supplied by Everest Fortune Group.

Can 1.3633 Construct a Bottom?The USD/CAD exchange rate continues to maintain a (sideways) pattern, currently trading around 1.37. Although the US dollar is fundamentally supported by the boost from the US non-farm payroll data and the optimistic expectations of trade negotiations in major economies, the overall market sentiment remains cautious. The Canadian dollar is supported by the strengthening of crude oil prices, and the exchange rate trend presents a complex pattern of mixed long and short positions. In the short term, if the exchange rate can effectively break through 1.3800 and stabilize above this level, it will open up further upward space. The next targets may point to the middle track of Bollinger Bands at 1.3823 and the previous platform resistance area at 1.3900. However, if it is blocked again at the 1.3800 line and falls back, it will increase the market expectation of "making a new low after a technical rebound". At that time, the supports will focus on 1.3640 and the low point of 1.3633. If the latter is broken, it will open up the downward space to 1.3600 or even 1.3550.
Humans need to breathe, and perfect trading is like breathing—maintaining flexibility without needing to trade every market swing. The secret to profitable trading lies in implementing simple rules: repeating simple tasks consistently and enforcing them strictly over the long term.

Oil's Volatility Meets Fed's Patience: A Path to 1.3643?USDCAD – Oil's Volatility Meets Fed's Patience: A Path to 1.3643?
🌍 Macro Landscape: Diverging Monetary Paths & Oil's Influence
The USDCAD pair is currently navigating a complex environment shaped by diverging central bank policies and the significant influence of crude oil prices. While the Federal Reserve is signaling a "higher-for-longer" interest rate stance due to sticky inflation, the Bank of Canada (BoC) is in a more nuanced position, balancing inflation control with economic growth. This divergence creates a fundamental tailwind for the USD.
However, Canada's economy is heavily tied to commodity prices, especially crude oil. Recent volatility in oil markets can exert significant pressure on the Canadian dollar. If oil prices remain subdued or face downward pressure, it could exacerbate the CAD's weakness against the USD, amplifying the impact of policy divergence.
🏦 Central Bank Policy Divergence: Fed's Firmness vs. BoC's Caution
Federal Reserve: FOMC members continue to signal patience on rate cuts. Recent inflation data (PCE, CPI) shows persistent price pressure, particularly in the services sector, reinforcing the Fed's hawkish bias. This suggests the USD may retain its strength as higher rates attract capital.
Bank of Canada: The BoC, while having taken aggressive steps previously, might be more cautious in its future rate decisions. Any dovish undertones or hints at pausing rate hikes could weaken the CAD. Conversely, a resurgence in inflation or stronger economic data could prompt the BoC to maintain a firm stance.
This policy divergence, coupled with external factors like commodity prices, creates a fertile ground for significant moves in USDCAD.
🌐 Capital Flows: Safe-Haven Dynamics and Commodity Impact
Global capital flow models indicate a shift towards the US dollar as a preferred safe haven amidst geopolitical tensions and global economic uncertainties. While Gold remains a traditional hedge, the USD's yield advantage makes it an attractive destination for institutional capital.
For CAD, its sensitivity to commodity prices means that capital flows are heavily influenced by the outlook for global growth and energy demand. A softening global economic outlook could lead to reduced demand for commodities, weighing on the CAD, and potentially driving inflows into USD-based assets.
📊 Technical Structure: Channel Breakdown & Bearish Momentum Towards 1.3643
On the H1 chart (as observed from the provided image):
Price Channel: USDCAD has been trading within a clear ascending channel. However, the price recently broke below the lower boundary of this channel, suggesting a potential shift in momentum from bullish to bearish.
Moving Averages: The price has moved below the EMA 13 – 34 – 89. This bearish alignment (EMA "fan-out formation" in reverse) confirms a short-term bearish momentum is building. The 200 EMA (red line) is currently acting as a key resistance level, near the prior support turned resistance.
Key Resistance (Sell Zone): The region around 1.36989 (aligning with previous support and possibly a Fibonacci retracement level) is now acting as a crucial resistance. Any retest of this zone, especially with bearish candlestick patterns, could offer selling opportunities. The 200 EMA reinforces this zone as a strong overhead barrier.
Key Support (Target Zone): The price is projected towards 1.36431. This level aligns with a strong prior support and also coincides with the Fibonacci Extension 1.382 level from a previous swing, making it a high-probability target for bearish moves. A bounce from 1.36734 (a mid-channel support or Fibonacci level) could offer a temporary reprieve, but the overall technical structure points to the lower target.
🎯 Trade Strategy Recommendations
Scenario 1 – Sell the Pullback (Preferred):
Entry: 1.3685 – 1.3695 (retest of broken channel line/resistance near 1.36989, possibly confluence with 200 EMA).
Stop-Loss: 1.3720 (above recent swing high/channel top).
Take-Profit: 1.3673 (initial target) → 1.3643 (main target) → 1.3620.
Scenario 2 – Breakout Momentum Sell (if price consolidates below 1.3673):
Entry: 1.3670 (break below 1.36734 with strong bearish momentum).
Stop-Loss: 1.3690.
Take-Profit: 1.3643 → 1.3620.
⚠️ Key Events to Watch:
US PCE Price Index (upcoming data): If hotter-than-expected, this would reinforce the Fed’s hawkish tone and lift USD.
Canadian CPI (upcoming data): Cooler-than-expected inflation could prompt a more dovish stance from the BoC, weakening CAD.
Crude Oil Inventory/News: Any significant news or data regarding global oil supply/demand can directly impact CAD.

