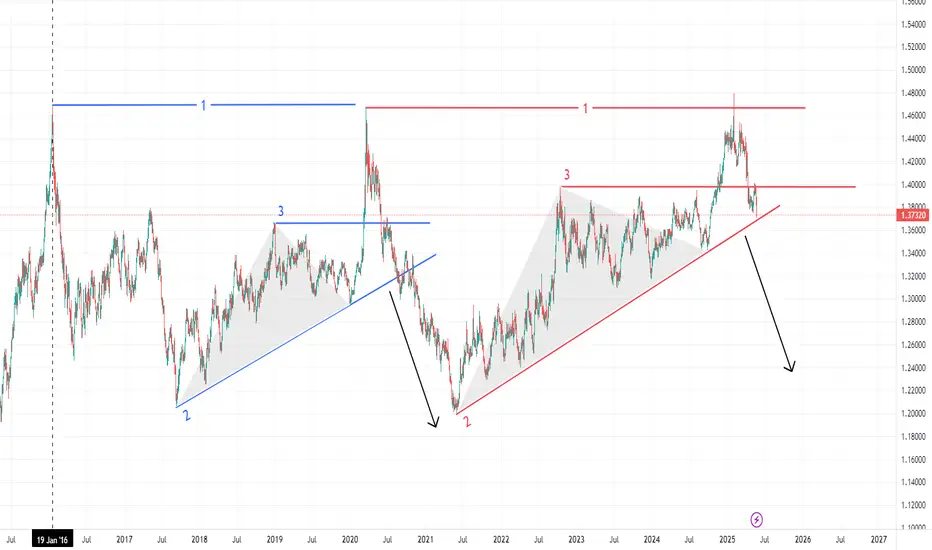
USDCAD A chance for Fall DownI see A chance for Fall down after breaks LEVEL 2 (trend line) similar to what happened before.
lets wait and see will happened next week.
Do you agree ? what's your idea ?
USDCAD trade ideas
USDCAD Under PressureSeveral negative data points were released this week for the US dollar, led by the ADP Non-Farm Employment Change, which posted its lowest reading since March 2023 at just 37K. Additionally, the Non-Manufacturing PMI fell below the key 50 level, recording 49.9. These readings add further downside pressure on the US dollar. On the other hand, the Bank of Canada kept interest rates steady at 2.75%.
Technical Outlook on the Daily Chart
The US Dollar against the Canadian Dollar (USDCAD) is trading in a general downtrend, forming lower highs and lower lows, confirming the bearish momentum.
Traders should monitor any corrective rise toward the 1.38164 level as a potential opportunity to continue the downtrend and target 1.36015.
However, a break and daily candle close above 1.38611 would invalidate the bearish scenario.
Note
Markets are anticipating the US and Canadian employment data due on Friday, June 6, 2025. Significant volatility is expected upon their release, especially for the USDCAD pair.

USDCAD BUY 1.3575On the weekly chart, USDCAD forms a potential bullish bat pattern in the short term, with the buying position focusing on 1.3575, which is also within the previous demand area.

Usdcad This is another clean setup from the last signal we were expecting price to go down to de last support but for some reason I left early and we have price breaks the previous support and is now acting like a resistance so we are expecting price to retrace on that zone de we sell more

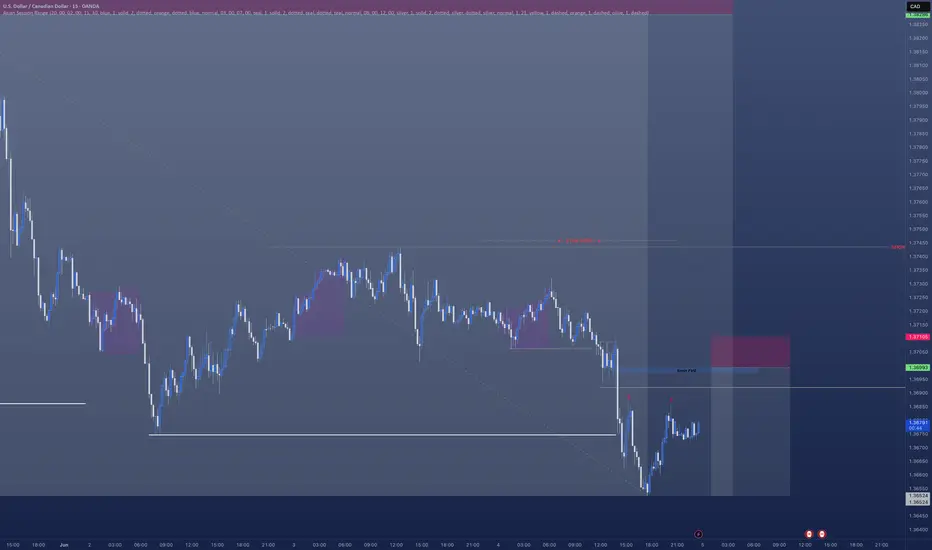
USDCAD - Short ContinuationHave a really nice short currently open on USDCAD
However I am looking to get a further position opened which come in the morning.
There's a clear break of structure.
- A nice FVG left behind.
- We are creating liquidity / inducement
- All pointing towards a nice further sell off in the morning.
Ideal situation is we sweep Asian session highs in the morning in the hope we move lower
USD/CAD at a Turning PointTechnical Analysis: Signs of a Bottoming Out
USD/CAD’s technical picture is beginning to shift from bearish to cautiously bullish. Let’s start with what the daily chart is telling us. Over April, the pair’s decline started to stall around the 1.3780 – 1.3810 zone, which corresponds to a second support level (S2) on pivot point charts. In fact, 1.3780 has been identified by analysts as a “critical support”areaeconomies.com, and the market has thus far respected this floor. For roughly two weeks, prices have been consolidating in a tight range just above this support, roughly between 1.378 and 1.388. This kind of sideways basing after a drop indicates that selling pressure is no longer as aggressive – the CAD hasn’t been able to push the USD convincingly below the support line around 1.38.
Several momentum indicators are aligning to suggest that the worst of the downtrend may be over:
MACD Crossover: The Moving Average Convergence Divergence (MACD) indicator, a favorite tool for gauging trend changes, is on the verge of a bullish crossover (i.e. the MACD line is crossing above the signal line). As of late April, daily MACD had already flipped to a “Buy” readingfortrade.com. A bullish crossover after a prolonged down-move implies the downward momentum is fading and buyers are starting to gain the upper hand. We’re also seeing the MACD histogram (which visualizes the difference between the MACD and its signal) tick up from deeply negative values toward the zero line, reinforcing the idea of a momentum reversal.
RSI Rising from Oversold: The Relative Strength Index (RSI), which measures the speed and change of price movements, dipped into oversold territory during the April sell-off. (Typically, an RSI reading below 30 is considered oversold and a possible sign of an overextended move.) In late April, USD/CAD’s daily RSI was hovering in the low 30sfxstreet.com. Now, in early May, the RSI has climbed upward, moving through the 40s and toward the mid-50s. This upward turn suggests that the prior bearish momentum is abating – in other words, sellers are running out of steam and buyers are gradually stepping in. Notably, the RSI made higher lows even as price made a lower low around 1.378, a classic bullish divergence hinting that the downtrend was losing strength.
Support and Price Action: Price action itself underscores the potential for a bottom. The 1.3800 area (pivot S2)has been tested multiple times and remains intactfxstreet.com. Each dip into the high-1.37s was met with buying interest, as evidenced by candles with lower wicks and quick recoveries back above 1.38. This demand zonearound 1.378–1.381 has effectively absorbed selling pressure. One trader on TradingView noted that “USD/CAD is bouncing off a major daily support level around 1.38100 after a strong bearish move. Price action shows early signs of bullish interest, with the potential for a correction toward the 50-day Simple Moving Average.”tradingview.com. The fact that the pair is holding this support is crucial – it provides a clear line in the sand. As long as 1.3780 holds, the bullish thesis remains alive. A break below that would be a warning sign, but so far the floor has held firm.
Ichimoku Cloud and A Shift in Trend: The daily Ichimoku cloud on the chart (the colored cloud area representing support/resistance and trend) is still positioned above current prices – a legacy of the prior downtrend. However, the pair’s consolidation means it is no longer plunging deeper below the cloud; instead, it’s inching closer to the cloud’s base. Often, when a trend is about to reverse, we see price start testing the underside of the Ichimoku cloud or the baseline (Kijun-sen). While USD/CAD hasn’t broken out above the cloud yet, it’s noteworthy that the cloud ahead is thinning and flattening. A thinner cloud can be easier to break, and a flat Kijun line (baseline) around the 1.40–1.41 area could act like a magnet for price if bullish momentum kicks in. In short, the Ichimoku system is saying the trend is still technically bearish, but conditions are improving for a potential bullish breakif buyers can push the price into the cloud.
Another technical element worth mentioning is the moving averages. During the decline, USD/CAD stayed below short-term moving averages, which acted as resistance. Now we see price testing those moving averages from below. For instance, the 10-day exponential MA and 20-day MA lurk around 1.3870–1.3900 – right where the current consolidation top is. A break above 1.39 would not only clear this minor consolidation range but also put the price back above those moving averages, a bullish sign. Beyond there, the 50-day SMA (around the mid-1.41s) could be an initial target for a rebound. All in all, the technical setup is showing early glimmers of a reversal: a solid support base, momentum indicators flipping positive, and weakening bearish forces. This lays a technical foundation for the argument to go long USD/CAD.
Why This Could Be an Opportunity to Go Long USD/CAD
Bringing together the technical signals and the macro context, the case for a USD/CAD rebound is getting stronger. Here’s a quick recap of why early May 2025 may be an attractive entry point for USD/CAD longs (buying USD against CAD):
Rock-Solid Support: The pair has a concrete floor around 1.3780–1.3800 that has held firmly through multiple tests. This pivot support (S2) level has proven its strengthfxstreet.com, indicating significant buying interest at those lows. A strong support means downside risk can be well-defined (for example, one can place a stop-loss just below it in a trade scenario), and it often serves as a launchpad for rebounds when the broader trend shifts.
Momentum Shift to Bullish: Key momentum indicators are flipping in favor of USD momentum. The MACD on the daily chart has turned upward, signaling waning bearish momentum and a possible bullish crossover – a classic early reversal sign. Likewise, the RSI has risen out of oversold territoryfxstreet.com, showing that the prior selling momentum is exhausted. In fact, a short-term trading model as of Apr 29 showed multiple daily indicators (MACD, RSI, Stochastics) all giving “Buy” signals for USD/CADfortrade.com. When formerly pessimistic indicators start signaling “buy” in unison, it’s often a telltale sign of a trend ready to change direction.
Bullish Price Action Clues: Price is speaking volumes: higher lows are forming on intraday charts and the pair is making attempts to push higher within the recent range. We’ve observed bullish candlestick patterns like small daily dojis and hammers near the lows, reflecting indecision and failed attempts by sellers to break lower. This kind of consolidation after a drop often indicates that the next significant move could be up, especially given the momentum backdrop. Additionally, if USD/CAD breaks above the 1.3900 resistance (which is the upper bound of the consolidation and near the 10-day/20-day moving averagesfxstreet.com), it would mark the first higher-high in weeks – essentially confirming the short-term trend reversal.
USD Fundamentals Support a Rise: The U.S. dollar’s broader fundamentals are relatively robust. The Fed’s higher-for-longer stance (with only modest rate cuts expected later) keeps USD interest rates attractiveam.jpmorgan.com, and the U.S. economy has been outperforming many peers in growth, which has underpinned the USD’s strengtham.jpmorgan.com. This means any USD weakness narrative might have been overdone – if traders realize the Fed won’t ease as much as hoped, USD could get a second wind. A stable or rising USD on the global stage directly benefits a long USD/CAD position.
Canadian Headwinds (Oil & Risk): The Canadian dollar, in contrast, faces a few headwinds. Commodity support is lacking – with oil prices recently in the doldrums at 4-year lows around $58investingnews.com, a key pillar of CAD strength has crumbled. Unless oil stages a dramatic comeback (which is not expected immediately, given only a moderate rebound to ~$68–$74 forecasted by the EIAinvestingnews.com), the CAD could struggle to maintain its recent strength. On top of that, if global risk appetite wavers, traders could rotate out of risk-sensitive currencies like CAD into safer havens. In short, the CAD may have enjoyed a good run, but the tables appear set to turn in favor of the USD.
Attractive Risk/Reward Setup: From a trading perspective, going long USD/CAD near current levels offers a compelling risk-to-reward scenario. The support at ~1.3780 provides a logical and tight risk cutoff – if the pair falls decisively below that, one can admit the bullish thesis was premature and exit. On the upside, even a retracement to mid-range resistance levels like 1.4000–1.4100 (around the 50-day MA or pivot resistance) would yield a solid gain relative to the risk. The trader who shared the long idea on USD/CAD set a target around 1.4140, just shy of major resistance, highlighting the potential for a move of several hundred pips off the lows if the reversal takes holdtradingview.com. The combination of well-defined support, improving indicators, and room overhead for a bounce means the odds are tilted that a long position could be rewarded.
Of course, no trade or investment is guaranteed – and one must always stay vigilant. If USD/CAD were to close below ~1.3780 support, it would call into question the bullish setup and could open the door to further downside (perhaps another leg down to the mid-1.37 or even low 1.36 area in a bearish scenario). But as things stand, the evidence leans bullish, and the reward potential outweighs the remaining downside risk, in our view.

CAD/USD TRADE ALERT – SELL NOW Sell Entry Point: 1.37216CAD/USD TRADE ALERT – SELL NOW
Sell Entry Point: 1.37216
🎯 Final Target: 1.36497
📉 Bearish setup forming – opportunity in play!
🔍 Watching key resistance near 1.3720
📊 Downside momentum could take us toward 1.36497
🧠 Patience and precision matter in execution.
🛑 Always use a stop-loss – protect your capital!
⚠️ Risk Management is NON-NEGOTIABLE
📉 Don't overleverage – smart sizing = long-term survival.
📈 Know your levels – plan before you enter.
🔄 Let the trade play out – no panic, no FOMO.
🧭 Stay focused, stick to your setup.
💡 Each trade is a lesson – win or lose.
🗺️ Economic factors in play – stay informed.
💬 Drop your CAD/USD analysis below!
📚 Consistency beats intensity in trading.
⏳ Trust the process, not the noise.
🙌 Trade with confidence, not hope.
🚨 Watch the charts – price action leads the way.
#CADUSD #ForexTrade #SellSetup #RiskManagement #DisciplineMatters

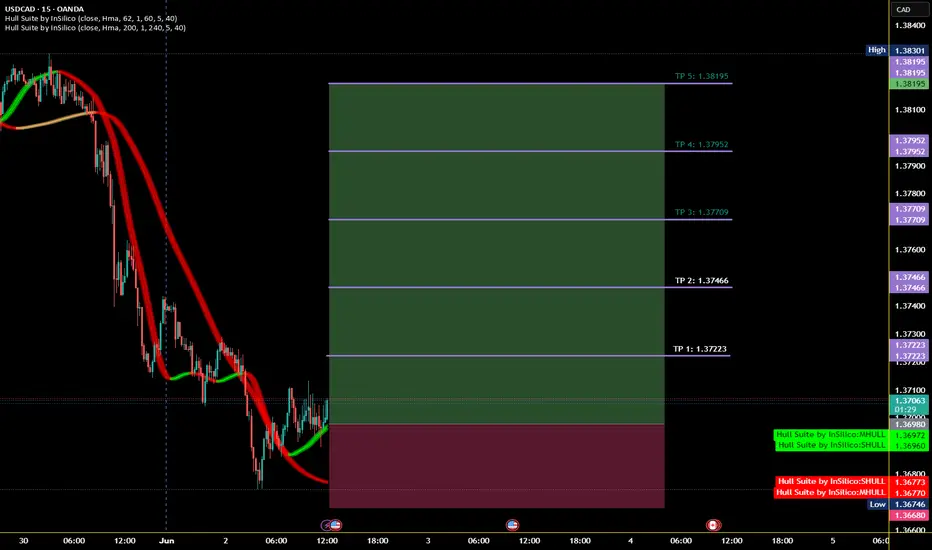
USDCAD massive breakout on Friday? - superswingI´m expecting massive breakout of this pair on Friday due to US (and CAD) NFP. If you decide to trade this pair, you can enter now at current market price 1,38218 or wait for premium-rejection zone at 1,39300-600. Personally I will use the 1. option and average higher if market let me. Use logical size to trade this idea. Every red line is a rejection zone, so TP your trade partially at these line. Do not try to reach the final target with full size. You can consider to trail your profit by moving the SL continuously down when red line is reached. Wish you good luck.

USDCAD BUYWaiting for rejection off the liquidity zone.
Then I will look to buy from that zone.
Buying only after the break above the HMA and the retest of the liquidity zone
**This is just my trading thought process and does not constitute as financial advice.
**Please trade with proper risk management*
USDCAD 04/06 – BoC Rate Decision Ahead USDCAD 04/06 – BoC Rate Decision Ahead | Will the Market Break Higher or Reverse From 1.3820?
The USDCAD pair is trading around the 1.3700 area as markets prepare for the upcoming Bank of Canada (BoC) interest rate decision. Price action shows potential for a breakout, but macro risks remain high.
🌍 MACRO OUTLOOK
BoC Expected to Hold Rates
Analysts widely expect the BoC to keep the interest rate unchanged at 2.75%, marking the third consecutive pause. Inflation has slipped below 2%, supporting the case for a dovish tone.
Trade Policy in Focus
With growing global uncertainties and Trump’s trade stance back in the spotlight, BoC Governor Tiff Macklem is expected to address policy risks, especially related to tariffs.
Market Sentiment
USD is mildly weaker after soft ISM data.
CAD remains near YTD highs but sensitive to policy commentary.
📉 TECHNICAL OUTLOOK – H2 Chart
Price is forming a potential double bottom near the 1.3693 zone – a key structure support.
Resistance sits at 1.3725 – 1.3757. A confirmed breakout could lead to a test of 1.3824, the recent high.
Failure to hold 1.3690 may expose deeper downside toward 1.3620–1.3600.
🔑 KEY LEVELS TO WATCH
🟢 BUY ZONE: 1.3693 – 1.3700
SL: 1.3670
TP: 1.3725 → 1.3757 → 1.3800 → 1.3824
🔴 SELL ZONE: 1.3824 – 1.3830
SL: 1.3850
TP: 1.3780 → 1.3750 → 1.3700 → 1.3650
🎯 TRADE STRATEGY
If BoC holds rates with a dovish bias, USDCAD may rally sharply toward 1.3824 and potentially higher.
If BoC surprises with hawkish comments, CAD strength may push the pair lower, targeting the 1.36 handle.
Traders should be cautious around 1.3690 – this is the pivot zone for the week.
📌 CONCLUSION
“The BoC’s decision may already be priced in – but the true volatility could come from Governor Macklem’s press conference. Any hint regarding Trump’s trade policies could trigger sharp moves. Stick to clean key levels and protect your capital.”

SELL ON THE USD/CAD?The price has broken the upward trendline, going downwards, after it ranged for a while near the upward trendline which seems to be a previous resistance zone. I believe it might continue to go down as there are no much buyers since the market hit the peak and went down. I think it might go down to 1.34120 i dont know.
USD/CAD BUYING OPPORTUNITY.i'm waiting for a buying opportunity here on the USD/CAD because i believe its continuing the bullish movement and it has also broke out from a descending triangle on a 4H and retested it and it currently has good bullish momentum.

USDCAD Hello traders,
Since I didn't find any valid opportunities on my primary pairs today, I looked into some alternative setups — and USDCAD caught my eye 🙂
I spotted a potential sell opportunity, and I’ve already entered the trade. Below are the details of my entry and target levels:
🔍 Trade Details:
✔️ Timeframe: 15-Minute
✔️ Risk-to-Reward Ratio: 1:1.50 / 1:2
✔️ Trade Direction: Sell
✔️ Entry Price: 1.37248
✔️ Take Profit: 1.37054
✔️ Stop Loss: 1.37345
🔔 Disclaimer: This is not financial advice. I’m simply sharing a trade I’ve taken based on my personal trading system, strictly for educational and illustrative purposes.
📌 Interested in a systematic, data-driven trading approach?
💡 Follow the page and turn on notifications to stay updated on future trade setups and advanced market insights.

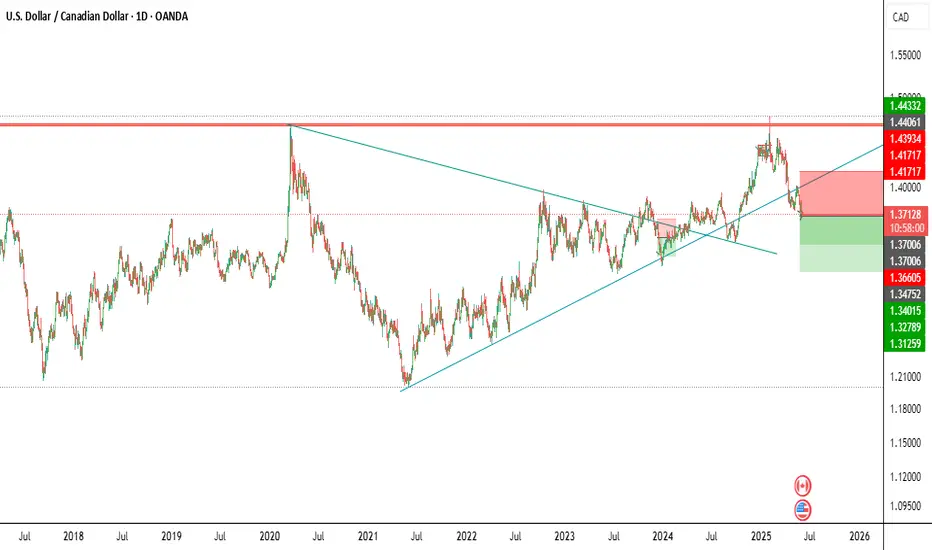
USD/CAD Holds Near 2025 LowUSD/CAD Holds Near 2025 Low
As the chart shows, the USD/CAD exchange rate hit its lowest level of 2025 on 2nd June, nearing the 1.3680 mark. Although there was a partial recovery on 3rd June, it was not substantial.
These fluctuations reflect market participants’ cautious sentiment ahead of key announcements scheduled for today, 4th June:
→ At 15:15 (GMT+3), the ADP Employment Change figures will be released, offering insight into the US employment situation. Traders are concerned as the previous reading was only +61K — a sharp contrast to the consistent triple-digit increases seen throughout 2024.
→ At 16:45 (GMT+3), the Bank of Canada will announce its interest rate decision. According to ForexFactory, analysts expect the overnight rate to remain unchanged at 2.75%, though surprises cannot be ruled out.
Technical Analysis of USD/CAD
Since the second half of April, the price has been moving within a downward channel (marked in red), largely influenced by tariff-related developments in US-Canada trade relations.
Bulls are attempting to prevent further decline, taking advantage of the support provided by the channel’s lower boundary. Note the sharp rebound following a failed bearish breakout (marked with an arrow), which suggests strong demand around the 1.3700 level.
On the other hand, bears have gained control over the 1.3800 level, based on the following:
→ The exchange rate found local support at this level on 29th May, but it was breached on 30th May.
→ The drop from 30th May was notably aggressive, indicating strong selling pressure.
Given the above, it is reasonable to assume that if, following today’s news, the USD/CAD rate remains within the 1.3700–1.3800 range, it may signal that supply and demand have reached a stable balance. This could suggest that the pair is ready to stabilise after the intense volatility seen in the first half of April.
This article represents the opinion of the Companies operating under the FXOpen brand only. It is not to be construed as an offer, solicitation, or recommendation with respect to products and services provided by the Companies operating under the FXOpen brand, nor is it to be considered financial advice.


USDCAD ahead of BoC rate decision capped at 1.3840Today’s key focus is on the Bank of Canada’s interest rate decision. Markets will react to signs of inflation, growth, or central bank policy shifts.
Q1 Labor Productivity: Tracks efficiency of Canadian workers—important for inflation outlook.
Bank of Canada Rate Decision: Expected to keep rates at 2.75% due to sticky inflation, even as the economy slows.
Key Support and Resistance Levels
Resistance Level 1: 1.3840
Resistance Level 2: 1.3940
Resistance Level 3: 1.4020
Support Level 1: 1.3660
Support Level 2: 1.3580
Support Level 3: 1.3500
This communication is for informational purposes only and should not be viewed as any form of recommendation as to a particular course of action or as investment advice. It is not intended as an offer or solicitation for the purchase or sale of any financial instrument or as an official confirmation of any transaction. Opinions, estimates and assumptions expressed herein are made as of the date of this communication and are subject to change without notice. This communication has been prepared based upon information, including market prices, data and other information, believed to be reliable; however, Trade Nation does not warrant its completeness or accuracy. All market prices and market data contained in or attached to this communication are indicative and subject to change without notice.

The Day AheadKey Economic Events – Wednesday, June 4, 2025
🇺🇸 U.S.
ADP Jobs Report (May): A preview of private job growth; markets watch this ahead of Friday's official jobs report.
ISM Services PMI (May): Measures health of the U.S. services sector. A reading above 50 = growth.
Fed Speakers: Bostic and Cook will speak—markets listen for interest rate hints.
Beige Book: Fed’s regional economic summary, useful for understanding business trends.
🇬🇧 UK
Official Reserves (May): Change in the UK’s foreign reserves—can hint at FX market activity or interventions.
🇮🇹 Italy
Services PMI (May): Shows whether the Italian services sector is expanding or shrinking.
🇨🇦 Canada
Q1 Labor Productivity: Tracks efficiency of Canadian workers—important for inflation outlook.
Bank of Canada Rate Decision: Expected to keep rates at 2.75% due to sticky inflation, even as the economy slows.
Summary:
Today’s key focus is on U.S. jobs and services data, the Fed’s tone, and the Bank of Canada’s interest rate decision. Markets will react to signs of inflation, growth, or central bank policy shifts.
This communication is for informational purposes only and should not be viewed as any form of recommendation as to a particular course of action or as investment advice. It is not intended as an offer or solicitation for the purchase or sale of any financial instrument or as an official confirmation of any transaction. Opinions, estimates and assumptions expressed herein are made as of the date of this communication and are subject to change without notice. This communication has been prepared based upon information, including market prices, data and other information, believed to be reliable; however, Trade Nation does not warrant its completeness or accuracy. All market prices and market data contained in or attached to this communication are indicative and subject to change without notice.

trade viewthis is just a trade view
i am looking for trade from to the upper demand zone.
usd cad was falling and took support and started bouncing.
if usd gains strength then this trade can give you good return

usdcad buy tradeThe Relative Strength Index (RSI) is showing an upward trend, indicating increasing momentum. Additionally, the Moving Average Convergence Divergence (MACD) is showing a bullish crossover, further supporting the potential for an upward move.

USD/CAD Setup _ Bearish Momentum BuildingThe USDCAD 45-minute chart shows a clear downtrend, with price breaking below a rising channel and retesting a previous support-turned-resistance zone. A bearish breakout has occurred, indicating strong selling momentum. The confluence of trendline resistance and horizontal zone rejection reinforces the bearish bias. Price action has failed to sustain above the marked resistance, suggesting further downside. The setup is based on a break-and-retest strategy, favouring short positions as long as price remains below the resistance zone.
Entry: 1.37200
1st Target: 1.36480
2nd Target: 1.36190


I am very bullish I expect the price to move from the black line after a bounce from the major support level down. As a swing trader, I will be looking at price moving back to the next zone

USDCAD Rebound from Key Support – Bullish Setup in PlayUSDCAD pair has reached a technical inflection point at key support around 1.3700, where it is attempting a rebound after several days of bearish momentum. With recent Canadian data showing underlying economic strain and the U.S. dollar reacting to rate expectations and tariff news, this area becomes crucial for the next directional move.
🔍 Technical Analysis
Support Level: Price has respected the horizontal support at 1.3700–1.3685, forming a possible double-bottom structure on the 4H chart.
Bullish Reversal Zone: The latest candle shows a strong rejection wick at the support zone, suggesting bullish interest. The structure aligns with a classic bullish reversal pattern.
Target Zones:
First TP: 1.3849 (previous high / supply zone).
Second TP: 1.3860–1.3870 (Fibonacci extension + minor resistance).
Invalidation (SL): Below 1.3685, further downside may open to 1.3632.
🧠 Fundamental Context
U.S. Side:
GDP and NFP data have recently come out mixed, reducing the immediate pressure on the Fed to hike rates further.
Tariff uncertainty and appeal plans by the Trump administration are increasing near-term USD volatility.
US bond yields are firming again, giving the dollar mild support.
Canada Side:
Canadian Q1 GDP disappointed at 0.1%, lower than expected.
BoC is likely to hold rates steady, but the economy shows weak business investment and softening consumption growth.
Crude oil, Canada’s key export, is still under pressure, slightly weakening CAD.
✅ Conclusion
This setup favors a short-term long on USDCAD from current levels, targeting the upper resistance zone at 1.3849–1.3860. A break and close above 1.3870 could extend toward 1.3900. However, caution should be exercised with upcoming U.S. labor and trade data that may fuel volatility.
