USDCAD trade ideas
USD/CAD - Triangle Breakout (23.05.2025)The USD/CAD Pair on the M30 timeframe presents a Potential Selling Opportunity due to a recent Formation of a Triangle Breakout Pattern. This suggests a shift in momentum towards the downside in the coming hours.
Possible Short Trade:
Entry: Consider Entering A Short Position around Trendline Of The Pattern.
Target Levels:
1st Support – 1.3792
2nd Support – 1.3760
🎁 Please hit the like button and
🎁 Leave a comment to support for My Post !
Your likes and comments are incredibly motivating and will encourage me to share more analysis with you.
Best Regards, KABHI_TA_TRADING
Thank you.
Disclosure: I am part of Trade Nation's Influencer program and receive a monthly fee for using their TradingView charts in my analysis.

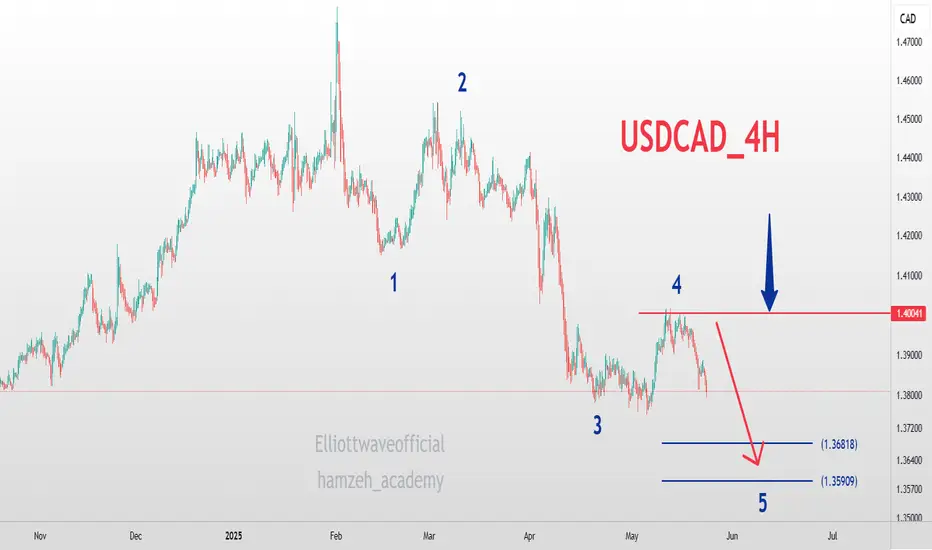
USDCAD_4H_SellCanadian Dollar Analysis Four-hour and medium-term time frame Elliott Wave Analysis Style Five waves down, with the top of wave 4 at 1.4000 and we are currently in wave 5 down towards the targets of 1.3680 and 1.3600
USDCAD WAITING FOR ACCURATE ZONE TO GO UPHi Traders,
Here my analysis on FX:USDCAD . Im waiting for the data release by Canada , Waiting to reach the blue zone before execute the trade.
Canada is forecast to record a decline in retail sales figures for March along with core data readings.
Have a Good Day Trader
USDCAD Massive Long! BUY!
My dear subscribers,
USDCAD looks like it will make a good move, and here are the details:
The market is trading on 1.3814 pivot level.
Bias - Bullish
My Stop Loss - 1.3784
Technical Indicators: Both Super Trend & Pivot HL indicate a highly probable Bullish continuation.
Target - 1.3877
About Used Indicators:
The average true range (ATR) plays an important role in 'Supertrend' as the indicator uses ATR to calculate its value. The ATR indicator signals the degree of price volatility.
Disclosure: I am part of Trade Nation's Influencer program and receive a monthly fee for using their TradingView charts in my analysis.
———————————
WISH YOU ALL LUCK

PERHAPS... USDCAD LONG FORECAST Q2 W21 D23 Y25PERHAPS... A REVERSAL BACK TO THE HTF 50EMA's
USDCAD LONG FORECAST Q2 W21 D23 Y25
Professional Risk Managers👋
Welcome back to another FRGNT chart update📈
Diving into some Forex setups using predominantly higher time frame order blocks alongside confirmation breaks of structure.
Let’s see what price action is telling us today!
💡Here are some trade confluences📝
✅Daily Order Block
✅Tokyo ranges to be filled
✅15' order block identified
✅Weekly 50 EMA
✅Daily 50 EMA
🔑 Remember, to participate in trading comes always with a degree of risk, therefore as professional risk managers it remains vital that we stick to our risk management plan as well as our trading strategies.
📈The rest, we leave to the balance of probabilities.
💡Fail to plan. Plan to fail.
🏆It has always been that simple.
❤️Good luck with your trading journey, I shall see you at the very top.
🎯Trade consistent, FRGNT X
USD/CAD Rate Drops Towards Yearly LowsUSD/CAD Rate Drops Towards Yearly Lows
The USD/CAD chart is currently showing clear signs of a bearish trend, characterised by a sequence of lower highs and lower lows (A→B→C→D→E→F→G).
This week’s decline suggests the downward structure may continue to develop, putting the current yearly low around the 1.3770 level at risk.
Why Is USD/CAD Falling?
On one hand, the US dollar remains under pressure:
→ Following last week’s downgrade of US debt ratings by Moody’s, investor attention has shifted to the country’s $36 trillion debt burden.
→ A tax bill backed by Donald Trump — recently passed in the Republican-controlled House of Representatives — could add trillions more to the national debt. Market participants may be increasingly concerned about the US’s fiscal outlook, prompting a shift towards safe-haven assets.
On the other hand, the Canadian dollar has strengthened this week relative to other major currencies. Tuesday’s CPI figures from Canada came in above analysts’ expectations and may be seen as a sign that the inflation surge could delay any potential rate cuts by the Bank of Canada.
USD/CAD Technical Analysis
In early May, we outlined a descending channel on the USD/CAD chart — a structure that remains relevant today.
The current price is hovering near the channel’s median line, which could indicate a temporary balance between supply and demand. However, with Canadian retail sales data due at 15:30 GMT+3 today, the risk of increased volatility remains high. A new weekly low cannot be ruled out.
This article represents the opinion of the Companies operating under the FXOpen brand only. It is not to be construed as an offer, solicitation, or recommendation with respect to products and services provided by the Companies operating under the FXOpen brand, nor is it to be considered financial advice.

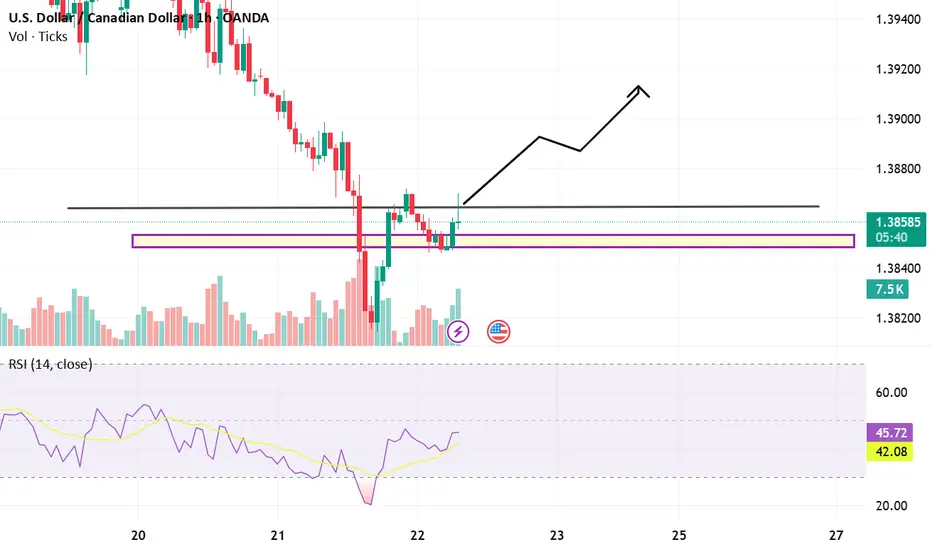
check the trendIt is expected that a trend change will occur within the specified support area and we will witness the beginning of an upward trend. Otherwise, if the support area is broken, the continuation of the downward trend is likely.
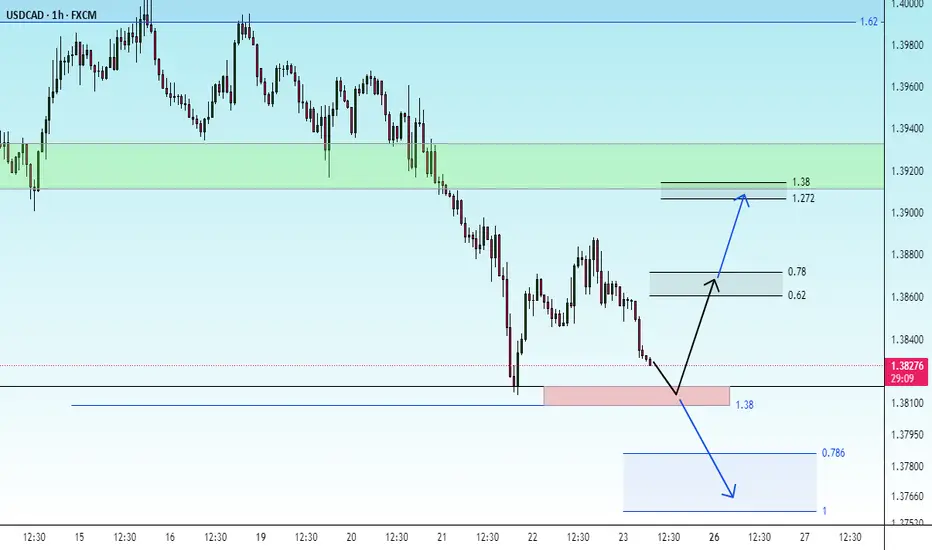
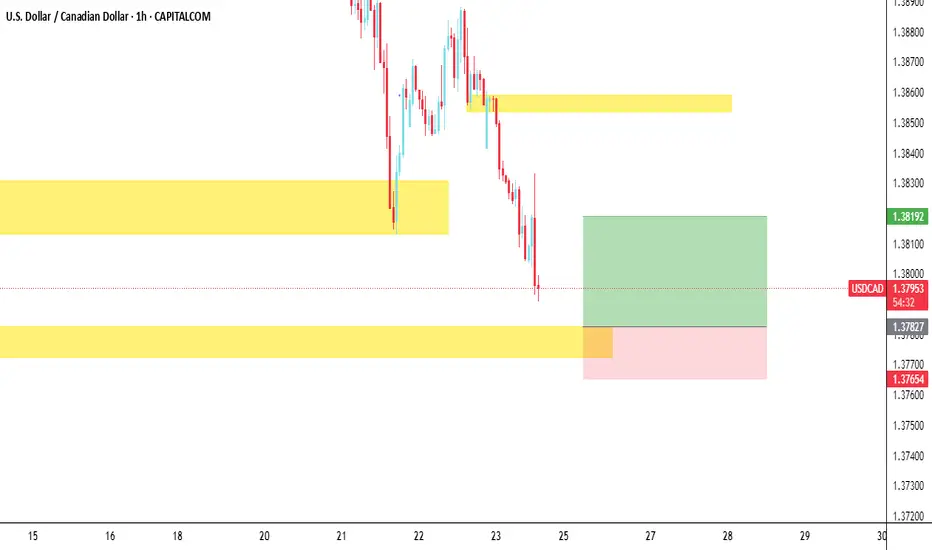
USDCAD taking two trades hear
reason behind that is simple market in down trend making LL LH as of now its in LL Zone and theirs no strong LH so just capturing that move with two trades

USD/CAD💰Symbol: { USD/CAD }
🟩Price: { 1.38933 }
🟥Stop: { 1.39307 }
1️⃣profit: { 1.38580 }
2️⃣profit: { 1.38171 }
3️⃣profit: { 1.37725 }
📊Check your chart before entering.
🚨Check before use to make sure there is no important news.🚨

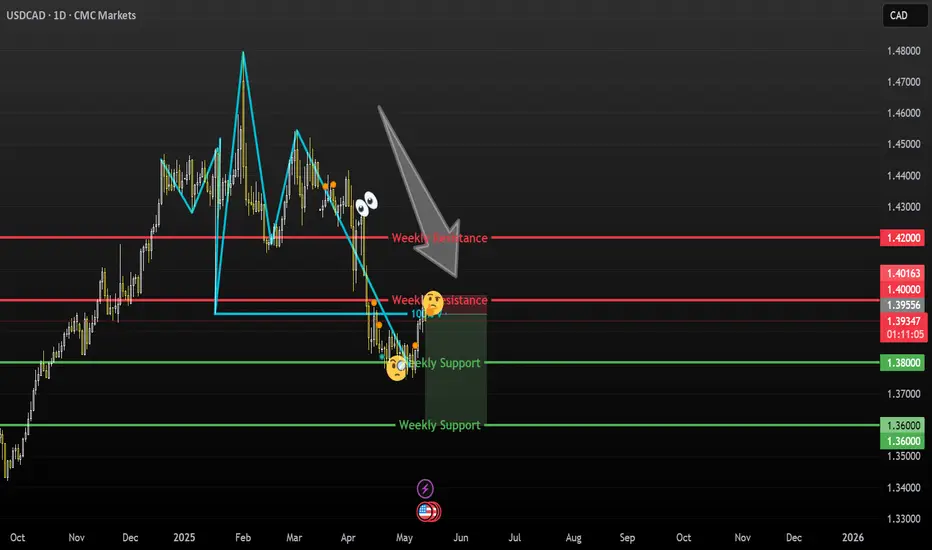
USDCAD Tests Key Trendline and Support ZoneUSDCAD has dropped below the 1.40 level after previously testing the 1.47 resistance during peak tariff fears. With the dollar index weakening and trade-related concerns easing, USDCAD has pulled back to a key trendline on the daily timeframe.
Since 2015, USDCAD has traded within a broad range between 1.20 and 1.47. After testing the 1.20 support in mid-2021, the pair entered a steady uptrend, which is now being tested once again. In addition to the rising trendline, there is also a horizontal support zone at 1.37–1.3880—previously a key resistance area during the 2023–2025 period. This convergence of trendline and horizontal support could provide strong support.
As long as the trendline holds, this test may offer a medium-term buying opportunity with a well-defined support area. Potential upside targets include 1.4020 and 1.4175, with a possible medium-term push back toward 1.47 if broader conditions align.

USDCAD RETEST OR FRESH DOWNTREND? PRICE AT A CRUCIAL CROSSROAD!USDCAD 22/05 – KEY RETEST OR FRESH DOWNTREND? PRICE AT A CRUCIAL CROSSROAD!
🌐 MACRO BACKDROP:
Canada’s CPI and Retail Sales have come in weaker than expected, signaling sluggish consumer demand and reducing the probability of near-term rate hikes by the Bank of Canada.
Meanwhile, the USD is stabilizing, supported by steady U.S. Treasury yields after the Fed reaffirmed its “higher for longer” stance.
Oil prices, a major driver of the Canadian Dollar, have shown no significant breakout, further weakening CAD’s bullish momentum.
🔍 TECHNICAL OVERVIEW (H1–H4 Chart):
After hitting a key swing low at 1.3820, USDCAD is now retracing towards the 0.5 Fibonacci zone (1.3889 – 1.3913), which also aligns with:
The 200 EMA resistance (red line)
Previous structure rejection zone
➡️ This area is critical – it could act as a trap zone before price resumes downward or breaks to confirm a short-term bullish reversal.
📈 TRADE SETUPS:
🔻 SELL SETUP (HIGH PROBABILITY IF PRICE FAILS AT RESISTANCE):
Entry: 1.3900 – 1.3913
Stop Loss: 1.3930
Take Profit Targets: 1.3884 → 1.3859 → 1.3847 → 1.3820
🔹 BUY SETUP (IF PRICE HOLDS ABOVE THE BASE ZONE):
Entry: 1.3820 – 1.3823
Stop Loss: 1.3805
Take Profit Targets: 1.3847 → 1.3880 → 1.3913
⚠️ STRATEGY NOTES:
Be cautious during the New York session, as potential comments from Fed officials or crude oil updates could spike volatility.
This is a textbook case of “reaction vs. continuation” at a Fibo cluster – stick to confirmed candlestick signals to avoid false breakouts.
📌 FINAL THOUGHTS:
USDCAD is in a corrective rally after an extended decline. The 1.3913 zone is a key decision point. Sellers should watch for signs of exhaustion, while buyers can target short-term retracements if support holds at 1.3820.

USD/CAD BUYERS WILL DOMINATE THE MARKET|LONG
Hello, Friends!
We are targeting the 1.400 level area with our long trade on USD/CAD which is based on the fact that the pair is oversold on the BB band scale and is also approaching a support line below thus going us a good entry option.
Disclosure: I am part of Trade Nation's Influencer program and receive a monthly fee for using their TradingView charts in my analysis.
✅LIKE AND COMMENT MY IDEAS✅

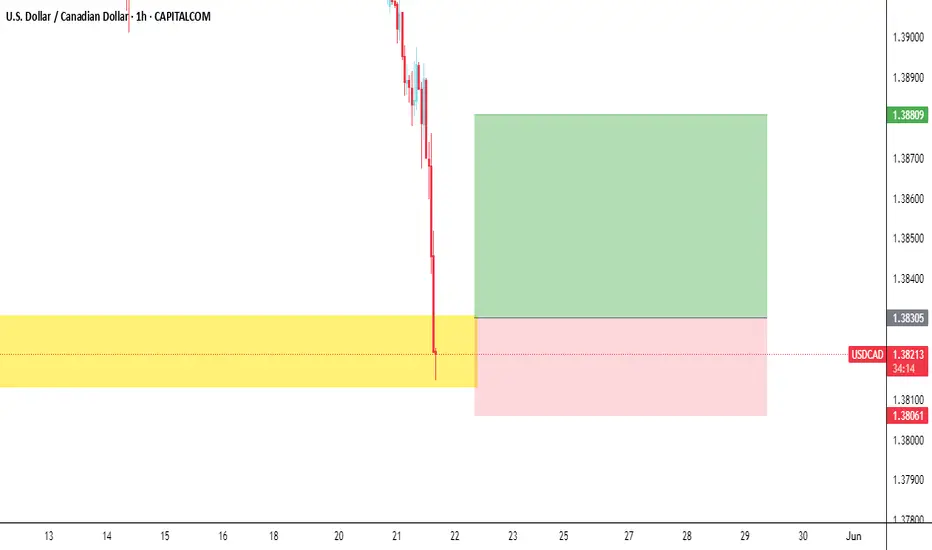
USDCAD TechnicalsThe pair attempting a recovery following a sharp bearish decline. After a significant selloff, price found strong support in the 1.38300–1.38440 zone, where multiple rejections indicate the presence of demand. This area has now acted as a base for a bullish reaction, confirmed by increasing bullish volume on the most recent candles.
The recovery is now pushing back toward a previously broken structure zone around 1.38770–1.38800, which is expected to act as resistance. This is a critical level to watch, as it previously marked a breakdown point. If price manages to push above and hold, it could signal a reversal or at least a corrective rally within the broader downtrend.
Momentum indicators are showing early signs of recovery. The RSI has climbed to around 46, rebounding from a low and crossing its moving average. While it remains below the neutral 50 level—still slightly favoring sellers—the upward momentum is strengthening. This supports the current short-term bullish movement, especially if price remains above the 1.3840 handle.
The short-term trend is shifting toward bullish, supported by a potential higher low structure forming after the recent dip. A clean break and hold above 1.3880 could open the door for a move toward the psychological round number at 1.3900 and potentially higher toward 1.3920–1.3940.
However, if the price fails to hold above 1.3840 and breaks back into the support box with bearish volume, the recovery thesis would be invalidated, suggesting a potential revisit of the 1.3820 level and lower.
In summary, the chart suggests a cautious bullish bias with near-term upside potential, contingent on maintaining support above the demand zone and breaking through the resistance around 1.3880 with momentum.
USD/CAD: A 4H Technical and Fundamental AnalysisUSD/CAD: A 4H Technical and Fundamental Analysis
Technical Insight:
The USD has recently weakened, reaching a two-week low against the CAD—a move driven largely by mounting U.S. fiscal concerns.
On the USD/CAD 4-hour time frame, we observed a minor key resistance at 1.3900 and support at 1.3850, the latter of which has already been broken. Following the breakout, price has entered a post-breakout accumulation phase—a typical institutional behavior where orders are layered before a decisive move.
Currently, price appears to be hunting for liquidity—a common market dynamic where early breakout traders are flushed out. There are two zones of interest:
1️⃣ First liquidity pool just above the broken support
2️⃣ Final liquidity pool above key resistance at 1.3900
Should price trigger the second zone, it could present a more strategic area for market participants to reassess positioning based on a favorable risk-reward structure.
📍 Area of Interest (AOI):
The area of interest lies around 1.38830, just below the key resistance and close to the potential liquidity sweep zone. This zone becomes relevant if price hunts the liquidity above the recent high (1.3900) and shows signs of rejection or exhaustion.
🛡 Risk Perspective (Stop-Loss Idea):
From a risk management viewpoint, institutional traders would likely place invalidation levels just above 1.39180, which sits beyond the anticipated liquidity sweep and is considered the upper bound of the stop hunt zone.
🎯 Profit Perspective (Target Idea):
A reasonable profit zone, based on structure, could be placed near the next minor support around 1.38180, where price last found buying interest prior to the breakout.
Fundamental Overview:
Credit Downgrade: Moody’s has downgraded the U.S. credit outlook, raising alarm over rising national debt and fiscal indiscipline.
Treasury Weakness: A poorly received 20-year Treasury auction signals waning investor confidence, pushing yields higher.
Shift in Sentiment: As uncertainty grows, capital is flowing into alternative assets like Bitcoin and gold, both hitting fresh highs—an indication of reduced trust in the dollar’s safe-haven status.
On the flip side, the Canadian dollar (CAD) continues to gain ground:
📈 Why the Loonie Is Rising:
Political Stability: With Mark Carney stepping in post-Trudeau, investor confidence has strengthened amid expectations of prudent fiscal management.
Steady Monetary Policy: The Bank of Canada is expected to maintain current interest rates, reinforcing CAD's appeal.
Stronger Trade Outlook: Ongoing efforts to diversify trade and resolve disputes have contributed to CAD resilience.
📌 Disclaimer:
This is not financial advice. As always, wait for proper confirmation before executing trades. Manage your risk wisely and trade what you see, not what you feel.

USDCAD - Potential SellHi Traders,
Here is my view on this pair.
BIAS: SELL
Logical Analysis:
It looks like that we are at a reversal level. The SELLER is giving a good discount on this pair. I believe he found some business with some buyers at around 1.3800 level.
Price is now at a level where buyers were not interested.
Is the SELLER giving another discount?
Technical Analysis: See chart
Entry: Up to you
Good Luck

USDCAD What Next? BUY!
My dear friends,
My technical analysis for USDCAD is below:
The market is trading on 1.3934 pivot level.
Bias - Bullish
Technical Indicators: Both Super Trend & Pivot HL indicate a highly probable Bullish continuation.
Target - 1.3958
About Used Indicators:
A pivot point is a technical analysis indicator, or calculations, used to determine the overall trend of the market over different time frames.
Disclosure: I am part of Trade Nation's Influencer program and receive a monthly fee for using their TradingView charts in my analysis.
———————————
WISH YOU ALL LUCK

Heading into 50% Fibonacci resistance>The Loonie (USD/CAD) is rising towards the pivot, which has been identified as an overlap resistance and could reverse to the pullback support.
Pivot: 1.3904
1st Support: 1.3781
1st Resistance: 1.3988
Risk Warning:
Trading Forex and CFDs carries a high level of risk to your capital and you should only trade with money you can afford to lose. Trading Forex and CFDs may not be suitable for all investors, so please ensure that you fully understand the risks involved and seek independent advice if necessary.
Disclaimer:
The above opinions given constitute general market commentary, and do not constitute the opinion or advice of IC Markets or any form of personal or investment advice.
Any opinions, news, research, analyses, prices, other information, or links to third-party sites contained on this website are provided on an "as-is" basis, are intended only to be informative, is not an advice nor a recommendation, nor research, or a record of our trading prices, or an offer of, or solicitation for a transaction in any financial instrument and thus should not be treated as such. The information provided does not involve any specific investment objectives, financial situation and needs of any specific person who may receive it. Please be aware, that past performance is not a reliable indicator of future performance and/or results. Past Performance or Forward-looking scenarios based upon the reasonable beliefs of the third-party provider are not a guarantee of future performance. Actual results may differ materially from those anticipated in forward-looking or past performance statements. IC Markets makes no representation or warranty and assumes no liability as to the accuracy or completeness of the information provided, nor any loss arising from any investment based on a recommendation, forecast or any information supplied by any third-party.

Bearish reversal for the Loonie?The price is rising towards the resistance level which is an overlap resistance that is slightly above the 38.2% Fibonacci retracement and could reverse from this level to our take profit.
Entry: 1.3904
Why we like it:
There is an overlap resistance level that is slightly above the 38.2% Fibonacci retracement.
Stop loss: 1.4006
Why we like it:
There is a pullback resistance level.
Take profit: 1.3763
Why we like it:
There is a pullback support level.
Enjoying your TradingView experience? Review us!
Please be advised that the information presented on TradingView is provided to Vantage (‘Vantage Global Limited’, ‘we’) by a third-party provider (‘Everest Fortune Group’). Please be reminded that you are solely responsible for the trading decisions on your account. There is a very high degree of risk involved in trading. Any information and/or content is intended entirely for research, educational and informational purposes only and does not constitute investment or consultation advice or investment strategy. The information is not tailored to the investment needs of any specific person and therefore does not involve a consideration of any of the investment objectives, financial situation or needs of any viewer that may receive it. Kindly also note that past performance is not a reliable indicator of future results. Actual results may differ materially from those anticipated in forward-looking or past performance statements. We assume no liability as to the accuracy or completeness of any of the information and/or content provided herein and the Company cannot be held responsible for any omission, mistake nor for any loss or damage including without limitation to any loss of profit which may arise from reliance on any information supplied by Everest Fortune Group.

SLIGHT BUY ON THE USDCAD PAIRon this analysis, the USDCAD might have a slight pullback on the bullish side despite being bearish on a higher TF
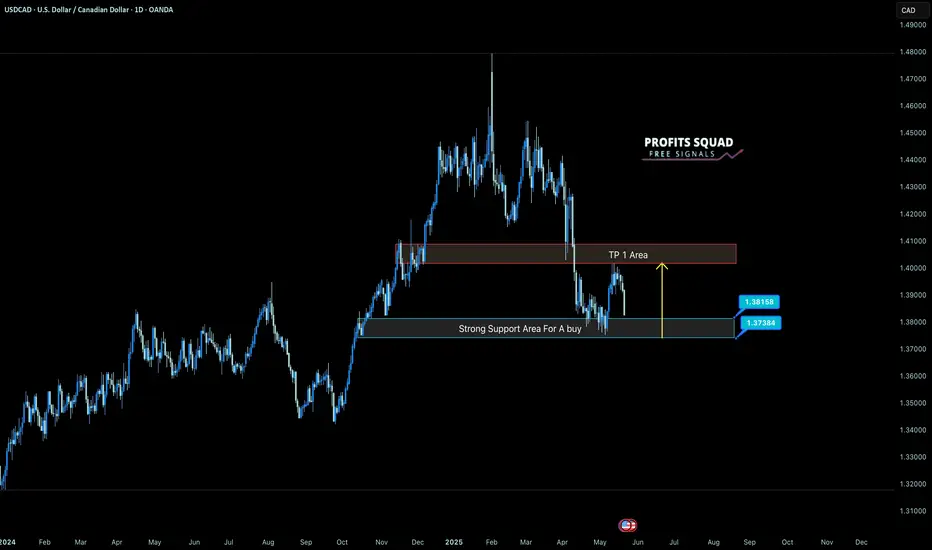
Buyers are expected to step in at this zone and drive price upI'm closely monitoring USD/CAD as it approaches a significant support zone between 1.3820 and 1.3740. This area has historically prompted bullish rebounds, and I anticipate that buyers will defend it.
With confirmation, I plan to enter a long position, placing a stop loss just below 1.3740 to manage risk. Initial targets might include the 1.3900 level, aligning with previous resistance. Then, we can expect the 1.40 area for full TP.
However, if the price breaks decisively below 1.3740, it would invalidate the bullish setup and suggest further downside.
USDCAD 1-hour Entry Summary of USDCAD Entry:
Entry: Sell in the area of 1.3880–1.3900 (pullback to EMA21/34)
Stop Loss: at 1.3930 (above swing high & EMA34)
Take Profit:
TP1: 1.3780 (intraday support)
TP2: 1.3740 (multi-day demand level)
