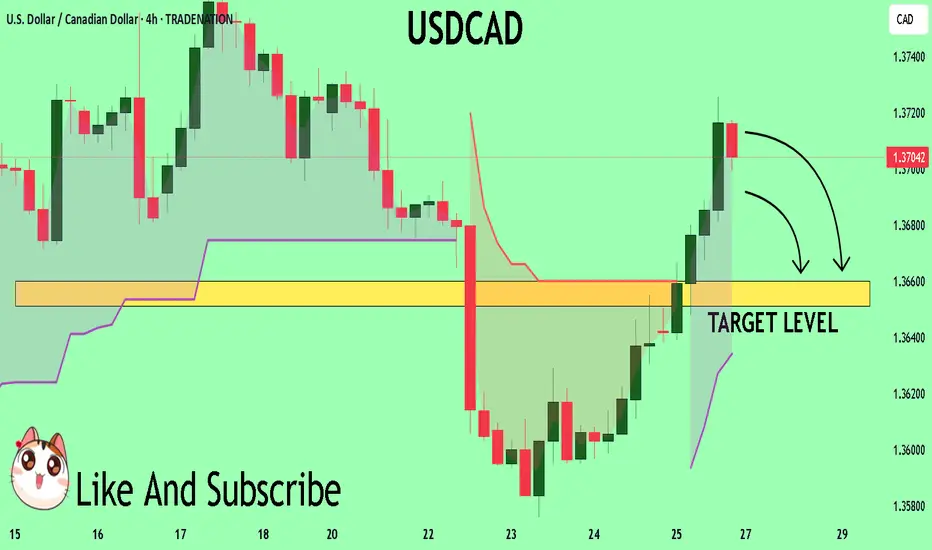
USDCADSupport Zone: Price has retested a strong support area
Price Action: The retest held — buyers defended it, showing rejection wicks / bullish candles.
Bias: Bullish while support holds → look for continuation to next resistance.
Invalidation: Bias weakens if support breaks and closes below the zone.
So as long as price stays above the retested support, USD/CAD remains bullish.
USDCAD trade ideas
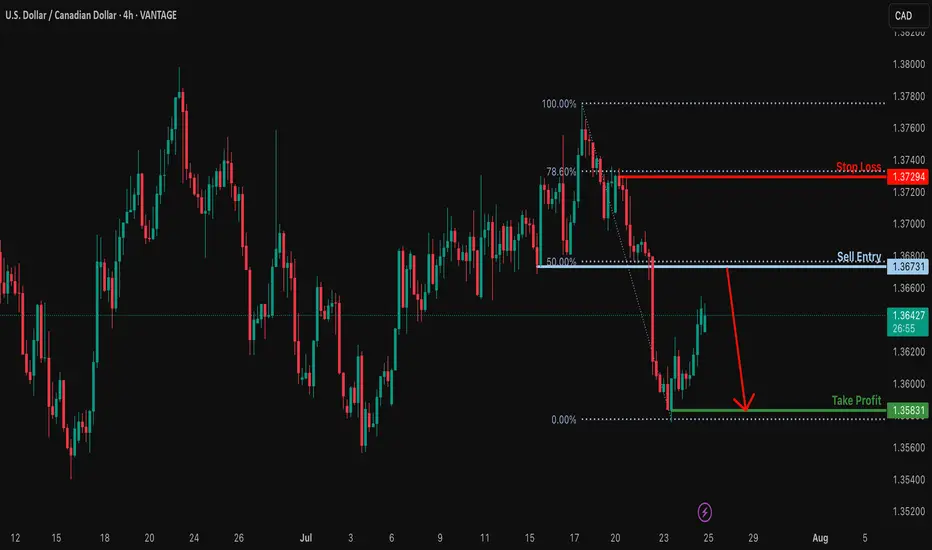
Heading into 50% Fibonacci resistance?USD/CAD is rising towards the resistance level, which serves as a pullback resistance that aligns with the 50% Fibonacci retracement and could reverse from this level to our take-profit target.
Entry: 1.3673
Why we like it:
There is a pullback resistance that lines up with the 50% Fibonacci retracement.
Stop loss: 1.3729
Why we like it:
There is a pullback resistance that lines up with the 78.6% Fibonacci retracement.
Take profit: 1.3583
Why we like it:
There is a swing low support.
Enjoying your TradingView experience? Review us!
Please be advised that the information presented on TradingView is provided to Vantage (‘Vantage Global Limited’, ‘we’) by a third-party provider (‘Everest Fortune Group’). Please be reminded that you are solely responsible for the trading decisions on your account. There is a very high degree of risk involved in trading. Any information and/or content is intended entirely for research, educational and informational purposes only and does not constitute investment or consultation advice or investment strategy. The information is not tailored to the investment needs of any specific person and therefore does not involve a consideration of any of the investment objectives, financial situation or needs of any viewer that may receive it. Kindly also note that past performance is not a reliable indicator of future results. Actual results may differ materially from those anticipated in forward-looking or past performance statements. We assume no liability as to the accuracy or completeness of any of the information and/or content provided herein and the Company cannot be held responsible for any omission, mistake nor for any loss or damage including without limitation to any loss of profit which may arise from reliance on any information supplied by Everest Fortune Group.
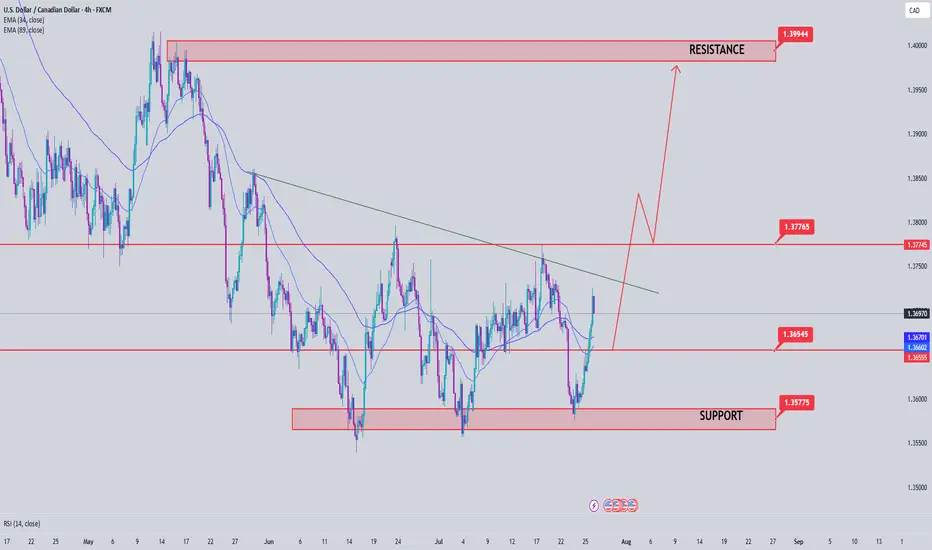
USD/ CAD Are We Heading to $1.46 Territory Watch OUT Afternoon Trading Family
Based on what we are seeing is a nice bullish run up to the following levels :
Levels To Watch For:
1) $1.39
2) $1.41
3) $1.43
4) $1.46
However be aware if we for whatever reason we sink back into the 1.35 territory then we could see a drop down to 1.34
Trade Smarter Live Better
Kris

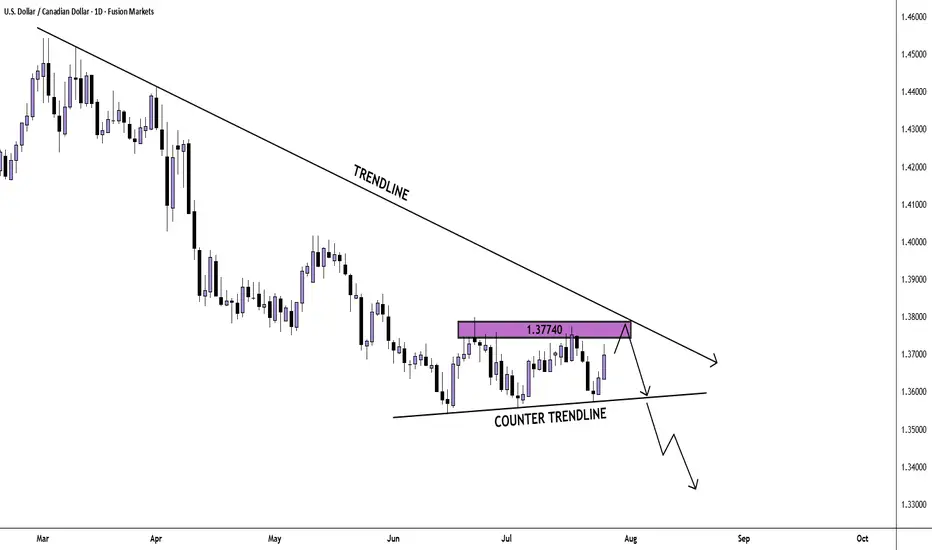
USD/CAD Ascending Triangle BreakoutUSD/CAD was hit hard during the Q2 sell-off in the USD. And with the almost decade long range still in-play for the pair, with the reversal around 1.4500 in February, that makes sense.
The problem quickly became sentiment as sellers jumped on the move so aggressively, and since mid-June bears have had trouble breaking down to any fresh lows.
We can even see an element of this from May, when prices found support at 1.3750 and sellers were suddenly stalled despite a clear downside trend.
This is a great illustration of why sentiment is so important - if anyone that wants to sell or that can sell the pair already has - even the worst news in the world would have trouble pushing fresh lows. Because if there's no supply coming into the market and there's more demand, well, then prices will go up just given basic supply/demand dynamics. And with a heavy built in short position following a clean downside trend, there will be some sellers looking to take profit which is what generates the start of that demand. And then more shorts will be motivated to take profit as they see price rising even with negative news flow, when prices should be falling.
This can continue all the way until we get to a point that is attractive again to draw fresh sellers into the market and in USD/CAD, that was the 1.4000 handle that held a clean show of resistance in mid-May, and that ushered in another wave of selling. But in mid-June, as price got close to the 1.3500 handle, a similar type of thing started to happen as sellers began to shy away from chasing the move.
Initially that allowed for pullback to that same 1.3750 level that was support in May. Sellers took another shot and even as the USD was setting fresh three-year-lows on the first day of Q3, USD/CAD was setting a higher-low above the prior swing. The trendline produced from those two lows came into play just last week - and when combined with the 1.3750 level made for a textbook ascending triangle formation.
Those setups are often tracked with aim of bullish breakout as it's essentially showing a line in the sand that sellers have defended, in this case at 1.3750; but there's a diminishing impact of that resistance as shown from the increasingly higher-lows. The thought is that, eventually, sellers will give way to the buyers that have been defending higher-lows and that will lead to a breakout and fresh highs.
This is what's taking place now in USD/CAD.
This doesn't necessarily mean that bears are done for, as the big question here is the same from back in May, whether we get to a resistance level that's appealing enough to draw fresh shorts into the market. From the chart attached, I've outlined three areas of interest for such, with 1.3900 nearby and 1.4000 above that. If we do see a prolonged push of USD-strength, there's a zone of support-turned-resistance around 1.4151-1.4178 that becomes of interest for bigger-picture scenarios. - js

Buy usdcadStrong buyers coming now
Weekly pin rejection
Monthly oversold pair
Daily trend already breaks
USD/CAD Eyes Breakout Above 1.38 as Weekly MACD Flashes BullishUSD/CAD Eyes Breakout Above 1.38 as Weekly MACD Flashes Bullish Signal
USD/CAD Weekly Technical Outlook
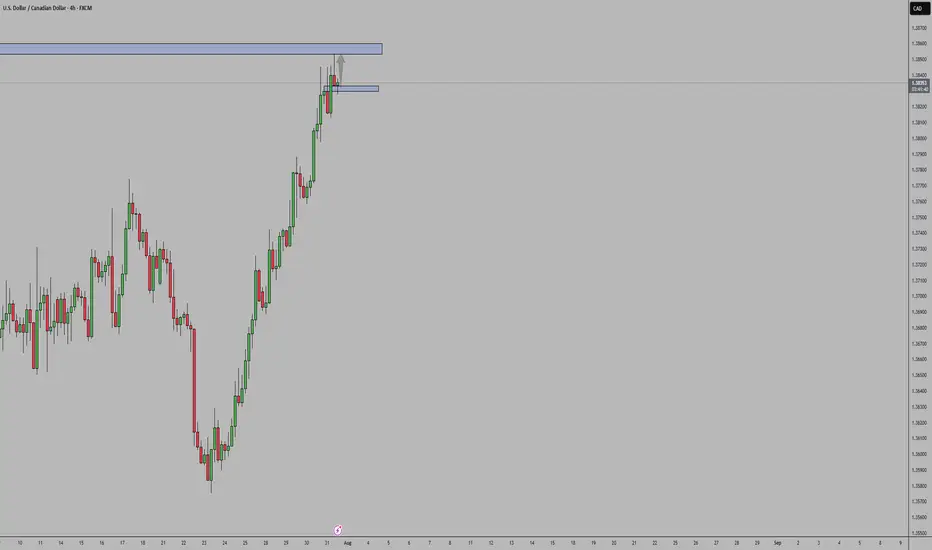
The pair is approaching a key resistance zone around 1.3800 . A weekly close above this level could signal a push toward the 1.4000 handle, opening the door for a longer-term bullish breakout and potential buy-and-hold scenario.
From the downside, a break below 1.3500 would likely trigger Canadian dollar strength, possibly driving the pair much lower.
MACD Confirmation:
The weekly MACD is crossing above the histogram from below, which is typically a bullish momentum signal. This supports the idea of a developing uptrend and could mark the beginning of a sustained move higher—especially if accompanied by strong volume.
Fundamental Backdrop:
The recent surge in U.S. Treasury demand reflects heightened risk-off sentiment and USD strength, which may continue to support the upside in USD/CAD in the near term.

USDCAD short move
Price is currently at a support level and if there should be a break then i will be expecting more downward movement in price.

USDCAD Analysis week 31🌐Fundamental Analysis
The Canadian dollar continued to decline against the US dollar on Friday. Trump returned to threatening tariffs on Canada as trade deals remain limited. The August 1 deadline for tariffs is approaching and Canada has not made much of a move so far.
🕯Technical Analysis
USDCAD continues to rally towards the 1.4000 resistance zone. A recovery of the pair to 1.365 is a good momentum for USDCAD to break the trendline and break 1.37700. The trading strategy for next week is mainly to look for BUY points when there is a recovery of the wave structure. If the important support of the week 1.357 is broken, the uptrend will reverse.
📈📉Trading Signals
BUY USDCAD 1.365-1.363 Stoploss 1.360
BUY Break out 1.37700
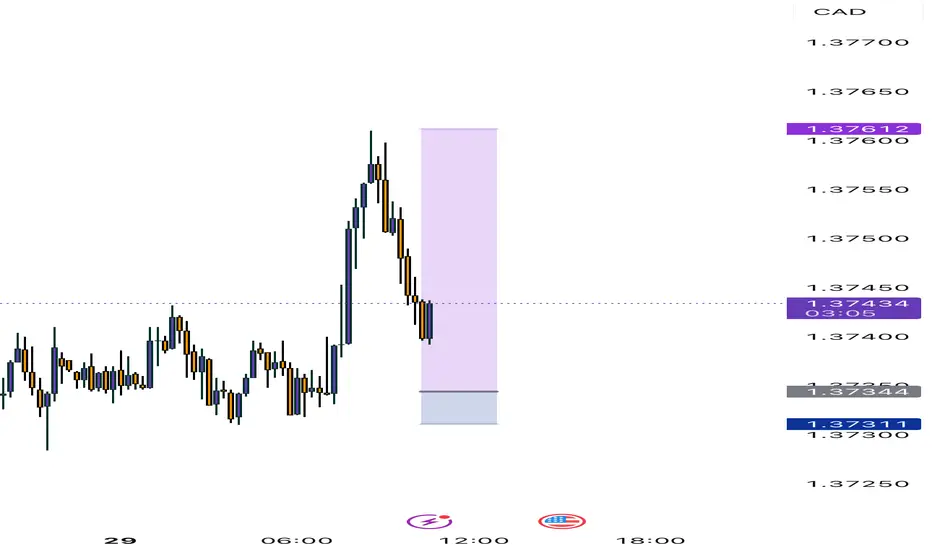

USDCAD 1H buyHello friends. If the price in USDCAD returns to the specified area on the 1h timeframe, it is suitable for a buy position.
This is just a theory

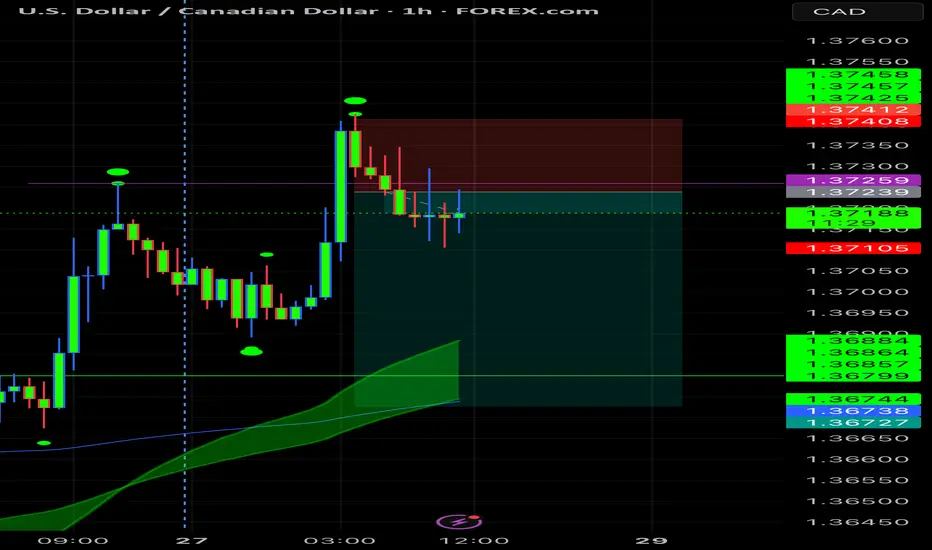
USDCAD SELLUSD/CAD rallies to 1.3680 as the market focuses on a hawkish Fed
The US Dollar extends its recovery for the second consecutive day, supported by strong US data. Upbeat US business activity and Jobless Claims support the Fed's "wait and see" rhetoric. In Canada, the weak Retail Sales data keep hopes for a BoC rate cut alive.
The year will be politically marked by Trump’s return to the White House. A Republican government is seen as positive for financial markets, but Trump’s pledge to cut taxes and impose tariffs on foreign goods and services may introduce uncertainty to both the political and economic landscape.
Canada’s political crisis peaked in late 2024 with a no-confidence vote against Prime Minister Justin Trudeau, leading to snap elections and a weakened Liberal minority government. Policy uncertainty and economic challenges dominate 2025’s outlook, raising concerns over market stability and investor confidence.
The BoC is set to continue easing interest rates through 2025, at least at a faster pace than the Fed is expected to, which could apply pressure on CAD’s already-rising rate differential.
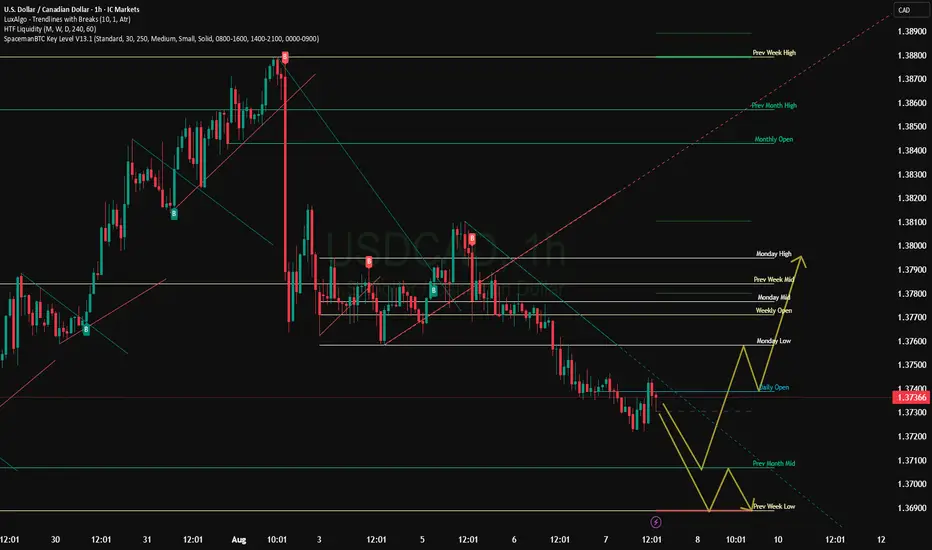
SUPPORT 1.36991
SUPPORT 1.36739
SUPPORT 1.36495
RESISTANCE 1.37346
RESISTANCE 1.37455

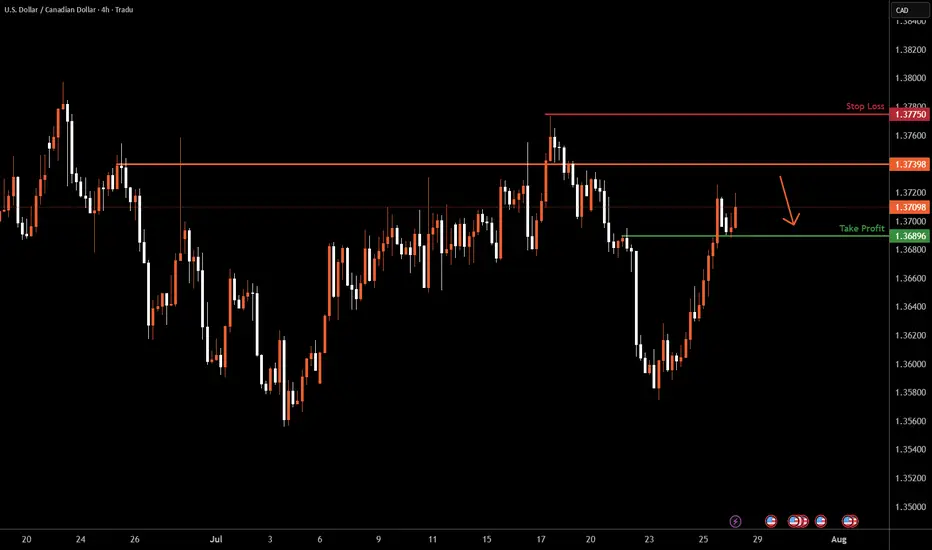
USDCAD H4 I Bearish Reversal OffBased on the H4 chart analysis, we can see that the price is rising toward our sell entry at 1.3739, which is a pullback resistance.
Our take profit will be at 1.3689, an overlap support level.
The stop loss will be placed at 1.3775, the swing-high resistance level.
High Risk Investment Warning
Trading Forex/CFDs on margin carries a high level of risk and may not be suitable for all investors. Leverage can work against you.
Stratos Markets Limited (tradu.com ):
CFDs are complex instruments and come with a high risk of losing money rapidly due to leverage. 66% of retail investor accounts lose money when trading CFDs with this provider. You should consider whether you understand how CFDs work and whether you can afford to take the high risk of losing your money.
Stratos Europe Ltd (tradu.com ):
CFDs are complex instruments and come with a high risk of losing money rapidly due to leverage. 66% of retail investor accounts lose money when trading CFDs with this provider. You should consider whether you understand how CFDs work and whether you can afford to take the high risk of losing your money.
Stratos Global LLC (tradu.com ):
Losses can exceed deposits.
Please be advised that the information presented on TradingView is provided to Tradu (‘Company’, ‘we’) by a third-party provider (‘TFA Global Pte Ltd’). Please be reminded that you are solely responsible for the trading decisions on your account. There is a very high degree of risk involved in trading. Any information and/or content is intended entirely for research, educational and informational purposes only and does not constitute investment or consultation advice or investment strategy. The information is not tailored to the investment needs of any specific person and therefore does not involve a consideration of any of the investment objectives, financial situation or needs of any viewer that may receive it. Kindly also note that past performance is not a reliable indicator of future results. Actual results may differ materially from those anticipated in forward-looking or past performance statements. We assume no liability as to the accuracy or completeness of any of the information and/or content provided herein and the Company cannot be held responsible for any omission, mistake nor for any loss or damage including without limitation to any loss of profit which may arise from reliance on any information supplied by TFA Global Pte Ltd.
The speaker(s) is neither an employee, agent nor representative of Tradu and is therefore acting independently. The opinions given are their own, constitute general market commentary, and do not constitute the opinion or advice of Tradu or any form of personal or investment advice. Tradu neither endorses nor guarantees offerings of third-party speakers, nor is Tradu responsible for the content, veracity or opinions of third-party speakers, presenters or participants.
USDCAD Buyers In Panic! SELL!
My dear subscribers,
This is my opinion on the USDCAD next move:
The instrument tests an important psychological level 1.3704
Bias - Bearish
Technical Indicators: Supper Trend gives a precise Bearish signal, while Pivot Point HL predicts price changes and potential reversals in the market.
Target - 1.3660
About Used Indicators:
On the subsequent day, trading above the pivot point is thought to indicate ongoing bullish sentiment, while trading below the pivot point indicates bearish sentiment.
Disclosure: I am part of Trade Nation's Influencer program and receive a monthly fee for using their TradingView charts in my analysis.
———————————
WISH YOU ALL LUCK
USD/CAD Daily Chart AnalysisFrom the bigger picture we see that sellers are dominating the market. Currently, price looks to be in a correction phase and twice has found resistance at the 1.37740 price point.
If price finds resistance there again, we may see a breakout and another bearish impulse.
If you agree with this analysis, look for a trade that meets your strategy rules.
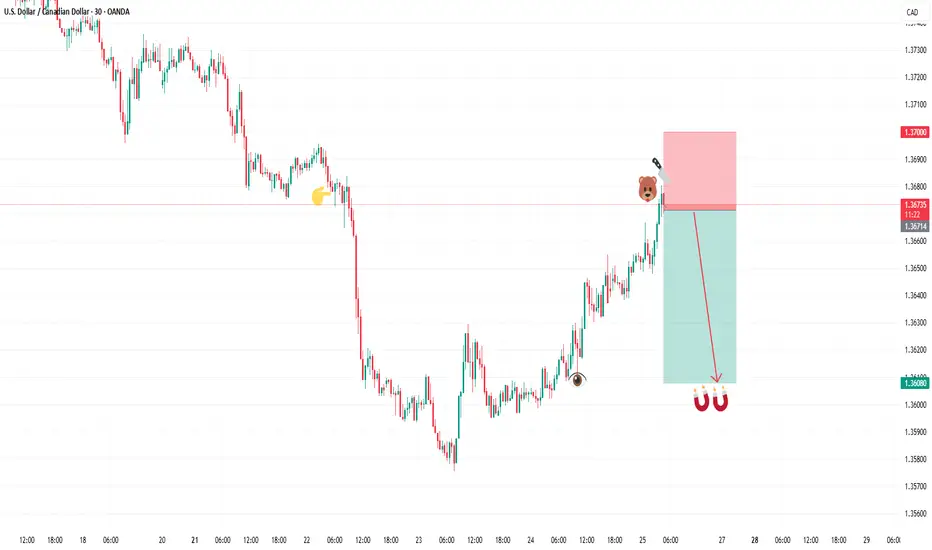
SELL USDCADIn todays session we are monitoring USDCAD for selling opportunities, we have our first entry at 1.36719 and our target is 1.36080 our stop is above 1.3700 , use proper risk management and risk what you can afford. Cheers fam.
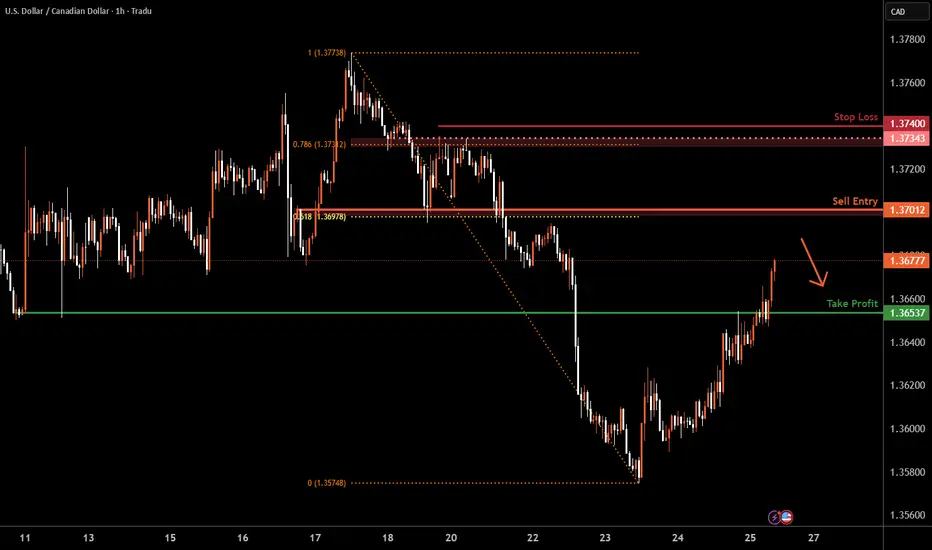
USD/CAD H4 | Potential bearish reversalUSD/CAD is rising towards an overlap resistance and could potentially reverse off this level to drop lower.
Sell entry is at 1.3701 which is an overlap resistance that aligns with the 61.8% Fibonacci retracement.
Stop loss is at 1.3740 which is a level that sits above the 78.6% Fibonacci retracement and an overlap resistance.
Take profit is at 1.3653 which is a pullback support.
High Risk Investment Warning
Trading Forex/CFDs on margin carries a high level of risk and may not be suitable for all investors. Leverage can work against you.
Stratos Markets Limited (tradu.com ):
CFDs are complex instruments and come with a high risk of losing money rapidly due to leverage. 66% of retail investor accounts lose money when trading CFDs with this provider. You should consider whether you understand how CFDs work and whether you can afford to take the high risk of losing your money.
Stratos Europe Ltd (tradu.com ):
CFDs are complex instruments and come with a high risk of losing money rapidly due to leverage. 66% of retail investor accounts lose money when trading CFDs with this provider. You should consider whether you understand how CFDs work and whether you can afford to take the high risk of losing your money.
Stratos Global LLC (tradu.com ):
Losses can exceed deposits.
Please be advised that the information presented on TradingView is provided to Tradu (‘Company’, ‘we’) by a third-party provider (‘TFA Global Pte Ltd’). Please be reminded that you are solely responsible for the trading decisions on your account. There is a very high degree of risk involved in trading. Any information and/or content is intended entirely for research, educational and informational purposes only and does not constitute investment or consultation advice or investment strategy. The information is not tailored to the investment needs of any specific person and therefore does not involve a consideration of any of the investment objectives, financial situation or needs of any viewer that may receive it. Kindly also note that past performance is not a reliable indicator of future results. Actual results may differ materially from those anticipated in forward-looking or past performance statements. We assume no liability as to the accuracy or completeness of any of the information and/or content provided herein and the Company cannot be held responsible for any omission, mistake nor for any loss or damage including without limitation to any loss of profit which may arise from reliance on any information supplied by TFA Global Pte Ltd.
The speaker(s) is neither an employee, agent nor representative of Tradu and is therefore acting independently. The opinions given are their own, constitute general market commentary, and do not constitute the opinion or advice of Tradu or any form of personal or investment advice. Tradu neither endorses nor guarantees offerings of third-party speakers, nor is Tradu responsible for the content, veracity or opinions of third-party speakers, presenters or participants.
USDCAD Break the trendline resistance USDCAD has brokend the trendline resistance is likely to to go next resistance as shown in the chart. The set up is valid till the uptrend trendline is respected by the price.

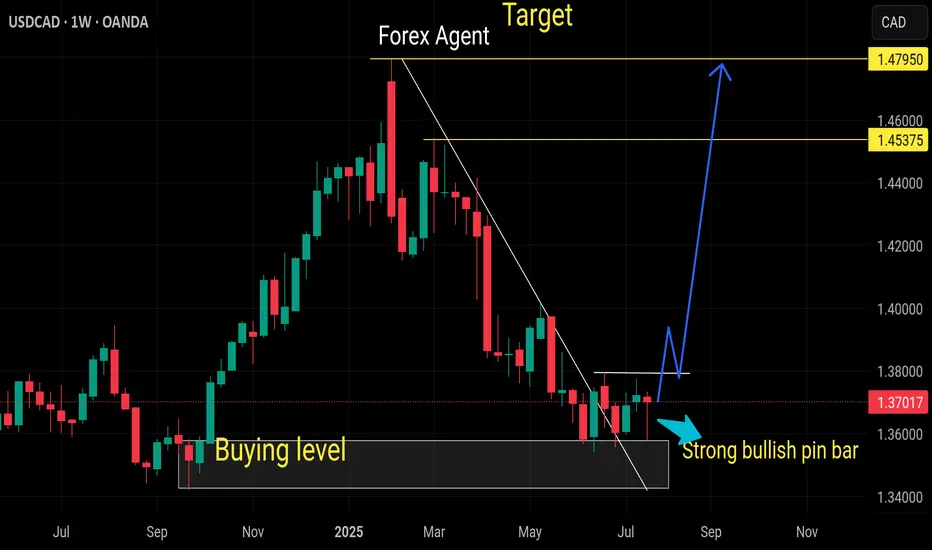
USDCAD BULLISH Technically:
Printing HH and HL
Bullish divergence
Resistance became support
Fib Retacment 0.5
Respecting Trendline support


USD/CAD – Watchlist UpdateWe were watching USD/CAD for a possible pullback and long setup earlier this week. While we did get an engulfing candle, momentum was not strong enough to justify a trade — especially considering the subpar support/resistance zone.
Now, the market appears to be shifting direction, possibly forming a pullback into a stronger resistance zone that could set up a downtrend continuation.
We’ll continue to wait and watch with patience, only considering this a valid opportunity if all components of the VMS strategy align.
📌 Let the setup come to you. No alignment, no trade.

USDCAD - Big Picture and MomentumBig Picture and Momentum
USD/CAD is trading comfortably above the 50-day EMA (~1.3728) and above the 9-day EMA, indicating continued bullish momentum. The 14-day RSI is above the 50 level, confirming the positive market sentiment.
Key Support and Resistance
Resistance: 1.3770–1.3798 range is the current target, a break of which could open the way to the January high around 1.4016.
Support:
50-day EMA (~1.3728) is the first line of defense.
Next is the 9-day EMA (~1.3679).
A further weakening could see a decline to 1.3560, and a strong correction could see a decline to the February 2024 lows (~1.3420).
Market Behavior Scenarios
Bullish scenario: holding above EMA with RSI > 50 creates good conditions for a move up to 1.3770-1.3800, and then to 1.4016, with increasing momentum.
Bearish scenario: falling below EMA, especially below 1.3679, can lead to a deeper decline - to 1.3560 and then to 1.3420.
Recommendations for traders
Long position: can be considered for entry when holding above 1.3728, with a target of 1.3770-1.3800, and a stop just below the EMA.
Short position: justified when falling below 1.3728-1.3679, with a target of 1.3560, and a stop just above the EMA level.