USDCAD LONG DAILY FORECAST Q3 D8 W28 Y25USDCAD LONG DAILY FORECAST Q3 D8 W28 Y25
Professional Risk Managers👋
Welcome back to another FRGNT chart update📈
Diving into some Forex setups using predominantly higher time frame order blocks alongside confirmation breaks of structure.
Let’s see what price action is telling us today! 👀
💡Here are some trade confluences📝
✅Daily Order block identified
✅4H Order Block identified
✅1H Order Block identified
🔑 Remember, to participate in trading comes always with a degree of risk, therefore as professional risk managers it remains vital that we stick to our risk management plan as well as our trading strategies.
📈The rest, we leave to the balance of probabilities.
💡Fail to plan. Plan to fail.
🏆It has always been that simple.
❤️Good luck with your trading journey, I shall see you at the very top.
🎯Trade consistent, FRGNT X
USDCAD trade ideas

Potential bearish drop?The Loonie (USD/CAD) has rejected off the pivot, which has been identified as an overlap resistance and could drop to the 61.8% Fibonacci support.
Pivot: 1.3688
1st Support: 1.3599
1st Resistance: 1.3743
Risk Warning:
Trading Forex and CFDs carries a high level of risk to your capital and you should only trade with money you can afford to lose. Trading Forex and CFDs may not be suitable for all investors, so please ensure that you fully understand the risks involved and seek independent advice if necessary.
Disclaimer:
The above opinions given constitute general market commentary, and do not constitute the opinion or advice of IC Markets or any form of personal or investment advice.
Any opinions, news, research, analyses, prices, other information, or links to third-party sites contained on this website are provided on an "as-is" basis, are intended only to be informative, is not an advice nor a recommendation, nor research, or a record of our trading prices, or an offer of, or solicitation for a transaction in any financial instrument and thus should not be treated as such. The information provided does not involve any specific investment objectives, financial situation and needs of any specific person who may receive it. Please be aware, that past performance is not a reliable indicator of future performance and/or results. Past Performance or Forward-looking scenarios based upon the reasonable beliefs of the third-party provider are not a guarantee of future performance. Actual results may differ materially from those anticipated in forward-looking or past performance statements. IC Markets makes no representation or warranty and assumes no liability as to the accuracy or completeness of the information provided, nor any loss arising from any investment based on a recommendation, forecast or any information supplied by any third-party.

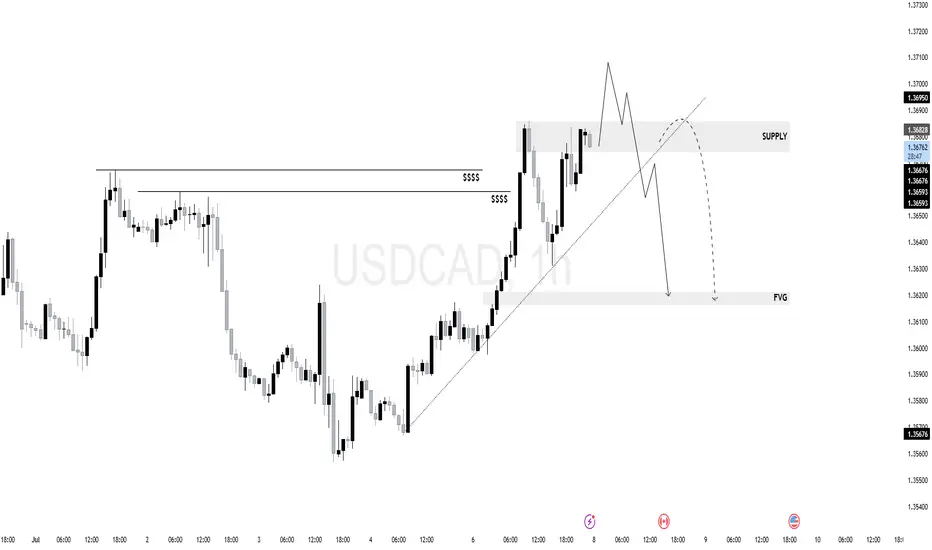
$UC (USDCAD) 1H Liquidity has been swept. Supply has been met.
The price entered a previously established supply area (1.36950–1.36700) and showed early signs of rejection
The break of the short-term trendline coupled with price failing to hold above the highs could signal a shift in structure toward a bearish leg.
If the rejection confirms, price is likely to seek rebalancing at the FVG below (1.36200–1.36000 zone).
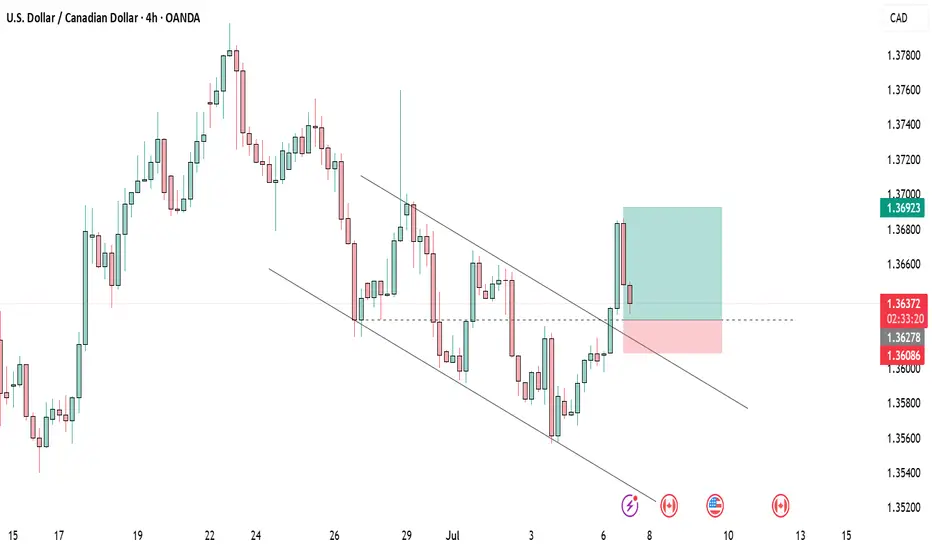
USDCAD buyThe USDCAD 4-hour chart shows a potential long setup, but it comes with increased risk. Price has recently broken above a key resistance-turned-support level and is now pulling back for a possible retest. This could trigger a bullish continuation, especially with the 50 EMA now below price, supporting upward momentum.
However, the setup is riskier because the breakout is still fresh, and there's a chance price could dip back below the support zone.

Potential Long Position on USDCADReasons I think this pair will rise:
- Confirmed trend line means harder breakout potential.
- Price printed a double bottom.
- Bullish RSI divergence on H4
- RSI oversold on H4
What do you think?

USDCAD Potential UpsidesHey Traders, in tomorrow's trading session we are monitoring USDCAD for a buying opportunity around 1.35750 zone, USDCAD is trading in an uptrend and currently is in a correction phase in which it is approaching the trend at 1.35750 support and resistance area.
Trade safe, Joe.

USDCAD LONG DAILY FORECAST Q3 W28 Y25USDCAD LONG DAILY FORECAST Q3 W28 Y25
Professional Risk Managers👋
Welcome back to another FRGNT chart update📈
Diving into some Forex setups using predominantly higher time frame order blocks alongside confirmation breaks of structure.
Let’s see what price action is telling us today! 👀
💡Here are some trade confluences📝
✅Daily Order block identified
✅4H Order Block identified
✅1H Order Block identified
🔑 Remember, to participate in trading comes always with a degree of risk, therefore as professional risk managers it remains vital that we stick to our risk management plan as well as our trading strategies.
📈The rest, we leave to the balance of probabilities.
💡Fail to plan. Plan to fail.
🏆It has always been that simple.
❤️Good luck with your trading journey, I shall see you at the very top.
🎯Trade consistent, FRGNT X
Buy USDCADUSDCAD falling channel breakout on display. Price broke upwards with strong bullish momentum, and has since been reversing for the past few hours. Soon, the bulls will continue
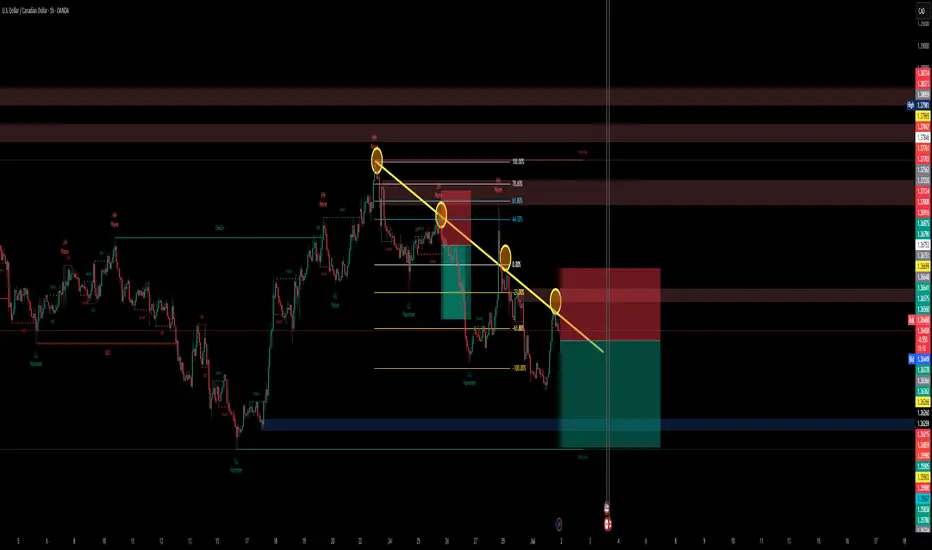
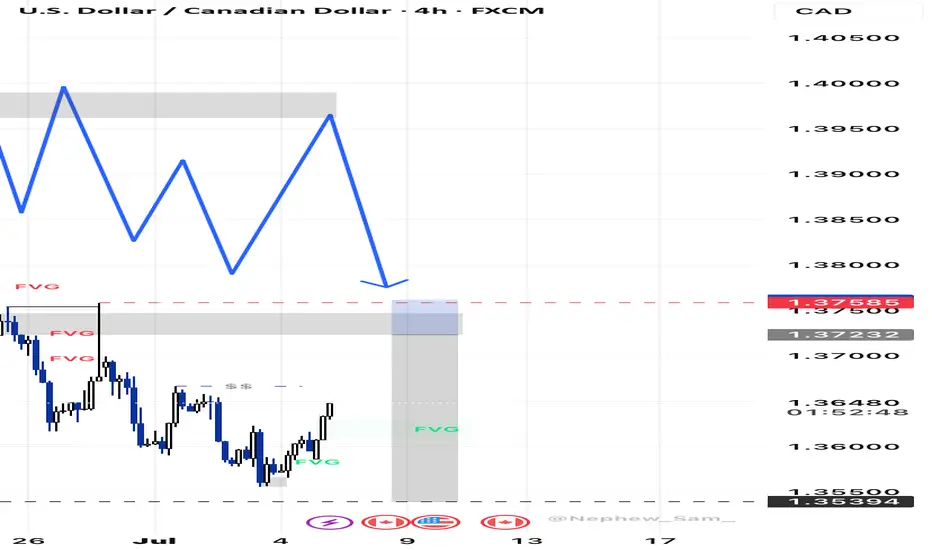
USD /CAD) bearish reversal analysis Read The captionSMC trading point update
Technical analysis of USD/CAD pair on the 2-hour timeframe, suggesting that the price is likely to drop toward the support zone. Here's the detailed idea behind the analysis:
---
Chart Breakdown (2H – USD/CAD)
1. Resistance Zone (Yellow Box - Top):
Marked as a strong supply area where price has repeatedly been rejected (highlighted by red arrows).
Acts as a key zone where sellers are in control.
Also aligns with a descending trendline, reinforcing bearish pressure.
2. Support Zone (Yellow Box - Bottom):
This is the target point marked at 1.35387, which previously served as a demand zone.
The chart suggests this level as the next significant area where price might find buyers.
3. Trend Context:
Price is moving within a descending channel (black trendlines), confirming the overall downtrend.
The 200 EMA (1.36834) is acting as dynamic resistance, keeping price under pressure.
4. Projected Move (Blue Box):
Shows a potential drop of ~91 pips toward the support level.
A bearish wave is anticipated as per the black zigzag line on the chart.
5. RSI Indicator:
RSI is near neutral (49.02 and 49.70) — suggesting no overbought/oversold conditions, but confirming lack of bullish momentum.
RSI is aligned with price trending down.
Mr SMC Trading point
---
Summary:
Bias: Bearish
Entry Zone: Near current price or minor pullback (1.364–1.365)
Target: 1.35387 (support zone)
Invalidation: Break and close above resistance level / 200 EMA (~1.3685)
Trend: Downtrend within channel
---
Please support boost 🚀 analysis)

USDCAD BULLISH OR BEARISH DETAILED ANALYSISUSDCAD has just completed a clean falling wedge breakout—a classic bullish reversal pattern often signaling trend exhaustion. After months of consistent lower highs and lower lows within a well-defined wedge, price has now broken decisively above the descending resistance. The current price sits around 1.367, and we are confidently targeting the 1.407 level in the coming weeks. This breakout aligns perfectly with the seasonal USD strength historically seen in Q3, especially following soft Canadian economic data.
From a fundamental perspective, the Canadian dollar is facing downside pressure amid falling crude oil prices and softening domestic data. Canada’s most recent GDP growth came in below expectations, raising concerns around economic resilience. Meanwhile, the Bank of Canada is expected to remain dovish with growing speculation of another rate cut in the next quarter. In contrast, the US dollar has been gaining traction following stronger-than-expected ISM services data and a better-than-anticipated ADP employment report, supporting the Fed’s “higher for longer” stance on interest rates.
Technically, the breakout is further supported by increasing bullish momentum and a break of market structure on lower timeframes. We’re seeing volume confirmation with this push, adding conviction that buyers are stepping in with strength. The risk-to-reward ratio remains highly favorable here, and any pullback into the 1.36 zone would provide an excellent re-entry opportunity for continuation.
With sentiment shifting in favor of USD bulls and oil-related weakness dragging CAD, USDCAD looks primed for a rally. The 1.407 target aligns with both key resistance levels and Fibonacci projections from the breakout structure. Momentum is with the bulls, and this setup has the potential to deliver solid profits as we head deeper into Q3.
US

Bullish Maple Syrup (USD/CAD)Setup
USD/CAD has broken below its long term uptrend line and is making lower lows while below the 30 week SMA, indicating a downtrend.
Signal
The daily chart shows a steep downtrend with RSI having twice been oversold at the May and June lows. However, on the most recent re-test of the lows RSI has held up. A double bottom pattern confirmed by a break back over 50 RSI could signal a more sustained bounce.

Uptrend The uptrend is expected to continue to the identified resistance levels. Then, based on the price behavior within this range, possible scenarios are identified.

USDCADTrend Reversal Structure + Lower High + Supply Zone Rejection
Key Confirmations:
1.Market Shift from Bullish to Bearish (Structure Break)
Price formed a Lower High (LH) after a Higher High (HH).
A clear Break of Structure (BOS) to the downside occurred (marked on the chart), indicating a shift in trend from bullish to bearish.
2.Trendline Respect + Rejection
A clean downward trendline is drawn connecting HH → LH → lower LH.
Price rejected perfectly from the trendline, confirming resistance and bearish momentum.
3.Supply Zone Rejection
Price action touches a previously tested supply zone (highlighted in red).
That zone acted as resistance, and price failed to break above.
4.Bearish Continuation Setup
After forming a Lower Low (LL), price pulls back to create another Lower High (LH) – classic bearish continuation pattern.
DOWN TREND CONTINUES Price has been in a downward trend, now experiencing a pull back into a higher time frame POI!
A clear uptrend to a Quasimodo entry type zone! MISSED ME ON THAPrice has been in a downward trend for a while. The lower time frame is experiencing a correction that will pick orders from the higher time frame POI and continue its downward trajectory

Bullish rise?The Loonie (USD/CAD) has bounced off the pivot which is a pullback support and could rise to the 1st resistance.
Pivot: 1.3570
1st Support: 1.3435
1st Resistance: 1.3732
Risk Warning:
Trading Forex and CFDs carries a high level of risk to your capital and you should only trade with money you can afford to lose. Trading Forex and CFDs may not be suitable for all investors, so please ensure that you fully understand the risks involved and seek independent advice if necessary.
Disclaimer:
The above opinions given constitute general market commentary, and do not constitute the opinion or advice of IC Markets or any form of personal or investment advice.
Any opinions, news, research, analyses, prices, other information, or links to third-party sites contained on this website are provided on an "as-is" basis, are intended only to be informative, is not an advice nor a recommendation, nor research, or a record of our trading prices, or an offer of, or solicitation for a transaction in any financial instrument and thus should not be treated as such. The information provided does not involve any specific investment objectives, financial situation and needs of any specific person who may receive it. Please be aware, that past performance is not a reliable indicator of future performance and/or results. Past Performance or Forward-looking scenarios based upon the reasonable beliefs of the third-party provider are not a guarantee of future performance. Actual results may differ materially from those anticipated in forward-looking or past performance statements. IC Markets makes no representation or warranty and assumes no liability as to the accuracy or completeness of the information provided, nor any loss arising from any investment based on a recommendation, forecast or any information supplied by any third-party.

Market Update - USDCAD 07/07/2025Well be looking at our market on the M15 Timeframe.
Market Updates At:
1. 7:00 am
2. 11:00 am
3. 03:00 pm
4. 07:00 pm

HARMONICS XABCDHello awesome traders! 👑✨
Let’s kick off the week with a USD/CAD 4-Hour chart — spotting a high-probability Harmonic XABCD Bullish reversal to ride higher.
🧠 Setup Breakdown
Pattern Type: Harmonic XABCD Bullish
X → A: Uptrend from 1.35399 → 1.37981
A → B: Correction down to 1.36179
B → C: Bounce up to 1.37598
C → D: Final leg down into 1.35567 completes the pattern
PCZ: Exact D-point at 1.3555–1.3565 (XABCD harmonic PRZ)
✅ Why This Works
Classic XABCD symmetry with precise Fibonacci ratios
PRZ confluence at D gives us a tight entry zone
4-hour price action shows clear rejection off D
⚔️ Entry & Risk Management
Entry Zone: Long within 1.3555–1.3565 (PRZ/PCZ)
Stop-Loss: Below X at 1.3535, ~10–15 pips under D
Risk: ≤ 1–2 % of account per trade
🎯 Target Zones
Target Zone 1: 61.8 %–78.6 % retracement of X→D → 1.3717–1.3760
Target Zone 2: 100 % extension of X→D → 1.3816
🔍 Confirmation & Invalid
Candlestick Rejection: Watch for bullish pin-bar or engulfing at D
Structure Break: Close back above the C→D trendline adds conviction
Invalidation: A decisive close below 1.3535 (below X & PRZ) negates the setup
💡 Keep It Simple:
Pattern → Identify XABCD Bullish
PRZ/PCZ → Wait for D completion zone
Trigger → Bullish price action at D
Continuation → Ride the move into your Target Zones
🔔 Monitor CAD data releases and BoC commentary for catalysts.
Wishing everyone a profitable week ahead — stay disciplined, manage risk, and let structure lead, not emotions! 🚀

Bearish reversal?USD/CAD is rising towards the resistance level which is an overlap resistance that lines up with the 50% Fibonacci retracement and the 145% Fibonacci extension and could reverse from this level to our take profit.
Entry: 1.3656
Why we like it:
There is an overlap resistance level that lines up with the 145% Fibonacci extension and the 50% Fibonacci retracement.
Stop loss: 1.3695
Why we like it:
There is a pullback resistance level that lines up with the 127.2% Fibonacci extension.
Take profit: 1.3618
Why we like it:
There is a pullback support level.
Enjoying your TradingView experience? Review us!
Please be advised that the information presented on TradingView is provided to Vantage (‘Vantage Global Limited’, ‘we’) by a third-party provider (‘Everest Fortune Group’). Please be reminded that you are solely responsible for the trading decisions on your account. There is a very high degree of risk involved in trading. Any information and/or content is intended entirely for research, educational and informational purposes only and does not constitute investment or consultation advice or investment strategy. The information is not tailored to the investment needs of any specific person and therefore does not involve a consideration of any of the investment objectives, financial situation or needs of any viewer that may receive it. Kindly also note that past performance is not a reliable indicator of future results. Actual results may differ materially from those anticipated in forward-looking or past performance statements. We assume no liability as to the accuracy or completeness of any of the information and/or content provided herein and the Company cannot be held responsible for any omission, mistake nor for any loss or damage including without limitation to any loss of profit which may arise from reliance on any information supplied by Everest Fortune Group.

USDCAD SetupMy own opinion on USDCAD this week, we should see a push to the upside. Make your own research before entering the trade ☺️

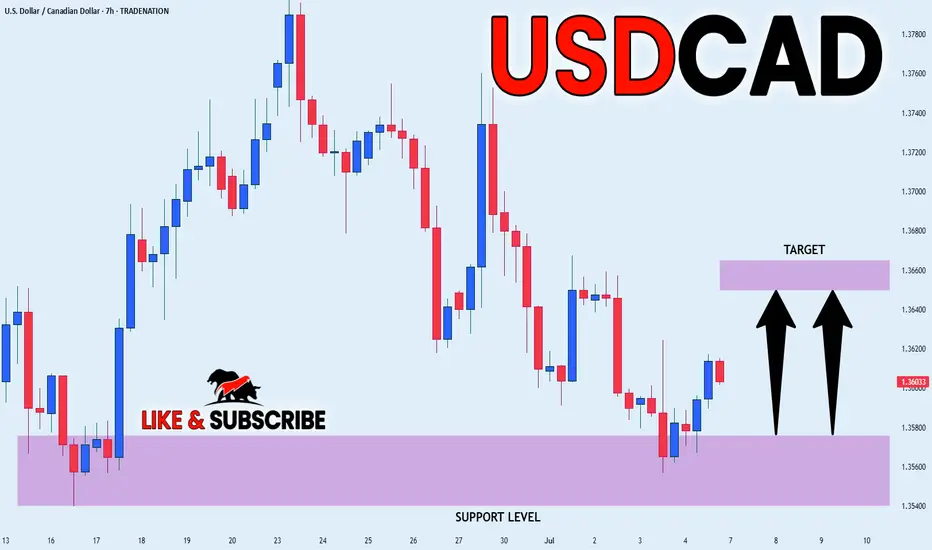
USD_CAD POTENTIAL LONG|
✅USD_CAD went down to retest
A horizontal support of 1.3560
Which makes me locally bullish biased
And I think that a move up
From the level is to be expected
Towards the target above at 1.3652
LONG🚀
✅Like and subscribe to never miss a new idea!✅
Disclosure: I am part of Trade Nation's Influencer program and receive a monthly fee for using their TradingView charts in my analysis.
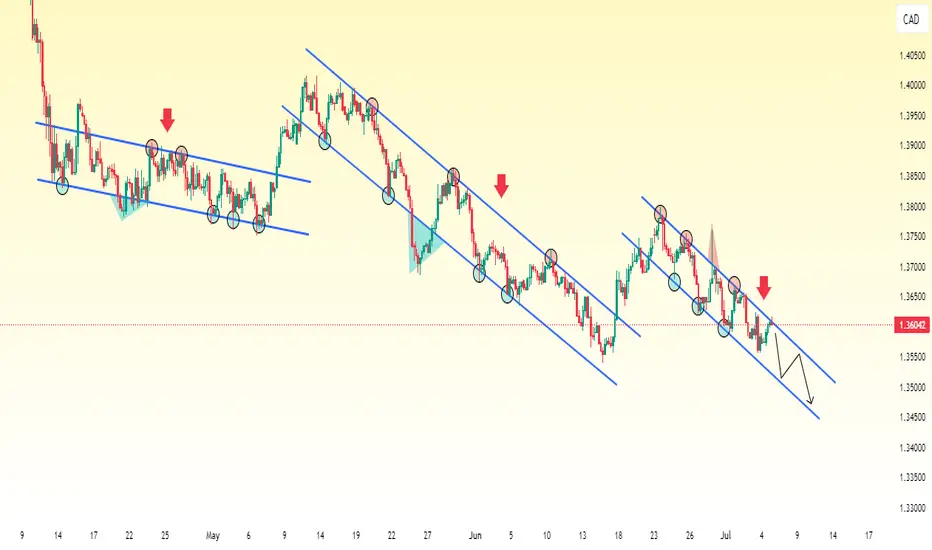
USD/CAD in a Strong Downtrend – Lower Channels Keep FormingUSD/CAD is currently in a strong bearish trend, forming a series of descending channels.
The price initially moved lower within a downward-sloping channel, then broke out to the upside, suggesting a reversal or deeper correction. However, this breakout was short-lived.
Instead of continuing higher, USD/CAD lost momentum and began forming a new descending channel, resuming its bearish movement. This pattern has repeated, each time the price breaks out upward, it quickly shifts back into a new downward channel, making lower lows each time.
This behavior indicates a bearish continuation structure, where temporary upward moves are corrective in nature and serve as setups for the next leg down. The consistent formation of new lower channels after brief pullbacks reflects ongoing selling pressure and trader sentiment favoring the downside.
USD-CAD Local Rebound! Buy!
Hello,Traders!
USD-CAD is trading in a
Strong downtrend but
The pair made a retest
Of the horizontal support
Level of 1.3540 from where
We are already seeing a
Bullish rebound and we
Will be expecting a
Further move up
Buy!
Comment and subscribe to help us grow!
Check out other forecasts below too!
Disclosure: I am part of Trade Nation's Influencer program and receive a monthly fee for using their TradingView charts in my analysis.
