BTC/USD Holds above $39k as BTC PriceFollowing the rejection at the $45,000 overhead resistance, Bitcoin’s (BTC) price has resumed selling pressure. The bears succeeded in breaking below the $41,800 support which resulted in the current downtrend. On the daily chart, the BTC price drops sharply below the moving averages, signaling the resumption of the downtrend. Today, the largest cryptocurrency has fallen to the low the $39,686. This is an important crucial support level to watch. The bears will attempt to break below the $39,000 support. On the other hand, the bulls will attempt to defend the current support to regain bullish momentum. On the downside, if the bears succeed in breaking below the $39,000 support BTC’s price will drop to $36,000 low. Similarly, if the support holds, buyers will attempt to push the crypto above the moving averages. If they succeed, Bitcoin could gradually rally toward $45,000 overhead resistance. Today, buyers and sellers are struggling above the $39,000 support as bulls push BTC price above the $40,000 psychological price level.
USDCBTC trade ideas

HORN OF THE UNICORNbears waiting for 30K and maybe 20K. prize ll be big if bitty bounce from the legs of the unicorn and climb to the golden horn.
not a trading advice. have fun.

$BTC #Bitcoin IH&S Golden CrossBullishly engulfing here with RSI breakout out on the 6HR as we enter the bullish control zone. Bitcoin has managed to hold its 45 degree trend here which keeps the bullish trend intact, with a golden cross as well. Ideally youd want to see the 200 heading upward as well but the context is right as we are above both and have backtested with confirmation. We've also got this inverse head and shoulders type pattern maturing, which would give you a measured move confluent with our upper zone, which is also confluent with the 1.618 of this initial rise cycle.

BTCUSD Buy SETUPAs you can see in the chart BTC is trying to break the reversal structure.
I will wait for the BO before buying BTC.

Repetitive Errors (2)Hi everyone,
Elliott Wave Principle (invalidation level) will help you by simply telling you that: chances are still in your favor.
Appendix

BTC May head back down.. I do not foresee BTC going higher.. I think longs will be/have been liquidated.. - we will head back down in the channel.. how low... who knows but I for sure am going to be buying at lower prices. Do share your views if you care to. Would be interesting to hear other thoughts.

btcusdtDemand supply range specified in the chart I hope you enjoy this analysis and come to the cartoon

liquidation levelsDemand supply range specified in the chart I hope you enjoy this analysis and come to the cartoon

liquidation poolDemand supply range specified in the chart I hope you enjoy this analysis and come to the cartoon

BTC - First Initial Capitulation Very Likely Over It took 3 months for btc to finally capitulate completely. I still expect btc to remain in this price area, maybe even set double or slightly lower bottom to really scare the last weak hands off. By now it is safe to say that 30k will hold for now. Like i sad many times now, expect some kind of an ABC retracement back into 55k zone. We could also just go into the retracement right from here but usually bottoms get re-tested, like we saw in the summer 2021.
As far as fib. retracement levels go, when ABC retracements come after initial rejection from the ATH, you typically see the A wave going near the 0.618 level and wave C going to 0.702 where we should expect massive rejection of some kind, taking us well below 30k.
Alt season is still expected during an ABC retracement of btc price.
I am not a financial advisor so non of this should be taken as a financial advice. Be well.
BINANCE:BTCUSDC

BTCUSD Daily Structure + Buy ZoneIf you are looking for which price you should buy or collect more BTC.
In this daily chart, I have shared for you guys so this is based on the daily chart's current structure.
Take care, everyone :)

btc chart Elliot wave analysisbtc chart Elliot wave analysis we are in a corrective wave and b to c wave target is round about 28500 and 29k

BTCUSDTGene Geldik Bir Btc dip formasyonu sonuna benim hedef işte bu YTD. Bakalım Sizde durum nedir.....

The cock and balls with massive divergenceThis is looking like it could get ugly soon unless BTC breaks key resistance. Only a matter or time before BTC busts all over the longs

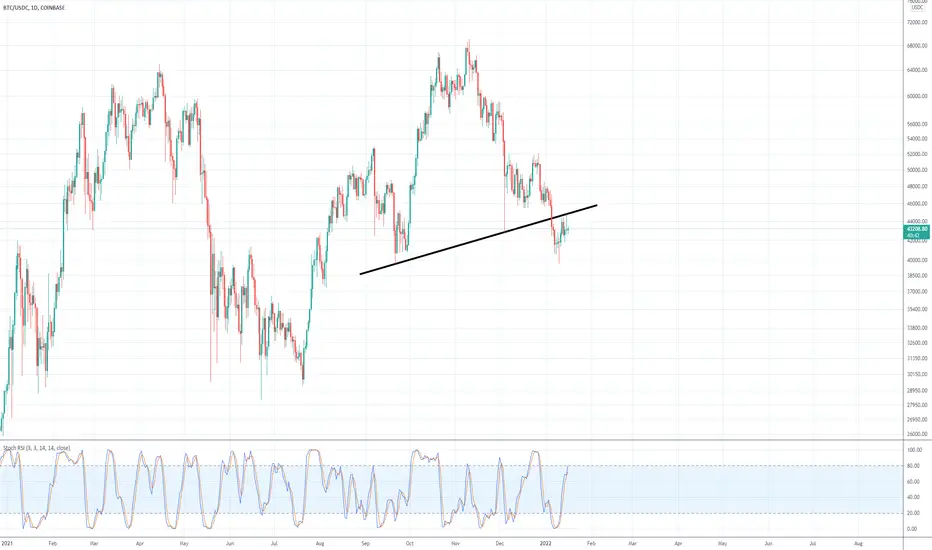
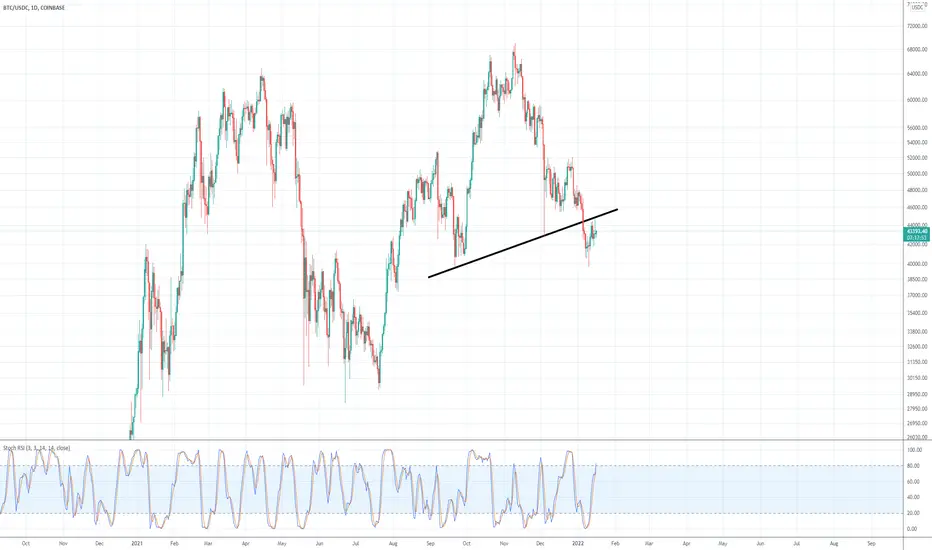
BTC: seems like it could be at resistance.I am pulling for 46k push but BTC is still in potential danger. Needs to get above this trend line, or else...
BTCWe are coming and flames 🔥 between our hands
Hope you enjoyed our ideas 💡
Support, like , share 😉

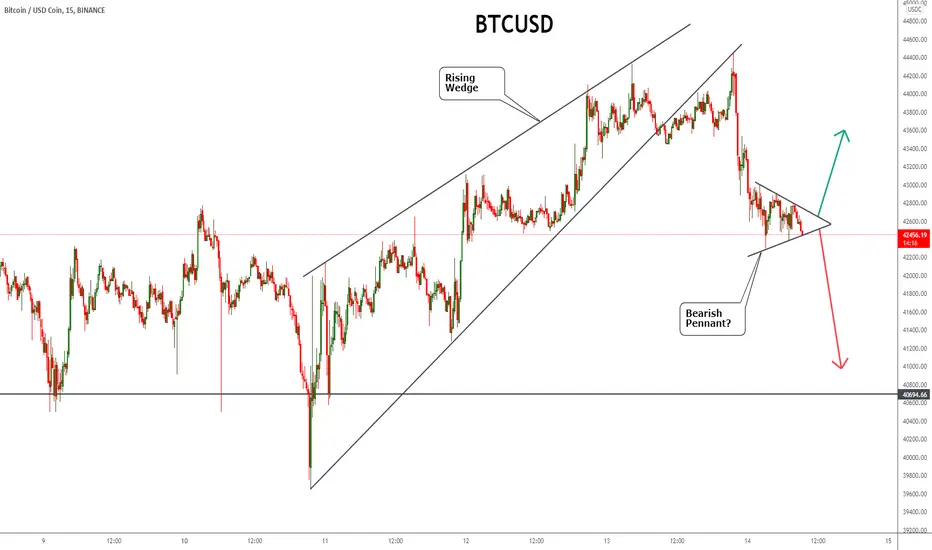
BTCUSD current patternI think now we have a bearish pennant pattern is forming in 15M chart.
I will wait the clear direction before entry.

Buy the DIP! BTC TECHNICAL ANALYSISHere are the support zones for BTC
The lines that are larger represent the max support/resistance
The lines that are thinner represent the start of the support/resistance
If we go under this current support zone things could turn ugly quick. The trend line would be hit making prices go back up to the past support and now resistance. Then that would bring us back down which could possibly break the trend line.
Split your capital for these support zones. Unless it comes back up soon, which if it does make sure it breaks a resistance zone and makes it support before putting in the rest of your capital.

Double minimum?? IF..
For several weeks, many people on social media have been talking about Bottom ..
The inversions have to be confirmed by figures, there aren't any yet, even the rectangle hypothesis has not been confirmed.
There may be a double low IF:
1) prices from now to Monday (where liquidity is supposed to return to the markets) will not go below the low of December 4th (or in a small percentage of little significance)
2) there will be a 45k retest
3) There will be volumes at least similar to those seen from 20 to 24 September
...a good candlestick pattern would be welcome

BULLS HOPIUM FRACTAL PROVED WRONG- READ TILL THE END.Bulls seem to be getting almost too high on eoy 100k hopium because of the summer 2021 accumulation fractal that looks exactly the same as the current range formation. Today I will explain to you how the large institutions will make money of you if you go long. As you know trading securities is a zero sum game. for every buyer there is a seller, for every loser, there is a winner. For a large institution to be the winner they have to manipulate you into thinking a certain way and acting upon it.
Currently they are manipulating you to think that we are in a similar period of wyckoff accumulation as we were in summer 2021, when as a matter of fact we are in distribution. It takes 93 million dollars to move bitcoin 1 percent according to bank of america study, it takes $1.5 billion to move bitcoin in the range of 45k-52k, one whale institution has that kind of money, it's pocket change, check mark here.
Logically speaking a bunch of average joes couldn't have gathered together and decided to buy buy buy bitcoin and then sell sell sell bitcoin the same pattern way as the summer's accumulation, this coincidence of a large pattern repeating itself is almost too good to be true. So here is a mind boggling possibility, what if a whale decided that its institution is going to concoct a plan to fool the public by artificially moving the price the same way as it did move during last accumulation, so that people can reference the past pattern to know that this is the bottom and when to buy and when to sell in that range. Now people will supposedly buy the dip because they reference a spot from the dip in summer and that's where the whale will sell, and the whale will also sell after a period of buy buy buy when price reached the top of the range.
To prove that it actually is not an accumulation is simple. why would a whale copy the summer pattern and notify everybody of the upcoming tops and the upcoming bottoms, they wouldn't want anybody cocblocking their accumulation at the bottom of the range, if people knew the dips ahead of the time it would add unnecessary buying pressure and be counterproductive to the institutional plan. Fine, but how do we know this pattern is artificial at all, well, if you open a 1 hr chart and zoom in you will notice how some movements seem awfully too much stronger than others, the ones with large candle bodies on the current range seem forced if this is supposedly the dip why the selling here, and why they buying here? something doesn't make sense when you think of it in the sense of accumaltion, but when you look at it from a viewpoint of manipulation it's easy to see that once a couple youtubers have noticed the pattern copying itself, it takes one stupid bitboy crypto or cryptorus to feed their audience the narrative of "This is the bottom because it looks the same". But slowly exhausting and continuing its manipulation the whale will be completely finished with distribution and then it will need to set in motion a second step to its plan, dumping the price far down so it can re accumulate.
But the work has already been done, worthless options expiry at max pain push prices plunging even further, hodler will power slowly breaking down as they watch their stimulus checks crash and burn as they sell, stop losses cascading down, noobs panicking, spoofing. Add 1 + 1 and you got one big ass red candlestick and boulevard of broken dreams. #BTCto30k

BTC: maybe there we areA rectangle would be a good inversion figure, it would suffice.
Considering that the downtrend started on November 8th and ended on December 4th (probably), it is 4 weeks.
If this were the case, the rectangle would have a duration of at least the cycle of the previous trend (from 7 December to 3-4 January), therefore sufficient for a reversal.
The next few days could be a good time to buy if there is a good reversal pattern that closes above 46K.
I would wait for a compound pattern, at least 2-3 candles, being close to the end of the year there could be false breaks.
