USD/CHF - Bearish Flag (24.07.2025)Fundamental Updates :
Dollar falls - New Trade agreement and uncertainties in Market :
President Donald Trump announced a trade deal on Tuesday with Japan, which lowers tariffs on auto imports to 15% in exchange for a $550 billion package of U.S.-bound investment and loans.
The USD/CHF Pair on the M30 timeframe presents a Potential Selling Opportunity due to a recent Formation of a Bearish Flag Pattern. This suggests a shift in momentum towards the downside in the coming hours.
Possible Short Trade:
Entry: Consider Entering A Short Position around Trendline Of The Pattern.
Target Levels:
1st Support – 0.7878
2nd Support – 0.7855
🎁 Please hit the like button and
🎁 Leave a comment to support for My Post !
Your likes and comments are incredibly motivating and will encourage me to share more analysis with you.
Best Regards, KABHI_TA_TRADING
Thank you.
Disclosure: I am part of Trade Nation's Influencer program and receive a monthly fee for using their TradingView charts in my analysis.
USDCHF trade ideas

USD/CHF - Bearish Flag (24.07.2025)The USD/CHF Pair on the M30 timeframe presents a Potential Selling Opportunity due to a recent Formation of a Bearish Flag Pattern. This suggests a shift in momentum towards the downside in the coming hours.
Possible Short Trade:
Entry: Consider Entering A Short Position around Trendline Of The Pattern.
Target Levels:
1st Support – 0.7878
2nd Support – 0.7855
🎁 Please hit the like button and
🎁 Leave a comment to support for My Post !
Your likes and comments are incredibly motivating and will encourage me to share more analysis with you.
Best Regards, KABHI_TA_TRADING
Thank you.
Disclosure: I am part of Trade Nation's Influencer program and receive a monthly fee for using their TradingView charts in my analysis.

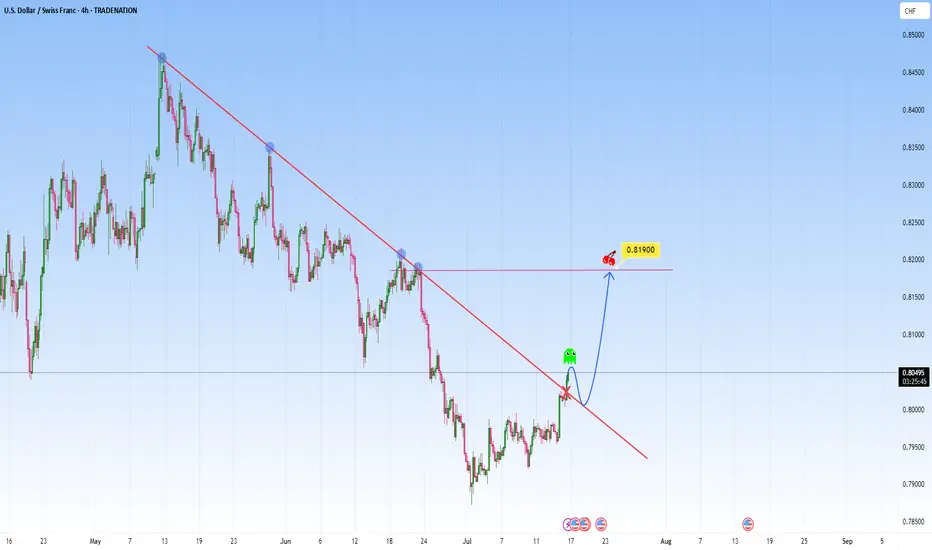
USDCHF: Could be telling a story of break-retest-reversalThe price action on the USDCHF presents an opportunity of structural transition. The descending trendline has acted as dynamic resistance, has contained each rally attempt beautifully. This trendline is marked by multiple rejections, reflected bearish dominance, a controlled downtrend in motion.
The recent movement though could signal a shift. The market has started to break above this descending structure, and it could early suggest that bearish momentum is weakening.
I will be waiting for the price to return to the broken trendline, treating former resistance as newfound support. It’s a confirmation pattern in order to filter false moves, a structure retest that reinforces breakout reliability.
From this base, I am expecting it to target the 0.81900 level, as shown. This area coinciding with horizontal resistance that aligns with previous reactions. Such levels as natural “gravitational pivots”.
An ideal approach here would involve observing the character of the pullback. If the market returns to the trendline with declining bearish volume and forms higher lows on lower timeframes, it strengthens the bullish case.
The trendline break on the chart is not just a signal, it’s a storyline unfolding. It marks a shift with a story. And if volume, price structure, and timing align as they appear poised to, this move could be the first move in a broader upside correction or trend reversal.
Just sharing my thoughts for the charts, this isn’t financial advice. Always confirm your setups and manage your risk properly.
Disclosure: I am part of Trade Nation's Influencer program and receive a monthly fee for using their TradingView charts in my analysis.
Lingrid | USDCHF Corrective Move and Bearish ContinuationThe price perfectly fulfills my previous idea . FX:USDCHF is weakening after printing a lower high beneath the resistance zone and rejecting the confluence of the downward trendline and horizontal supply near 0.80079. The structure remains bearish despite short-term corrective moves, as each rally stalls below previous highs. Price is at risk of rolling over again, aiming for the 0.78300 support if the 0.80000 area holds as resistance. Sellers remain in control as long as the pair trades below the red trendline.
📉 Key Levels
Sell trigger: Rejection below 0.80000
Sell zone: 0.79800–0.80100
Target: 0.78300
Invalidation: Close above 0.80150
💡 Risks
Bullish breakout above the descending trendline
Momentum divergence on intraday timeframes
Broader USD strength recovery
If this idea resonates with you or you have your own opinion, traders, hit the comments. I’m excited to read your thoughts!

USDCHF is Attempting to Break the Trend!!Hey Traders, in today's trading session we are monitoring USDCHF for a selling opportunity around 0.79720 zone, USDCHF was trading in an uptrend and currently seems to be attempting to break it out. If we get dips below the trend i will be looking for a retrace towards more lows.
Trade safe, Joe.

Milking USDCHF again! This time => BULLISH!Hello TradingView Family / Fellow Traders. This is Richard, also known as theSignalyst.
📈USDCHF has been overall bullish as a correction phase, trading within the rising wedge marked in blue.
This week, USDCHF is retesting the lower bound of the wedge pattern.
Moreover, the green zone is a strong structure.
🏹 Thus, the highlighted blue circle is a strong area to look for buy setups as it is the intersection of the lower blue trendline and green support.
📚 As per my trading style:
As #USDCHF approaches the blue circle zone, I will be looking for bullish reversal setups (like a double bottom pattern, trendline break , and so on...)
📚 Always follow your trading plan regarding entry, risk management, and trade management.
Good luck!
All Strategies Are Good; If Managed Properly!
~Richard Nasr
Disclosure: I am part of Trade Nation's Influencer program and receive a monthly fee for using their TradingView charts in my analysis.

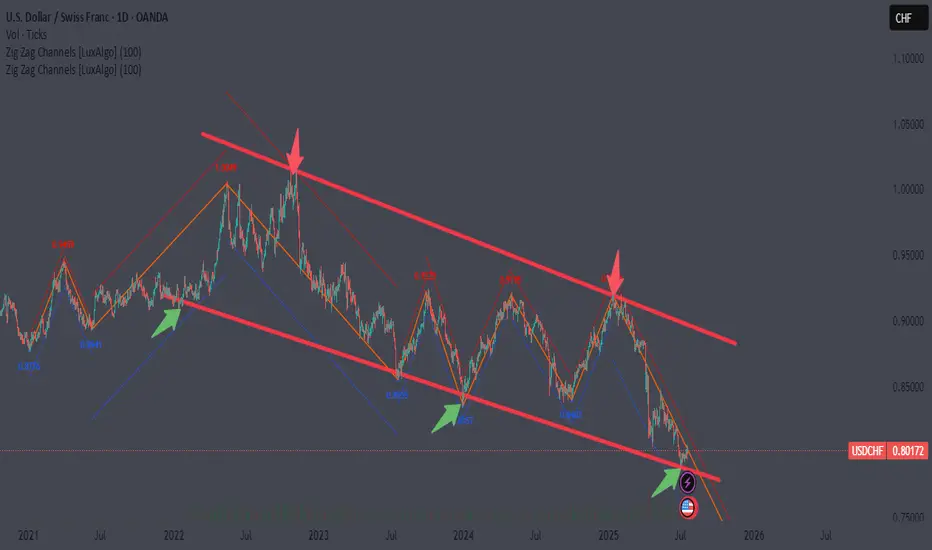
USDCHF Broke the Trendline resistance, what about Fib 0 .5? USDCHF was trading in downward and recently it has Broken the trendline resistance and price is currently at 0.5 fib will it reject form here again ? or fib 0.5 will be broken after correction and further growth ?

PIPS DEE TEISII'll like to achieve all my dreams through trading the market nor matter how difficulty could be the aim is to built a future in the long term run...
USDCHF*The content on this analysis is subject to change at any time without notice, and is provided for the sole purpose of assisting traders to make independent investment decisions.

USDCHF sellUSD/CHF is currently in a downtrend, with the US Dollar exhibiting weakness throughout the year. From a technical standpoint, the pair appears poised for further decline, given the formation of a bearish flag. If considering this trade, it's essential to prioritize risk management or look for a potential retest of the flag's resistance level (or the apex of an ascending wedge, if applicable) before entering a short position.

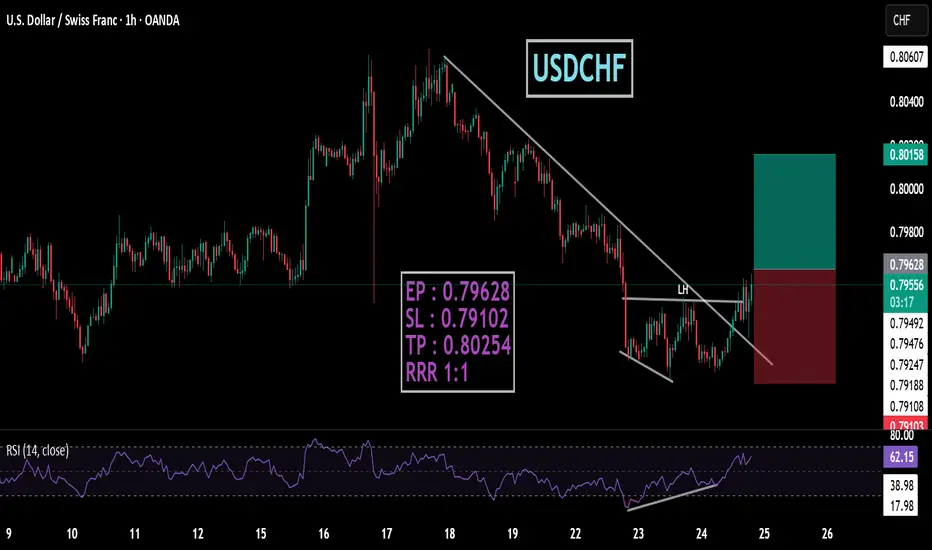
USDCHFtrendline breakout also divergence break last LH
EP : 0.79628
SL : 0.79102
TP : 0.80254
RRR 1:1
USDCHFUSDCHF price is near the main support zone 0.79245-0.78590. If the price cannot break through the 0.78590 level, it is expected that the price will rebound. Consider buying the red zone.
🔥Trading futures, forex, CFDs and stocks carries a risk of loss.
Please consider carefully whether such trading is suitable for you.
>>GooD Luck 😊
❤️ Like and subscribe to never miss a new idea!

USDCHFUSDCHF If the price can stay above 0.78590, it is expected that the price will rebound. Consider buying in the red zone.
🔥Trading futures, forex, CFDs and stocks carries a risk of loss.
Please consider carefully whether such trading is suitable for you.
>>GooD Luck 😊
❤️ Like and subscribe to never miss a new idea!
USDCHF - BULLISH MOVE !Hello Traders !
The USDCHF price formed a rectangle pattern.
Currently, The resistance level (0.79950 - 0.79800) is broken !
So, I expect a bullish move🚀
_______________
TARGET: 0.80330🎯

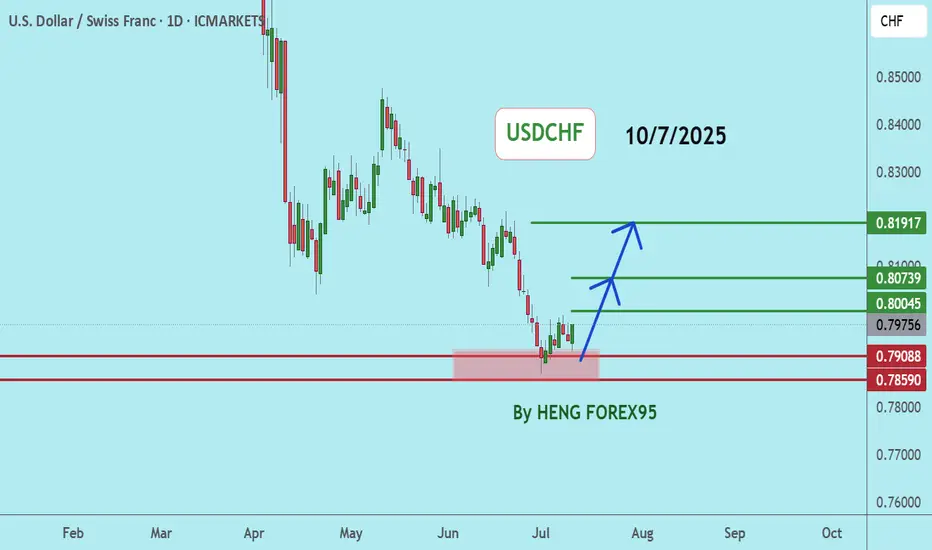
H4 LongUSDCHF is touching levels that it only touched in 2011. Its presently sitting on a very strong support. We expect a very long retracement which will last the remainder of 2025.
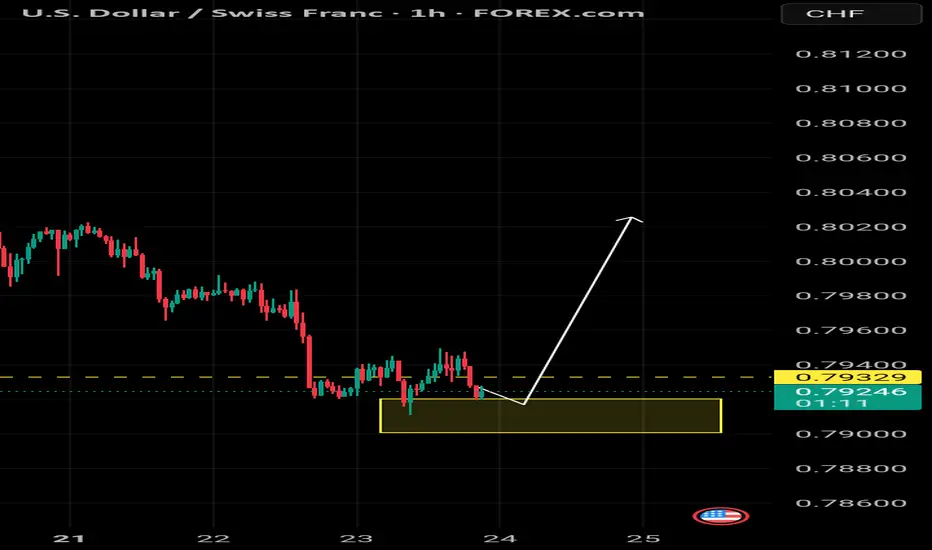
Where is USD/CHF heading?
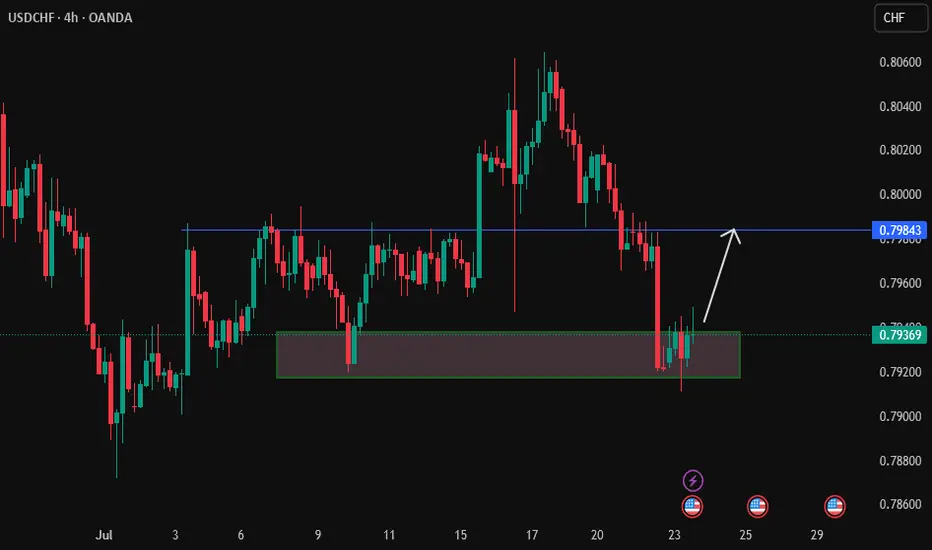
🔸 Yellow Zone in Focus
The yellow area represents a critical support level. As long as the price holds above this zone, a strong upward move is expected in the coming days.
⚠️ A break below this area would invalidate the bullish scenario and may signal the start of a downtrend.
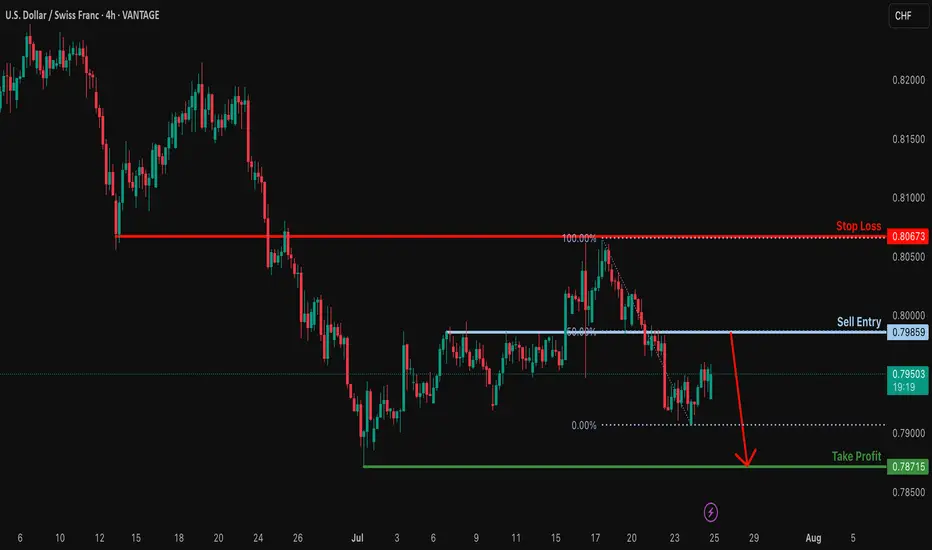
Bearish drop?USD/CHF is rising towards the resistance level which is an overlap resitance that lines up with the 50% FIbonacci retracement and could reverse from this level to our take profit.
Entry: 0.7985
Why we like it:
There is an overlap reistance that lines up with the 50% FIbonacci retraecment.
Stop loss: 0.8067
Why we like it:
There is an overlap resitance.
Take profit: 0.7871
Why we like it:
There is a swing low support.
Enjoying your TradingView experience? Review us!
Please be advised that the information presented on TradingView is provided to Vantage (‘Vantage Global Limited’, ‘we’) by a third-party provider (‘Everest Fortune Group’). Please be reminded that you are solely responsible for the trading decisions on your account. There is a very high degree of risk involved in trading. Any information and/or content is intended entirely for research, educational and informational purposes only and does not constitute investment or consultation advice or investment strategy. The information is not tailored to the investment needs of any specific person and therefore does not involve a consideration of any of the investment objectives, financial situation or needs of any viewer that may receive it. Kindly also note that past performance is not a reliable indicator of future results. Actual results may differ materially from those anticipated in forward-looking or past performance statements. We assume no liability as to the accuracy or completeness of any of the information and/or content provided herein and the Company cannot be held responsible for any omission, mistake nor for any loss or damage including without limitation to any loss of profit which may arise from reliance on any information supplied by Everest Fortune Group.
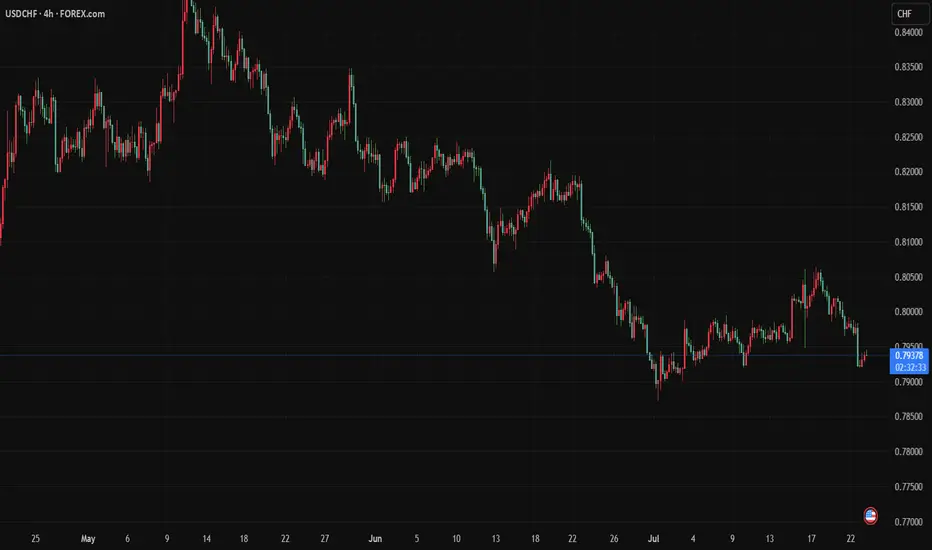
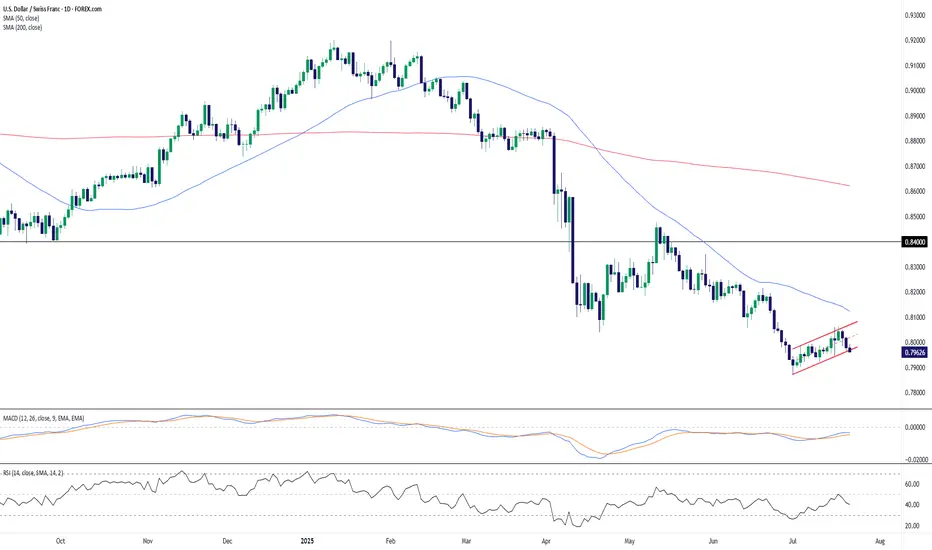
USD/CHF – Bearish Flag Forms Below Resistance, Trend Still DownUSD/CHF remains under pressure after a sustained downtrend and is currently consolidating within a potential bearish flag pattern. Price action has carved out a rising channel after the sharp June selloff, but the structure appears corrective rather than impulsive—suggesting the dominant bearish trend may soon resume.
The pair is struggling to hold the 0.7950–0.8000 zone and trades below both the 50-day (0.8124) and 200-day (0.8621) SMAs, confirming a bearish market structure. Momentum indicators also lean bearish: the MACD is below zero and has begun to curl lower again, while RSI hovers near 40, not yet oversold but lacking bullish momentum.
A breakdown below the flag’s lower boundary would confirm the continuation pattern, exposing 0.7900 initially, with scope toward fresh multi-month lows. On the upside, a close above 0.8100 would challenge the flag’s validity and place the 50-day SMA in focus as resistance.
Bias: Bearish continuation favored unless price breaks and holds above 0.8100. Flag breakdown would reconfirm downside momentum.
Time frame: Short-term (days)
-MW
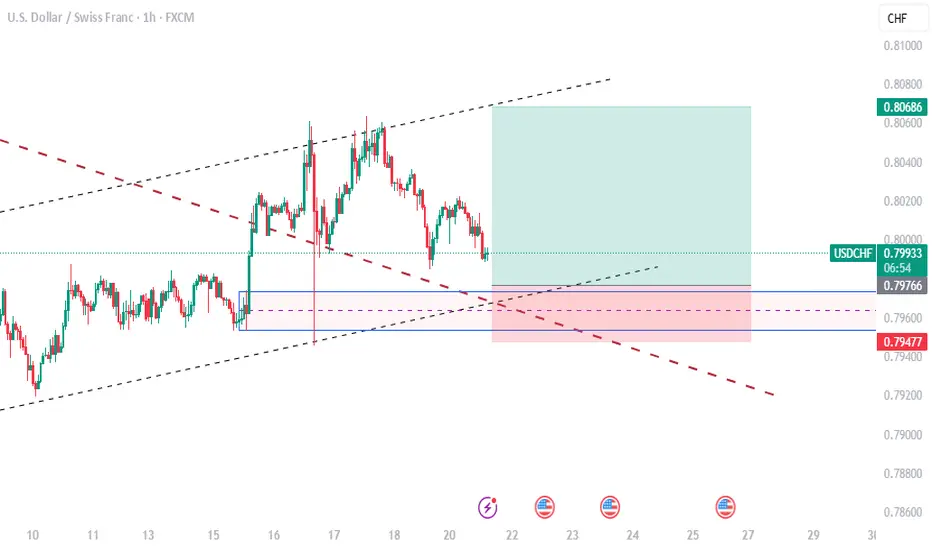
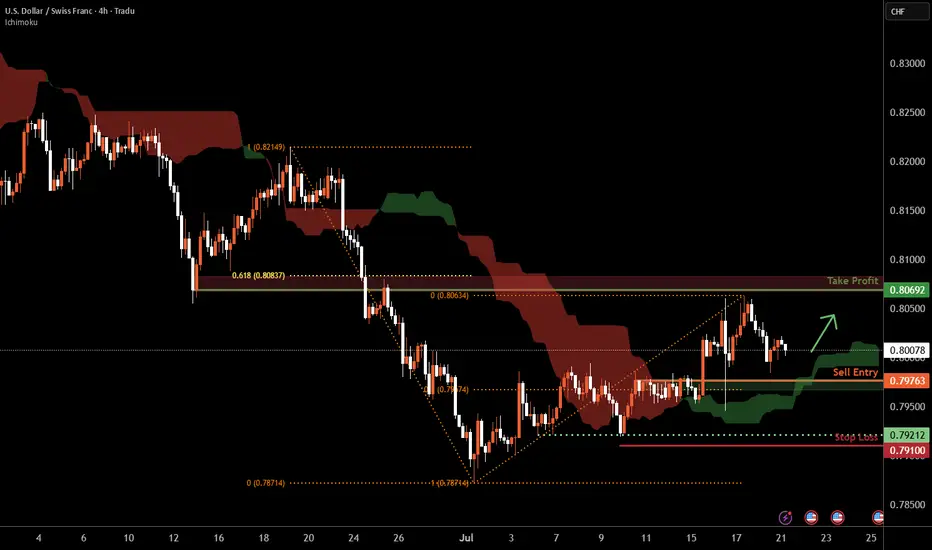
USD/CHF H4 | Pullback support at 50% Fibonacci retracementUSD/CHF is falling towards a pullback support and could potentially bounce off this level to climb higher.
Buy entry is at 0.7976 which is a pullback support that aligns with the 50% Fibonacci retracement.
Stop loss is at 0.7910 which is a level that lies underneath a multi-swing-low support.
Take profit is at 0.8069 which is an overlap resistance that aligns closely with the 61.8% Fibonacci retracement.
High Risk Investment Warning
Trading Forex/CFDs on margin carries a high level of risk and may not be suitable for all investors. Leverage can work against you.
Stratos Markets Limited (tradu.com ):
CFDs are complex instruments and come with a high risk of losing money rapidly due to leverage. 66% of retail investor accounts lose money when trading CFDs with this provider. You should consider whether you understand how CFDs work and whether you can afford to take the high risk of losing your money.
Stratos Europe Ltd (tradu.com ):
CFDs are complex instruments and come with a high risk of losing money rapidly due to leverage. 66% of retail investor accounts lose money when trading CFDs with this provider. You should consider whether you understand how CFDs work and whether you can afford to take the high risk of losing your money.
Stratos Global LLC (tradu.com ):
Losses can exceed deposits.
Please be advised that the information presented on TradingView is provided to Tradu (‘Company’, ‘we’) by a third-party provider (‘TFA Global Pte Ltd’). Please be reminded that you are solely responsible for the trading decisions on your account. There is a very high degree of risk involved in trading. Any information and/or content is intended entirely for research, educational and informational purposes only and does not constitute investment or consultation advice or investment strategy. The information is not tailored to the investment needs of any specific person and therefore does not involve a consideration of any of the investment objectives, financial situation or needs of any viewer that may receive it. Kindly also note that past performance is not a reliable indicator of future results. Actual results may differ materially from those anticipated in forward-looking or past performance statements. We assume no liability as to the accuracy or completeness of any of the information and/or content provided herein and the Company cannot be held responsible for any omission, mistake nor for any loss or damage including without limitation to any loss of profit which may arise from reliance on any information supplied by TFA Global Pte Ltd.
The speaker(s) is neither an employee, agent nor representative of Tradu and is therefore acting independently. The opinions given are their own, constitute general market commentary, and do not constitute the opinion or advice of Tradu or any form of personal or investment advice. Tradu neither endorses nor guarantees offerings of third-party speakers, nor is Tradu responsible for the content, veracity or opinions of third-party speakers, presenters or participants.
USD/CHF Update: Missed the Last Short? Grab the New Trigger!Yo traders and market lovers, it’s Skeptic from Skeptic Lab! Here’s a quick USD/CHF update: my last short trigger after the support break gave us a 50-pip drop . With a solid stop loss, you’re likely sitting on a 2:1 R/R; risk-takers might even be at 5:1. I’m breaking down a fresh trigger in this video—don’t miss it! Drop your thoughts or coin requests in the comments, give it a boost if it helped , and don’t miss my educational post coming tonight on Skeptic Lab’s TradingView page with lessons from my first 100 trades—it’s gonna be fire. Catch you tonight! 😎

USD/CHF hoping lower. before major up turnA note to myself:
- remember no matter what happens. its a 50/50 chance you are right. even with a winning
strategy.
- whats going on inside of yourself. why? whats it trying to tell you?
- what have you learned about yoursefl?
- be patient, take a breathe and be aware of FOMO
- Its not about quantity. its about quality.(choose MAX. 3 trades a week)
- stick to your plan. load up on quality trades.
- RISK MANAGEMENT is the key to being a successful trader AND Risk Reward Ratio minimum 1:3 w