USDCHF trade ideas

USDCHF Buy analysis/ideaThis trade and analysis is mainly based on the Daily and 4-hour charts and executed using reversal trading and trend formation. Complete explanation in the video!

USD/CHF H1 | Falling toward a swing-low supportUSD/CHF is falling towards a swing-low support and could potentially bounce off this level to climb higher.
Buy entry is at 0.8189 which is swing-low support that aligns with the 78.6% Fibonacci retracement.
Stop loss is at 0.8159 which is a level that lies underneath a multi-swing-low support.
Take profit is at 0.8244 which is a multi-swing-high resistance that aligns closely with the 50.0% Fibonacci retracement.
High Risk Investment Warning
Trading Forex/CFDs on margin carries a high level of risk and may not be suitable for all investors. Leverage can work against you.
Stratos Markets Limited (tradu.com ):
CFDs are complex instruments and come with a high risk of losing money rapidly due to leverage. 63% of retail investor accounts lose money when trading CFDs with this provider. You should consider whether you understand how CFDs work and whether you can afford to take the high risk of losing your money.
Stratos Europe Ltd (tradu.com ):
CFDs are complex instruments and come with a high risk of losing money rapidly due to leverage. 63% of retail investor accounts lose money when trading CFDs with this provider. You should consider whether you understand how CFDs work and whether you can afford to take the high risk of losing your money.
Stratos Global LLC (tradu.com ):
Losses can exceed deposits.
Please be advised that the information presented on TradingView is provided to Tradu (‘Company’, ‘we’) by a third-party provider (‘TFA Global Pte Ltd’). Please be reminded that you are solely responsible for the trading decisions on your account. There is a very high degree of risk involved in trading. Any information and/or content is intended entirely for research, educational and informational purposes only and does not constitute investment or consultation advice or investment strategy. The information is not tailored to the investment needs of any specific person and therefore does not involve a consideration of any of the investment objectives, financial situation or needs of any viewer that may receive it. Kindly also note that past performance is not a reliable indicator of future results. Actual results may differ materially from those anticipated in forward-looking or past performance statements. We assume no liability as to the accuracy or completeness of any of the information and/or content provided herein and the Company cannot be held responsible for any omission, mistake nor for any loss or damage including without limitation to any loss of profit which may arise from reliance on any information supplied by TFA Global Pte Ltd.
The speaker(s) is neither an employee, agent nor representative of Tradu and is therefore acting independently. The opinions given are their own, constitute general market commentary, and do not constitute the opinion or advice of Tradu or any form of personal or investment advice. Tradu neither endorses nor guarantees offerings of third-party speakers, nor is Tradu responsible for the content, veracity or opinions of third-party speakers, presenters or participants.

USDCHF Technical & Order Flow AnalysisOur analysis is based on a multi-timeframe top-down approach and fundamental analysis.
Based on our assessment, the price is expected to return to the monthly level.
DISCLAIMER: This analysis may change at any time without notice and is solely intended to assist traders in making independent investment decisions. Please note that this is a prediction, and I have no obligation to act on it, nor should you.
Please support our analysis with a boost or comment!

USDCHF - Bullish Ideathe currency pair is in downttrend for most of the sessions. But seem like bullsh have started to step in and the price is taking some support at current price level.
Bullish divergence have formed in 4H TF can indicate reversal . At the break of lower TF resestance entry can be placed with SL below the previous low

USDCHF Will Go Higher! Long!
Please, check our technical outlook for USDCHF.
Time Frame: 9h
Current Trend: Bullish
Sentiment: Oversold (based on 7-period RSI)
Forecast: Bullish
The market is testing a major horizontal structure 0.821.
Taking into consideration the structure & trend analysis, I believe that the market will reach 0.832 level soon.
P.S
The term oversold refers to a condition where an asset has traded lower in price and has the potential for a price bounce.
Overbought refers to market scenarios where the instrument is traded considerably higher than its fair value. Overvaluation is caused by market sentiments when there is positive news.
Disclosure: I am part of Trade Nation's Influencer program and receive a monthly fee for using their TradingView charts in my analysis.
Like and subscribe and comment my ideas if you enjoy them!

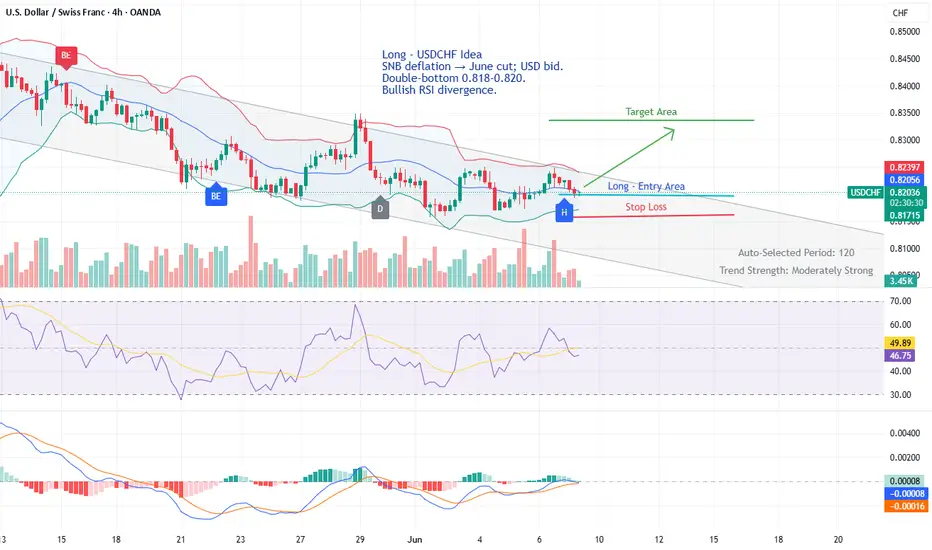
LONG - USDCHFLONG - USDCHF
- SNB deflation → June cut; USD likely strengthen following weakness and news flow.
- Double-bottom 0.818-0.820.
- Bullish RSI divergence.
PREPPING FOR LONGSUSD/CHF 1H - It will be interesting to see whether or not this area of Demand holds and whether we have means to enter in on this market with some long positions, taking advantage of the corrective wave that should trade price up and into the Supply Zone above.
Once we have clear rejection from the zone price is currently trading into, delivering us with some fractal breaks I will be using that to build on my confluence and I will be looking for some entries on the market.
I want to see the last fractal high that traded price down and into that Demand Zone break, telling us that enough Demand has been introduced to now flip the balance, once we have that we can look to take part.
The potential trade here could be huge, its important we just wait patiently and sit on our hands, allowing price to come to us. Once I have the confirmation I need I will let you all know.

Could the Swissie bounce from here?The price is reacting off the pivot and could reverse from this level to the 1st resistance.
Pivot: 0.8197
1st Support: 0.8042
1st Resistance: 0.8448
Risk Warning:
Trading Forex and CFDs carries a high level of risk to your capital and you should only trade with money you can afford to lose. Trading Forex and CFDs may not be suitable for all investors, so please ensure that you fully understand the risks involved and seek independent advice if necessary.
Disclaimer:
The above opinions given constitute general market commentary, and do not constitute the opinion or advice of IC Markets or any form of personal or investment advice.
Any opinions, news, research, analyses, prices, other information, or links to third-party sites contained on this website are provided on an "as-is" basis, are intended only to be informative, is not an advice nor a recommendation, nor research, or a record of our trading prices, or an offer of, or solicitation for a transaction in any financial instrument and thus should not be treated as such. The information provided does not involve any specific investment objectives, financial situation and needs of any specific person who may receive it. Please be aware, that past performance is not a reliable indicator of future performance and/or results. Past Performance or Forward-looking scenarios based upon the reasonable beliefs of the third-party provider are not a guarantee of future performance. Actual results may differ materially from those anticipated in forward-looking or past performance statements. IC Markets makes no representation or warranty and assumes no liability as to the accuracy or completeness of the information provided, nor any loss arising from any investment based on a recommendation, forecast or any information supplied by any third-party.

Sell USDCHFI'm analyzing USDCHF and on the 4-hour timeframe, the overall market is in an downtrend. In the 1-hour timeframe, a minor uptrend has been broken, and the price looks ready to align with the overall uptrend. If the market crosses my alert level, I’ll look for a sell opportunity.

EURCHF H4As we can see , we had sell side Liquidity that have been taken out after that , we had MSS (market structure shift ) which creates inducement that forms SMT ( smart money technique). After SMT market goes up creating inversion fair value gap. And we took our entry at our order block.

USDCHF: weekly overviewHello Traders,
In long-term, we anticipate a bearish move to 0.76500 for this pair. but for this week, our most important zone is the 0.81911
**********************************************************
The indicated levels are determined based on the most reaction points and the assumption of approximately equal distance between the zones.
Some of these points can also be confirmed by the mathematical intervals of Murray.
You can enter with/without confirmation. IF you want to take confirmation you can use LTF analysis, Spike move confirmation, Trend Strength confirmation and ETC.
SL could be placed below the zone or regarding the LTF swings.
TP is the next zone or the nearest moving S&R, which are median and borders of the drawn channels.
*******************************************************************
Role of different zones:
GREEN: Just long trades allowed on them.
RED: Just Short trades allowed on them.
BLUE: both long and short trades allowed on them.
WHITE: No trades allowed on them! just use them as TP points

USD/CHFSmart money trap is set,
Looks like we are now in the manipulation faze.
I am now waiting for the early buyer liquidity to be swept and then look for bullish entry areas targeting the major high.

Why You Should Avoid Safe-Haven Shorts Next WeekTraders, don’t walk into next week blind.
The U.S. and China are set to hold official trade talks in London on June 9, and the market is already shifting in anticipation.
This video breaks down exactly how the process works — from Trump’s surprise phone call, to tariff de-escalation, to what happens when global tensions ease.
If you're planning to short USD/JPY, USD/CHF, or any safe-haven pairs next week, you need to watch this first.
Because a positive trade outcome = risk-on sentiment, and that means JPY and CHF will likely weaken fast.
I explain:
Why optimism crushes safe-haven setups
What smart money is watching
How to align your trades with the macro narrative
And how not to get trapped like most retail traders will
📉 This is how real traders position ahead of a global sentiment shift.
Drop a comment if you’re preparing the same way, and follow for more macro-driven trade insights.

Usdchf Am expecting a bearish continuation because we have price moving bearish we have a clear head and shoulders on de 1 day we have a break and retest so we are expecting weak out on the resistance zone then we sell or a positive candle den we sell

USDCHF MIGHT BREAK THE SUPPORT LEVEL!!USDCHF is experiencing pressure at the support level. I expect a possible break below this price level. a sell opportunity is envisaged if we'd get a break below the support level.

USD/CHF – BULLISH Plan for Next WeekThe battlefield is set.
The market has spoken — now it’s our turn to act.
This is my two-scenario strategy for USD/CHF going into next week, built around institutional behavior, liquidity grabs, and market structure.
📍 Zone Recap:
Liquidity Taken – Price swept below key support zones, triggering stop-losses and clearing out retail longs.
Support Levels – Minor zones were broken on the lower timeframes (LTF), but these are not structurally strong.
Institutional Setup – Smart money often manipulates these levels before initiating the true directional move.
🧭 SCENARIO 1 – The Bullish Continuation (More Likely)
The most probable outcome based on structure and liquidity behavior:
Price opens bullish.
Retests the broken minor support (now acting as demand).
Buys triggered after confirmation.
Targets:
First TP: 0.82650
Second TP: 0.83500+
Break above = room for explosive movement toward 0.84000–0.84500
This aligns with the concept of liquidity engineering, where the market takes the weak hands out before the real move starts.
⚔️ SCENARIO 2 – The Last Sweep Before the Climb (Less Likely but Possible)
If price opens bearish, we must remain vigilant:
A final push lower could target the same liquidity zone again,
further liquidating retail traders who jumped in early.
If this occurs, the real bullish move would follow, catching everyone off guard.
Entry would then be taken after a deeper retest + bullish market structure shift.
🧠 STRATEGY MINDSET:
This isn’t guesswork — this is preparation.
Retail sees chaos. Smart traders see order in manipulation.
We don’t chase moves. We understand them.
“The market punishes the impulsive and rewards the prepared.”
I stand with patience. I wait for confirmation.
I strike when the weak are removed and the zone is clean.
🔐 Remember:
No confirmation = no entry.
Adapt to the narrative the market gives you.
If 0.81750 breaks down with strength → pause. Reevaluate. No ego.
📈 USD/CHF outlook: Bullish bias, smart entry only.
Drop your thoughts, setups, or if you’re preparing for the same war.
Let’s grow and conquer — one level at a time.

USD/CHF Setup Breaking Down: Don’t Get Caught Long This TrapUSD/CHF is currently trading at a critical technical and macro-structural juncture. Price is hovering within the weekly support area between 0.8050 and 0.8200, a zone that has historically triggered significant bullish reactions. However, the latest weekly candle closed below the psychological 0.8200 level, showing a clear rejection of upper resistance and signaling a lack of buying strength on the U.S. dollar side. This weak closure undermines the bullish structure and opens the door for a potential continuation of the downtrend—especially if price breaks below the 0.8150 mark on the daily or H4 timeframe.
From a seasonal standpoint, June has historically been a bearish month for USD/CHF. Monthly average returns over the past 20, 15, 10, and 5 years confirm steady downside pressure on the dollar against the Swiss franc. Only the 2-year average shows a slight positive bias, but it remains an outlier against the broader seasonal trend. This supports the idea that the recent weakness is not only technical but also cyclical in nature.
The Commitment of Traders (COT) report reinforces this bearish view. On the Swiss franc side, commercial traders (typically the most informed and hedging-oriented participants) are heavily net long, while non-commercial traders (speculators) remain significantly net short. This imbalance is often seen around reversal points and may indicate rising CHF strength. On the U.S. dollar side, positioning is far more balanced—the Dollar Index COT shows a neutral stance, with non-commercials slightly net long but without any dominant momentum. This confirms there’s currently no structural strength behind the dollar to justify a meaningful rebound in USD/CHF.
Lastly, retail sentiment provides a classic contrarian signal: over 90% of retail traders are long on USD/CHF, with only 10% short. This extreme imbalance typically occurs ahead of bearish breakdowns, as institutional players tend to fade overcrowded retail positions.
In conclusion, USD/CHF remains vulnerable to further downside. The weekly price action is weak, seasonal trends are dollar-negative, COT positioning favors CHF strength, and retail sentiment is extremely long-biased. All factors align toward a likely bearish continuation, with technical targets in the 0.8080–0.8050 range. The only alternative scenario would require a strong H4/H1 bullish reaction with a reclaim of 0.8220—but at this stage, that appears unlikely without a major macro catalyst.

USD/CHF💰Symbol: { USD/CHF }
🟩Price: { 0.82174 }
🟥Stop: { 0.82385 }
1️⃣profit: { 0.81707 }
2️⃣profit: { 0.81300 }
3️⃣profit: { 0.81000 }
&
🟩Price: { 0.82455 }
🟥Stop: { 0.82936 }
1️⃣profit: { 0.82200 }
2️⃣profit: { 0.81707 }
3️⃣profit: { 0.81300 }
4️⃣profit: { 0.81000 }
📊Check your chart before entering.
🚨Check before use to make sure there is no important news.🚨

Buy !target is 0.8248
As we know trading against the overall prevailing trend comes with some risk which is why we need to take extra precautions when we look to buy into this market.

USDCHF SHORT Market structure bearish on HTFs 3
Entry at Daily AOi
Weekly Rejection at AOi
Daily Rejection at AOi
Previous Structure point Daily
Around Psychological Level 0.83000
H4 EMA retest
H4 Candlestick rejection
Rejection from Previous structure
Levels 3.99
Entry 100%
REMEMBER : Trading is a Game Of Probability
: Manage Your Risk
: Be Patient
: Every Moment Is Unique
: Rinse, Wash, Repeat!
: Christ is King.

USD/CHF..30M chart pattern.Here’s the breakdown of MY USD/CHF Long Trade Setup:
📈 Trade Idea (Long USD/CHF)
Entry: 0.82140
1st Target: 0.82400
2nd Target: 0.82650
Stop Loss: Not specified ⚠️
🧮 Trade Metrics
Target Pips Gain % Gain (Approx)
1st Target +26 pips +0.32%
2nd Target +51 pips +0.62%
⚠️ Risk Consideration:
No stop loss provided — without it, risk/reward can’t be calculated.
A stop loss around 0.8180–0.8190 might make sense depending on recent support levels.
✅ Summary:
Clean setup with small but realistic targets.
Reward-to-risk will likely be favorable if you use a stop below 0.8190.
Would you like help identifying a technical stop loss or creating a table of your full trade plan (including BTC, gold, and USDCHF)?
