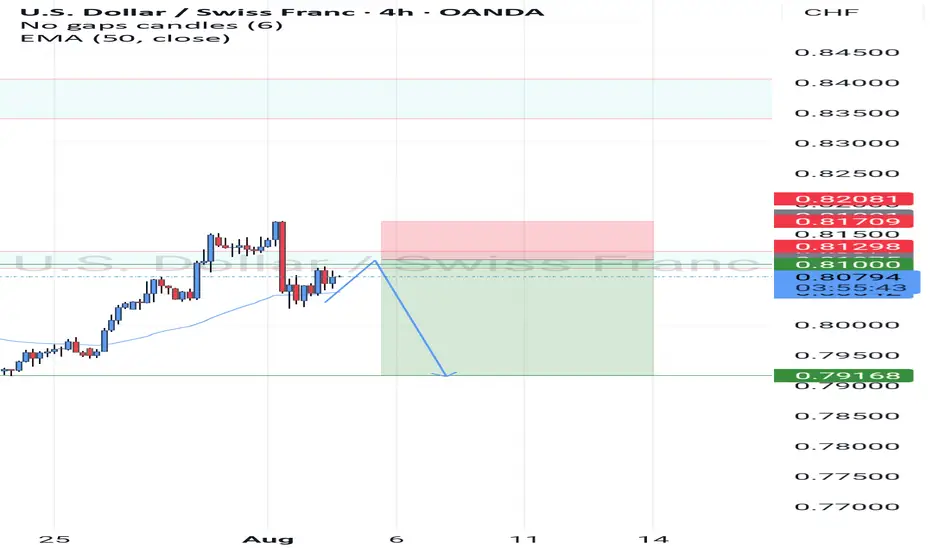
Usdchf As we can see we hv price creating more lower high and lower low so we are expecting a retracment and a change of structure on the 4h then we sell
USDCHF trade ideas

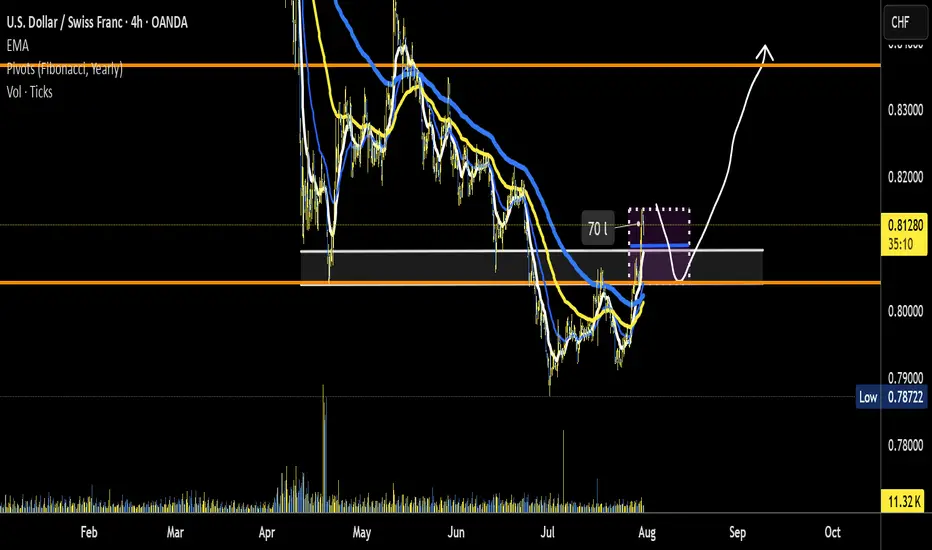
USD/CHF potential trend reversalNothing concrete yet. is the down trend over? Road Map idea correct? look for price action to confirm potential setup.
* if trend reversal is in then a major leg up for a stronger US$
Lingrid | USDCHF Potential Bullish Move Following Level BreakoutFX:USDCHF surged from a higher low and is now retesting the broken structure near 0.802, maintaining its position within the broader upward channel. A clean bounce from this zone would confirm the bullish structure, targeting the upper channel resistance near 0.815. Pullback and higher low structure support continued upside movement with short-term consolidation possible. A breakout from the consolidation box could accelerate momentum toward the resistance area.
📈 Key Levels
Buy zone: 0.802 – 0.805
Buy trigger: Bullish confirmation above 0.805
Target: 0.815
Invalidation: Drop below 0.796
💡 Risks
False breakout near 0.805 may lead to rejection
Failure to form higher high would invalidate bullish sequence
Momentum divergence could slow rally near resistance
If this idea resonates with you or you have your own opinion, traders, hit the comments. I’m excited to read your thoughts!

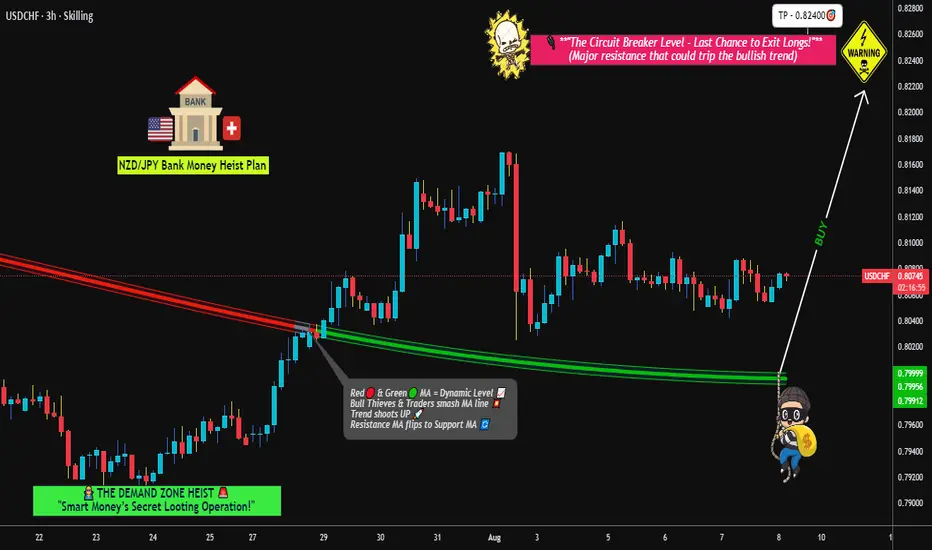
USDCHF Precision Heist Strategy – Buy Dips, Bag Pips💼💸 USDCHF "SWISSIE" – Bullish Vault Infiltration Plan 🕶️📈
"Plan the Layer. Stack the Cash. Escape Clean."
🧠 Mastermind Setup (Thief Trader Blueprint)
🔍 Asset: USDCHF – “The Swissie”
📊 Market Bias: Bullish
🎯 Method: Multi-limit Entry via GRID / Layering / DCA Strategy
🔓 Entry Point: Any live price – thief never waits for permission
🛑 Stop Loss: 0.80000 – the trapdoor in case of reversal
🎯 Target: 0.82400 – cash out before the sirens blare
🧰 Tactical Details:
🎯 Entry Strategy:
Layer entries like a precision bank job – DCA into support zones or pullback levels. Let price come to your ambush.
“A wise thief doesn't chase the vault – he waits in the shadow.”
🧠 Thief Psychology:
We're hunting liquidity pools. Every fake-out is a distraction. Our plan? Predict the move, then ambush it.
🔥 Fundamentals Fueling the Heist:
✅ USD Strengthening on macro pressure
✅ CHF weakening under global risk reset
✅ Institutional net long bias in USD
✅ Intermarket confluence supports USD/CHF upside
“Read the tape. Watch the flows. Follow the smart money.”
📛 Stop Loss Plan:
Set SL below 0.80000 – deeper than the market’s false traps.
Use dynamic SL with trade size + risk model.
SL = Exit plan, not an emotion control leash. Be tactical, not scared.
🎯 Take Profit Tactics:
Target zone at 0.82400 – near historical resistance vault.
Use trailing SL as price flies to protect the bag.
Partial exit if momentum wanes.
⚔️ Scalper's Mini Mission:
🕵️♂️ Focus ONLY on longs – counter moves are traps
💰 Fast fingers? Ride intraday pullbacks
📍 Secure profits fast – alarms ring quick in Forex banks
🚨 Risk Event Alert:
🗓️ Avoid execution during major USD/CHF economic reports
⚠️ Pause entries
⚠️ Use trail SLs if active
⚠️ Expect fakeouts – vault traps trigger easily during news bombs
🔊 Call to Thief Army – Boost This Plan 📣💥
If this setup lights up your chart like a vault scanner:
👍 Smash that LIKE
💬 Drop your entry below
🔁 Share with the crew
Every boost = another brick stacked in our empire 💼
“Pips build pyramids. But unity builds empires.”
#TradeLikeAThief #ForexHeist #SwissieSnatch
📌 Legal Escape Note:
This is not financial advice. It’s a battle plan.
Stay sharp. Manage risk. Execute with precision.
🕶️ Until next vault… Lock it. Load it. Loot it.
🔥 The Swissie won’t rob itself.
London Buy Model Example August 07 2025Hello traders! This is a turtle soup idea. Enjoy. Thanks for all the support.
London Kill Zone 2am - 5am
Asian Lunch 12am - 2am

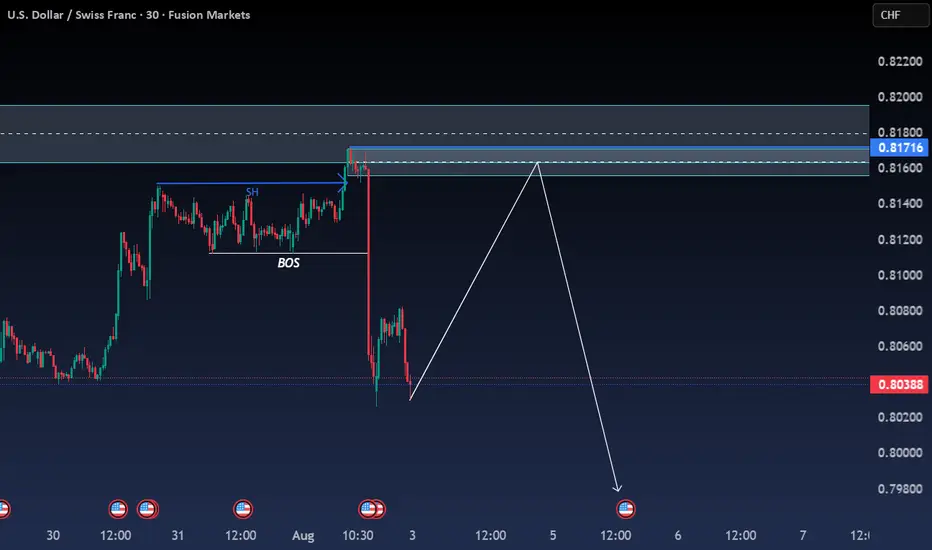
USD/CHF poised for a downward movement for the weekPrice broke structure to the downside on the H4 and returned to a point of interest (POI). After returning to the POI, price then broke structure to the downside on M30. I'm anticipating a return to the M30 ordder block after filling in the imbalance and then continue downward
DISCLAIMER: This is just my analysis and I can be wrong. FUSIONMARKETS:USDCHF
Sell Market has created a strong resistance on the daily time frame and has brought a head and shoulder pattern , taking a sell from the right shoulder at a phycological level 0.80600 , take profit at 0.79288

BEARS Coming Up.On a 1D TF, we have a good BAT Pattern from Harmonics strategy, and as well a very clear AB=CD Pattern, from the EW point of view we are having a good FLAT correction.
At the moment we think the market is done with the pullback and we're setting up for a free fall
This is our insight as it stands.
This isn't an investment advice, and employ your strategies and principles when deciding to join our views.

USDCHF looks like interesting.....Based on current market structure, price already close last week with formation Higher High. Thats show, market still in bullish momentum. And price already make a retracement through the cluster.
To avoid Stoploss Hunter, just set your SL below current market structure. and I personally close up position if price close with body candle.if just wick, I normally hold. Just refer current timeframe

Potential Buy Opportunity on USDCHFReasons I think this pair will rise
- Price printed a higher low on a confirmed bearish trendline. Which is a sign of momentum loss
-Price broke through the aforementioned trendline
- Bullish RSI divergence printed before momentum loss on H4
-RSI was oversold on H4
What do you think?

USDCHF--Short--short term bearish possibility
--strong reaction from monthly resistance around 0.8180
-- lets look at two case. CASE1)Tendency is bearsih. then price will fall. CASE-2) Tendency is bullish.Even if the price will rise later, first it will pullback to 0.7978 level then rise.

USDCHF SHORT IDEA FULL BREAKDOWNUSD/CHF is flashing a strong bearish signal from both a macro and sentiment perspective.
✅ Bearish USD Drivers:
FOMC Pivot Watch: July meeting minutes hinted at potential rate cuts before year-end due to inflation moderating and soft jobs data.
Rising Swiss Franc Demand: CHF is benefiting from safe haven flows amid escalating tensions in Eastern Europe and shaky U.S. equity markets.
Swiss CPI Stable: Inflation is in check, allowing SNB to maintain their policy stance without pressure.
Institutional traders are reducing their exposure to the U.S. dollar, while retail traders are net long USDCHF — a classic contrarian bearish signal. Seasonality also favors Swiss Franc strength in August. On the macro side, U.S. data is underwhelming: job growth has slowed, services PMI is soft, and inflation metrics (CPI, PCE) are cooling. This has increased expectations for a Fed rate cut later in the year. Meanwhile, the Swiss National Bank remains stable with no urgency to ease policy. Combined with global risk-off sentiment, capital is flowing into CHF, giving it an added edge over the dollar.

USDCHF - short opportunity with tight stopGiven the huge RR, please reduce the size of the position traded.
Levels on the chart.
Trade with care.
One more up to give internal divergence on 15/30 min macd is still possible, in other words we might be too early on this short, hence the advice to reduce the position.

BUY USDCHF 5.8.2025Confluence order: BUY at M15
Type of order: Limit order
Reason:
- The current top is not touching anything, expected to rise to the sub-key of H1 above.
- M15~FIBO 0,5-0,618 (same position)
Note:
- Management of money carefully at the last bottom (0,81005)
Set up entry:
- Entry buy at 0,80878
- SL at 0,80802
- TP1: 0,81005 (~1,5R)
- TP2: 0,81123 (~3R)
- TP3: 0,81299 (~5R)
Trading Method: Price action (No indicator, only trend and candles)

Market Analysis: USD/CHF Consolidates GainsMarket Analysis: USD/CHF Consolidates Gains
USD/CHF is rising and might aim for a move toward the 0.8120 resistance.
Important Takeaways for USD/CHF Analysis Today
- USD/CHF is showing positive signs above the 0.8040 resistance zone.
- There is a connecting bullish trend line forming with support at 0.7990 on the hourly chart.
USD/CHF Technical Analysis
On the hourly chart of USD/CHF at FXOpen, the pair started a decent increase from the 0.7910 support. The US Dollar climbed above the 0.8000 resistance zone against the Swiss Franc.
The bulls were able to pump the pair above the 50-hour simple moving average and 0.8040. A high was formed at 0.8079 and the pair is now consolidating gains above the 23.6% Fib retracement level of the upward move from the 0.7911 swing low to the 0.8079 high.
There is also a connecting bullish trend line forming with support at 0.7990. On the upside, the pair is now facing resistance near 0.8080. The main resistance is now near 0.8120.
If there is a clear break above the 0.8120 resistance zone and the RSI remains above 50, the pair could start another increase. In the stated case, it could test 0.8200. If there is a downside correction, the pair might test the 0.7990 level.
The first major support on the USD/CHF chart is near the 0.7950 level and the 76.4% Fib retracement level.
The next key support is near 0.7910. A downside break below 0.7910 might spark bearish moves. Any more losses may possibly open the doors for a move towards the 0.7850 level in the near term.
This article represents the opinion of the Companies operating under the FXOpen brand only. It is not to be construed as an offer, solicitation, or recommendation with respect to products and services provided by the Companies operating under the FXOpen brand, nor is it to be considered financial advice.

USDCHFUSD/CHF Bearish Bias — COT data shows rising CHF longs and declining USD longs, reflecting institutional bearish sentiment. Expecting downside continuation toward next demand zone.
USDCHF: Liquidity Trap Inside Daily ResistanceStep 1: Liquidity Sweep
Price aggressively swept the previous day's high, clearing buy-side liquidity.
Step 2: Break of Structure
Right after the sweep, we got a strong break of structure, confirming a bearish shift.
Step 3: Retracement into Imbalance
Price is now retracing into an unfilled imbalance left behind by the bearish impulse. This area becomes even more significant given the next point.
Step 4: Daily Resistance Confluence
This retracement is unfolding right at a key Daily resistance zone, adding strong higher-timeframe confluence. The likelihood of a reversal from this level increases sharply.
Step 5: Candle Confirmation
I’ll wait for clear signs of seller strength such as wick rejections, engulfing candles, or momentum shift before entering short. No confirmation, no trade.
🔔 Trade Plan
Bias: Short
Entry: Upon confirmation inside the imbalance
Invalidation: Break above the liquidity sweep high
TP: Lower liquidity pool

USDCHF BUY ANALYSISUSDCHF New Forecast👨💻👨💻
This is my personal trade and not in anyway a mandatory setup.
Note:
Follow proper risk management rules. Never risk more then 2% of your total capital. Money management is the key of success in this business...... Set your own SL & TP.
Please support this idea with a Like and COMMENT if you find it useful click "follow" on our profile if you will like these type of trading ideas delivered straight to your email in the future.
Thanks for your continued support!! lemme know your thoughts in the comment sec..

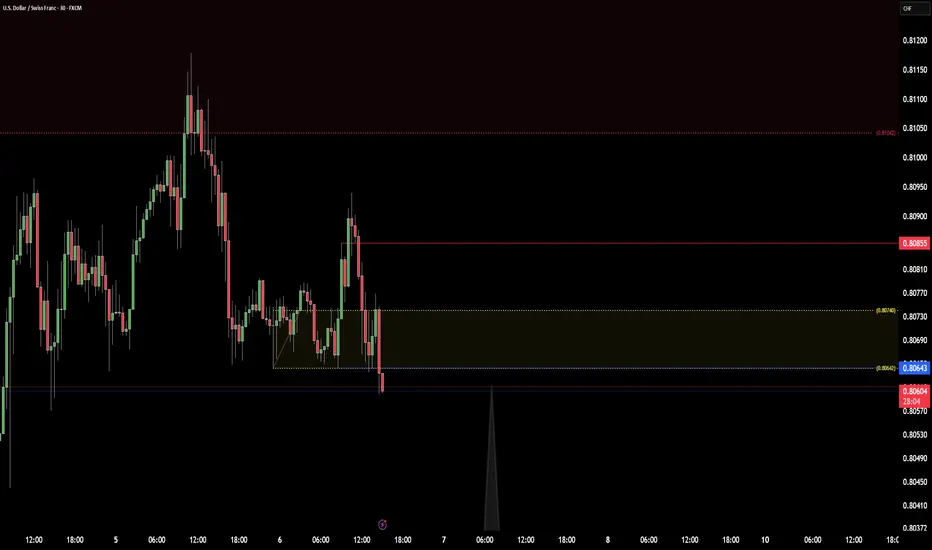
Usdchf We hv gotten our entry so we are waiting for price to go bearish I posted the analysis few hours ago

Daily Update 8/6/25 UCHFHello Traders! We did not get the large push to the draw I wanted. Price still ranges thus far. Let see if we can find a long Thursday below Asian, London, or NY opening price.
I still have a open mind about price pulling down into that BISI.

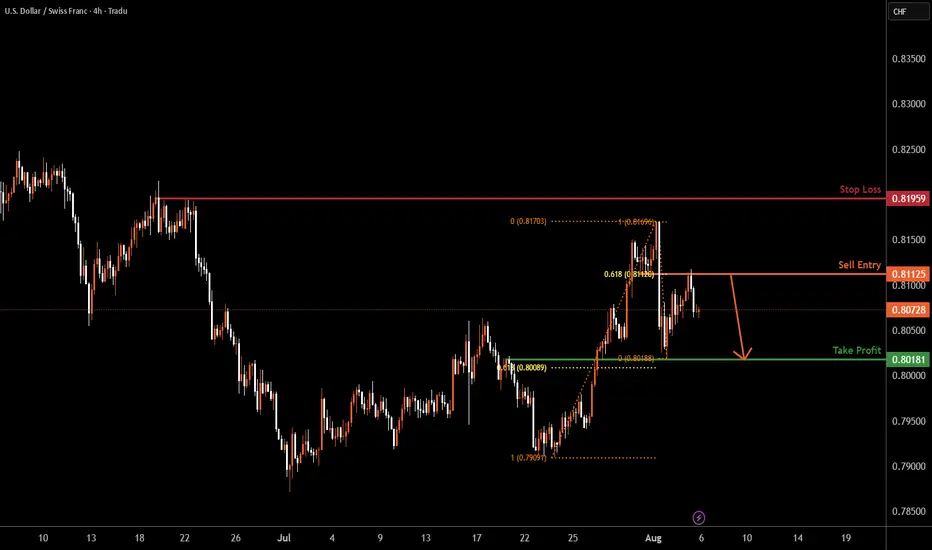
USDCHF H4 | Bearish dropUSD/CHF has rejected off the sell entry which is a pullback resistance that lines up with the 61.8% Fibonacci retracement and could potentially drop from this level to the take profit.
Sell entry is at 0.8112, which is a pullback resistance that lines up with the 61.8% Fibonacci retracement.
Stop loss is at 0.8195, which is a swing high resistance.
Take profit is at 0.8018, which is a pullback support that is slightly above the 61.8% Fibonacci retracement.
High Risk Investment Warning
Trading Forex/CFDs on margin carries a high level of risk and may not be suitable for all investors. Leverage can work against you.
Stratos Markets Limited (tradu.com ):
CFDs are complex instruments and come with a high risk of losing money rapidly due to leverage. 65% of retail investor accounts lose money when trading CFDs with this provider. You should consider whether you understand how CFDs work and whether you can afford to take the high risk of losing your money.
Stratos Europe Ltd (tradu.com ):
CFDs are complex instruments and come with a high risk of losing money rapidly due to leverage. 66% of retail investor accounts lose money when trading CFDs with this provider. You should consider whether you understand how CFDs work and whether you can afford to take the high risk of losing your money.
Stratos Global LLC (tradu.com ):
Losses can exceed deposits.
Please be advised that the information presented on TradingView is provided to Tradu (‘Company’, ‘we’) by a third-party provider (‘TFA Global Pte Ltd’). Please be reminded that you are solely responsible for the trading decisions on your account. There is a very high degree of risk involved in trading. Any information and/or content is intended entirely for research, educational and informational purposes only and does not constitute investment or consultation advice or investment strategy. The information is not tailored to the investment needs of any specific person and therefore does not involve a consideration of any of the investment objectives, financial situation or needs of any viewer that may receive it. Kindly also note that past performance is not a reliable indicator of future results. Actual results may differ materially from those anticipated in forward-looking or past performance statements. We assume no liability as to the accuracy or completeness of any of the information and/or content provided herein and the Company cannot be held responsible for any omission, mistake nor for any loss or damage including without limitation to any loss of profit which may arise from reliance on any information supplied by TFA Global Pte Ltd.
The speaker(s) is neither an employee, agent nor representative of Tradu and is therefore acting independently. The opinions given are their own, constitute general market commentary, and do not constitute the opinion or advice of Tradu or any form of personal or investment advice. Tradu neither endorses nor guarantees offerings of third-party speakers, nor is Tradu responsible for the content, veracity or opinions of third-party speakers, presenters or participants.
USD/CHFThis trade setup is based on volume analysis, Fibonacci retracement zones, and confirmation from the Stochastic oscillator to determine a strong long entry. The setup suggests a potential bullish move with favorable risk conditions.
Entry: 0.8082 area
Stop-Loss: 0.8044 area
Take-Profit: 0.8130 area
Risk-to-Reward Ratio: ~1:1.5
This idea capitalizes on a bounce from a key Fibonacci support level, where volume and momentum indicate buyer strength and trend continuation potential.
⚠️ Disclaimer:
This is not financial advice. Trading involves risk and may not be suitable for all investors. Always do your own research and apply proper risk management.
