USDCHF - Forecast | 04.202512.04.2025 | Investors blew away key support levels of the pair, rushing en masse into the Swiss Franc, and broke through the psychological mark of 0.82000 in a short period of time. This was due to the likely negative consequences for the US dollar and the economy as a whole from the impact of Trump's policies and his tariff actions. As the consequences are expected to be serious, in the medium term the US dollar will remain under pressure in this currency pair, at least until the end of April. However, a technical upward correction cannot be ruled out, which we will look at in the coming week.
Entry: 0.81800 - 0.81000 | Limits: 0.80300 - 0.79800 | Targets: 0.83600 - 0.84500
USDCHF trade ideas

USDCHF: Important Historic Structure Breakout 🇺🇸🇨🇭
USDCHF violated a significant weekly support cluster.
That breakout opens a potential for even more decline.
Get ready for the text of 0.8 level and a down movement further.
❤️Please, support my work with like, thank you!❤️
I am part of Trade Nation's Influencer program and receive a monthly fee for using their TradingView charts in my analysis.

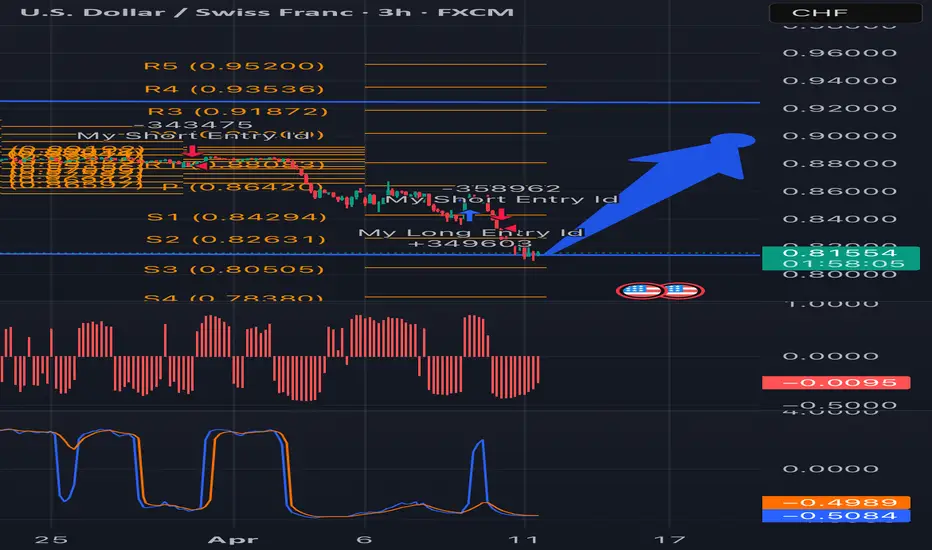
Trends and pivot points If you notice when you flip through time frames that pivots coincide they’re usually hit by price points. When rejected they tend to go to lower time frames in search of support or resistance.
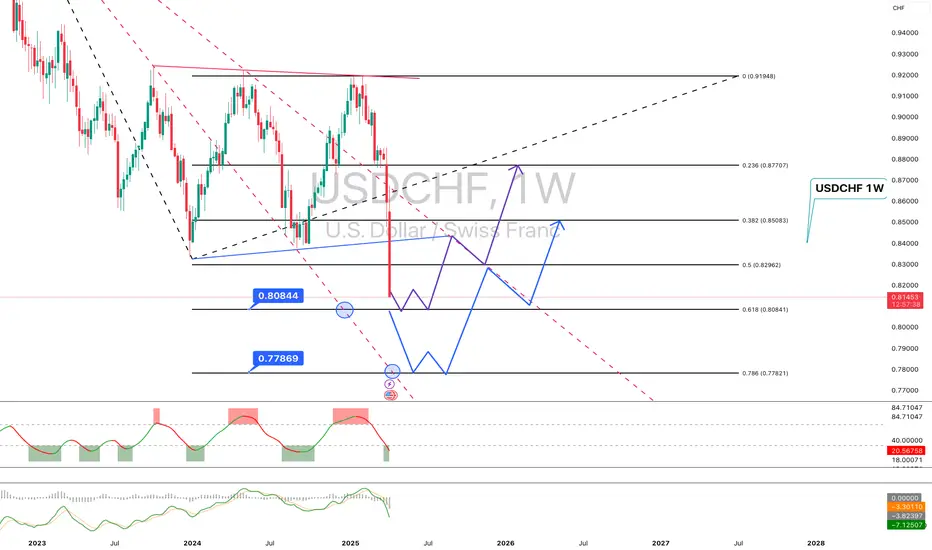
USDCHF (1W) – Preparing for a Potential ReversalThe chart shows strong bearish momentum, but price is approaching a potential demand zone, though it hasn't fully tested it yet. The main focus is on the 0.8080–0.8095 area, aligned with the 0.618 Fibonacci level — a key point where a bounce may occur.
Key Levels:
🔹 Buy Zone #1: 0.8080–0.8095
→ 0.618 Fibonacci, previous consolidation, and a potential reversal point
🔹 Buy Zone #2: 0.7780–0.7800
→ 0.786 Fibonacci, deeper support and lower boundary of the structure
Scenario:
The current structure hints at a possible W-pattern formation after a dip into the demand zone.
If the bullish scenario plays out, potential recovery targets include:
→ 0.8300–0.8500 – initial correction targets
→ 0.8770 – major resistance (Fibo 0.236)
Alternative View:
If price breaks below the 0.7780 level, the structure would shift bearish — next area of interest could form below 0.75.
USDCHF is in a wait-and-watch zone. The downward move continues, but key levels (especially 0.8080 and 0.7780) are worth watching as potential demand zones. There’s a high probability of a technical bounce or reversal setup developing once these zones are tested.
USDCHF this pair has been dropping and it has broken the old lows, we expect it to continue dropping as the dxy is also dropping, price has to retest first the support turned resistance to confirm our sells

USDCHF Wave Analysis – 10 April 2025
- USDCHF broke support zone
- Likely to fall to support level 0.8200
USDCHF currency pair recently broke the support zone between the key support level 0.8400 (which reversed the price multiple times in August and September) and the support trendline of the daily down channel from February.
The breakout of this support zone accelerated the active intermediate impulse wave (3).
USDCHF currency pair can be expected to fall to the next support level 0.8200, which is the target price for the completion of the active impulse wave (3).

90 day plan We’ve been on a range and DXY has a tendency to have breakouts worse than herpes so this to will pass and we should see a rise to a new monthly high

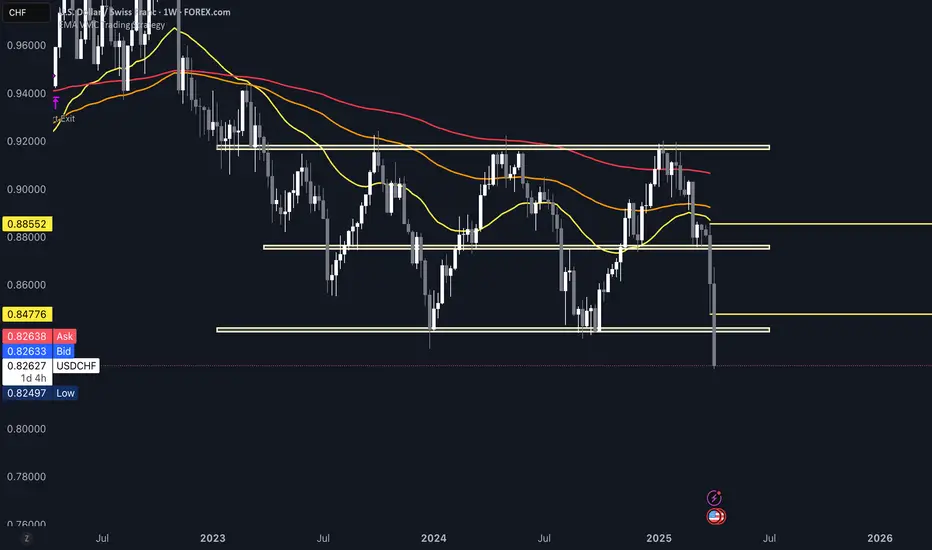
Will USDCHF Respect this support Again?USDCHF has reached the strong weekly support area and is trading in this box pattern will it pullback from this support area gain? let u see...

USDCHF significant break on weekly chart
looking for retest and downward continuation or rebound to previous known territory
USD/CHF drops to lowest since 2015The risk-off trade has just gathered pace. A few moments ago, gold hit a new record above $3175 as the dollar sold off, with the USD/CHF dropping to its weakest point since 2015 and stocks extending their drop on lingering trade war concerns.
With risk appetite fading once again, the USD/CHF could be heading down to 0.8000 handle from here, should the breakdown below the key 0.8330-0.8375 zone (now key resistance) holds.
Although the latest US inflation data came in weaker, it doesn't seem to be the main driver behind the dollar’s renewed decline — the greenback was already under pressure before the figures were released. The persistent uncertainty surrounding the trade war continues to weigh on sentiment, keeping the USD/CHF outlook tilted to the downside.
After yesterday’s BIG relief-driven rally, markets are back well in the red today, with the S&P some 6% lower at the time of writing. While Trump’s 90-day suspension of reciprocal tariffs sparked short-term optimism, the broader picture hasn't improved much. The 10% blanket tariff is still in effect, and cumulative duties on Chinese imports have climbed to a steep 125%. With Beijing likely to respond, the situation remains tense.
Investor caution lingers as the US struggles to secure meaningful trade deals with other key partners, including the EU.
Safe-haven flows into the Japanese yen and Swiss franc suggest that market sentiment remains shaky.
By Fawad Razaqzada, market analyst with FOREX.com

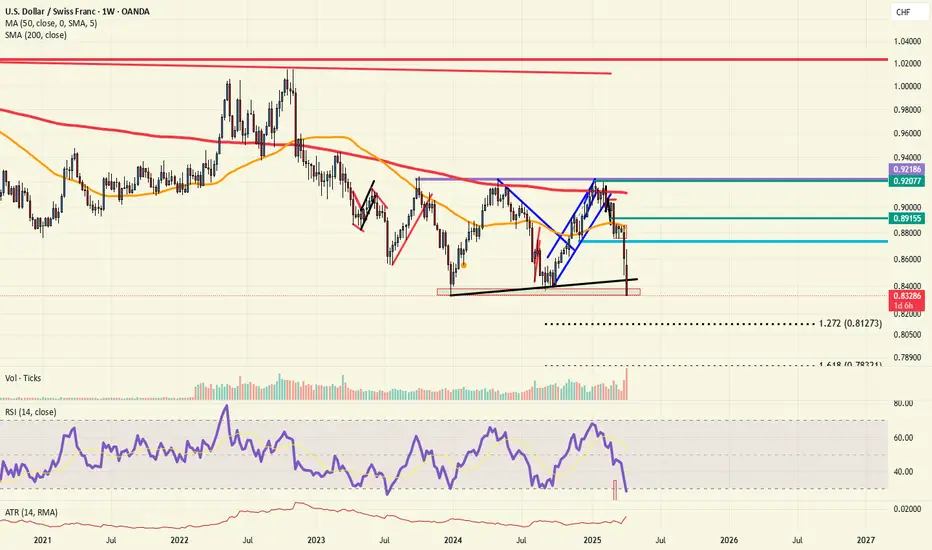
USDCHF testing long term supportIntraday Update: Long term, the USDCHF is testing the key support that has held since the end of 2024. A break of the .8300 level would put the .8127 level in play (longer term).
This is not uncharted territory, see 2011
USDCHF - BUYING OPPORTUNITYTeam, i do not trade very often on USDCHF
but i do watching when the price is right for enter
I am long position now.
Please review the chart carefully

USD/CHF For Bearishwait for pull-back near by entry point and then go short
you can ride the pull-back by go short with low lot size and take target between fibo levels 50 :61.8
general trend is down trend
have fun :)

USDCHF | 10.04.2025BUY 0.84600 | STOP 0.83500 | TAKE 0.86200 | A corrective movement within the range of price consolidation before going up and consolidating above 0.86000 level.

USDCHFUSDCHF price is near the support zone 0.83595. If the price cannot break through the 0.83595 level, it is expected that the price will rebound. Consider buying the red zone.
🔥Trading futures, forex, CFDs and stocks carries a risk of loss.
Please consider carefully whether such trading is suitable for you.
>>GooD Luck 😊
❤️ Like and subscribe to never miss a new idea!

USDCHF- Buy Idea - Weekly RangeUSDCHF is ranging at 1W time frame and is currently touching the weekly support level. Look to buy at the current price for an aggressive entry or wait for a candlestick confirmation for a precise enrty.

HIGH RISK TRADE USDCHF I have been looking a this one since NFP and think its ready to move up, lets see if i managed to pick out a good position here

USD/CHF H1 | Heading into a multi-swing-high resistanceUSD/CHF is rising towards a multi-swing-high resistance and could potentially reverse off this level to drop lower.
Sell entry is at 0.8617 which is a multi-swing-high resistance that aligns close to the 78.6% Fibonacci retracement.
Stop loss is at 0.8685 which is a level that sits above a swing-high resistance.
Take profit is at 0.8480 which is a pullback support.
High Risk Investment Warning
Trading Forex/CFDs on margin carries a high level of risk and may not be suitable for all investors. Leverage can work against you.
Stratos Markets Limited (tradu.com):
CFDs are complex instruments and come with a high risk of losing money rapidly due to leverage. 63% of retail investor accounts lose money when trading CFDs with this provider. You should consider whether you understand how CFDs work and whether you can afford to take the high risk of losing your money.
Stratos Europe Ltd (tradu.com):
CFDs are complex instruments and come with a high risk of losing money rapidly due to leverage. 63% of retail investor accounts lose money when trading CFDs with this provider. You should consider whether you understand how CFDs work and whether you can afford to take the high risk of losing your money.
Stratos Global LLC (tradu.com):
Losses can exceed deposits.
Please be advised that the information presented on TradingView is provided to Tradu (‘Company’, ‘we’) by a third-party provider (‘TFA Global Pte Ltd’). Please be reminded that you are solely responsible for the trading decisions on your account. There is a very high degree of risk involved in trading. Any information and/or content is intended entirely for research, educational and informational purposes only and does not constitute investment or consultation advice or investment strategy. The information is not tailored to the investment needs of any specific person and therefore does not involve a consideration of any of the investment objectives, financial situation or needs of any viewer that may receive it. Kindly also note that past performance is not a reliable indicator of future results. Actual results may differ materially from those anticipated in forward-looking or past performance statements. We assume no liability as to the accuracy or completeness of any of the information and/or content provided herein and the Company cannot be held responsible for any omission, mistake nor for any loss or damage including without limitation to any loss of profit which may arise from reliance on any information supplied by TFA Global Pte Ltd.
The speaker(s) is neither an employee, agent nor representative of Tradu and is therefore acting independently. The opinions given are their own, constitute general market commentary, and do not constitute the opinion or advice of Tradu or any form of personal or investment advice. Tradu neither endorses nor guarantees offerings of third-party speakers, nor is Tradu responsible for the content, veracity or opinions of third-party speakers, presenters or participants.

USD/CHF counter LongsIs still technically bearish territory from Daily perspective. But seeing sweep of lows from left with reaction upside. Could be early sign. But even still having bearish trend in mind, still need some pullback. And i see smth is cooking right now.
To get involved, like to see Asian Lows to be taken...

USDCHFUSDCHF is still in a downtrend. The price has a chance to test the support zone 0.84712-0.84064. If the price cannot break through the 0.84064 level, it is expected that the price will have a chance to rebound. Consider buying the red zone.
🔥Trading futures, forex, CFDs and stocks carries a risk of loss.
Please consider carefully whether such trading is suitable for you.
>>GooD Luck 😊
❤️ Like and subscribe to never miss a new idea!

USDCHF Daily Outlook – Smart Sell Opportunity AheadAfter a clean break and retest of the ascending trendline, USDCHF shows signs of weakness below the key supply zone — perfectly aligned with the 38.2–50% Fibonacci retracement.
🔻 My Bias: Bearish
I'm watching for a short-term pullback into the red zone (possible liquidity grab), followed by a strong continuation toward the next demand area.
💡 Why this setup matters: ✔️ Trendline break & retest
✔️ Strong bearish momentum
✔️ Fibonacci confluence
✔️ Supply zone reaction
🧠 Patience = Profits. Entry should be planned with precision.

USDCHF's 4H Bullish Structure Break – Is It Time to Buy?After a bearish phase, the USDCHF has turned its momentum around following Trump's announcement of a 90-day tariff pause. This news injected fresh optimism into the markets, triggering a rally that overturned previous downtrends. On the four-hour chart, we observe a break of structure that hints at a bullish reversal. The ideal entry point appears to be the pullback to the 50% Fibonacci retracement level—a historically reliable support zone—setting up a clean long opportunity. Current market sentiment, bolstered by easing geopolitical tensions and renewed risk appetite, supports this bullish outlook. As always, use appropriate risk management strategies and treat this analysis as a trade idea rather than financial advice. 🚀📈💹

Bearish reversal off pullback resistance?USD/CHF is rising towards the resistance level which is a pullback resistance that is slightly above the 50% Fibonacci retracement and could reverse from this level to our take profit.
Entry: 0.8617
Why we like it:
There is a pullback resistance that is slightly above the 50% Fibonacci retracement.
Stop loss: 0.8673
Why we like it:
There is a pullback resistance level that is slightly above the 61.8% Fibonacci retracement.
Take profit: 0.8478
Why we like it:
There is a pullback support level.
Enjoying your TradingView experience? Review us!
Please be advised that the information presented on TradingView is provided to Vantage (‘Vantage Global Limited’, ‘we’) by a third-party provider (‘Everest Fortune Group’). Please be reminded that you are solely responsible for the trading decisions on your account. There is a very high degree of risk involved in trading. Any information and/or content is intended entirely for research, educational and informational purposes only and does not constitute investment or consultation advice or investment strategy. The information is not tailored to the investment needs of any specific person and therefore does not involve a consideration of any of the investment objectives, financial situation or needs of any viewer that may receive it. Kindly also note that past performance is not a reliable indicator of future results. Actual results may differ materially from those anticipated in forward-looking or past performance statements. We assume no liability as to the accuracy or completeness of any of the information and/or content provided herein and the Company cannot be held responsible for any omission, mistake nor for any loss or damage including without limitation to any loss of profit which may arise from reliance on any information supplied by Everest Fortune Group.
