USD/CHF - Bearish Flag (24.07.2025)The USD/CHF Pair on the M30 timeframe presents a Potential Selling Opportunity due to a recent Formation of a Bearish Flag Pattern. This suggests a shift in momentum towards the downside in the coming hours.
Possible Short Trade:
Entry: Consider Entering A Short Position around Trendline Of The Pattern.
Target Levels:
1st Support – 0.7878
2nd Support – 0.7855
🎁 Please hit the like button and
🎁 Leave a comment to support for My Post !
Your likes and comments are incredibly motivating and will encourage me to share more analysis with you.
Best Regards, KABHI_TA_TRADING
Thank you.
Disclosure: I am part of Trade Nation's Influencer program and receive a monthly fee for using their TradingView charts in my analysis.
USDCHF trade ideas

USDCHFthere was a strong down trend going on and I am observing a Wycoff pattern forming up here.
putting a sell limit here for a tp 2

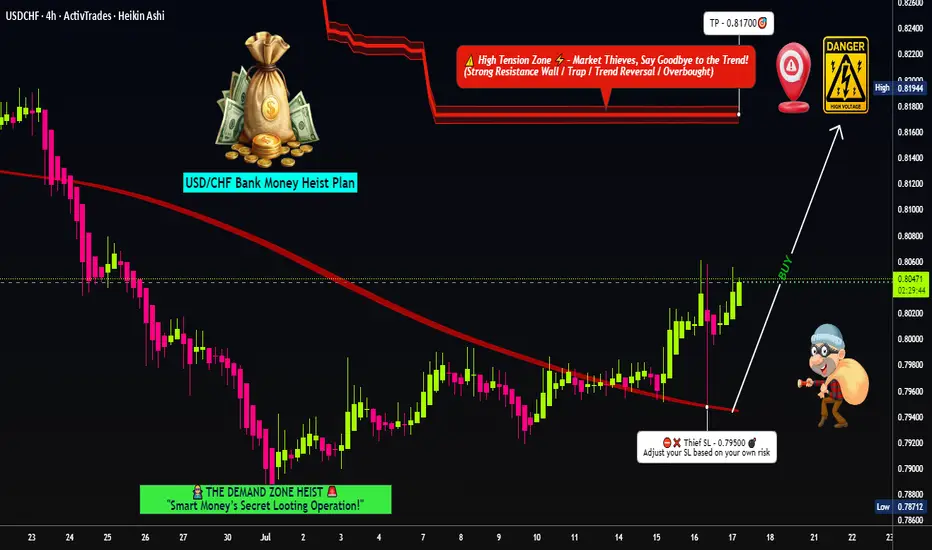
USD/CHF Swissie Heist Plan: Rob the Trend, Ride the Bull!🔐💰 USD/CHF Swissie Forex Heist 💰🔐
“Rob the Trend, Escape the Trap – Thief Style Day/Swing Master Plan”
🌎 Hola! Hello! Ola! Marhaba! Bonjour! Hallo!
Dear Market Looters, Swing Snipers & Scalping Shadows, 🕶️💼💸
Welcome to another elite Thief Trading Operation, targeting the USD/CHF "SWISSIE" vault with precision. Based on sharp technical blueprints & macroeconomic footprints, we're not just trading – we're executing a Forex Bank Heist.
This robbery mission is based on our day/swing Thief strategy – perfect for those who plan, act smart, and love stacking pips like bricks of cash. 💵🧱
💹 Mission Brief (Trade Setup):
🎯 Entry Point – Open the Vault:
Swipe the Bullish Loot!
Price is prepped for an upside raid – jump in at any live price OR set smart Buy Limit orders near the 15m/30m recent pullback zones (last swing low/high).
Use DCA / Layering for better entries, thief-style.
🧠 Thief Logic: Let the market come to you. Pullbacks are entry doors – robbers don’t rush into traps.
🛑 Stop Loss – Exit Strategy If Caught:
📍 Primary SL: Below recent swing low on the 4H chart (around 0.79500)
📍 Adjust based on lot size, risk, and number of stacked entries.
This SL isn’t your leash – it’s your getaway route in case the plan backfires.
🏴☠️ Profit Target – Escape Before the Cops Arrive:
🎯 Target Zone: 0.81700
(Or dip out earlier if the vault cracks fast – Robbers exit before alarms trigger!)
📌 Trailing SL recommended as we climb up the electric red zone.
🔥 Swissie Heist Conditions:
📈 USD/CHF showing upward bias based on:
Momentum shift
Reversal zone bounce
Strong USD sentiment & macro factors
✅ COT positioning
✅ Intermarket correlations
✅ Sentiment & Quant data
➡️ Do your fundamental recon 🔎
⚔️ Scalpers – Here's Your Mini-Mission:
Only play LONGS. No counter-robbing.
💸 Big bags? Enter with aggression.
💼 Small stack? Follow the swing crew.
💾 Always trail your SL – protect the stash.
🚨 News Alert – Avoid Laser Alarms:
🗓️ During high-volatility releases:
⚠️ No new trades
⚠️ Use trailing SLs
⚠️ Watch for spikes & fakeouts – the vault traps amateurs
💣 Community Boost Request:
If this plan helps you loot the market:
💥 Smash that Boost Button 💥
Let’s strengthen the Thief Army 💼
The more we grow, the faster we move, and the deeper we steal. Every like = one more bulletproof trade.
#TradeLikeAThief 🏆🚨💰
📌 Legal Escape Note:
This chart is a strategic overview, not personalized advice.
Always use your judgment, manage risk, and review updated data before executing trades.
📌 Market is dynamic – so keep your eyes sharp, your plan tighter, and your strategy ruthless.
🕶️ Stay dangerous. Stay profitable.
See you soon for the next Forex Vault Hit.
Until then – Lock. Load. Loot.
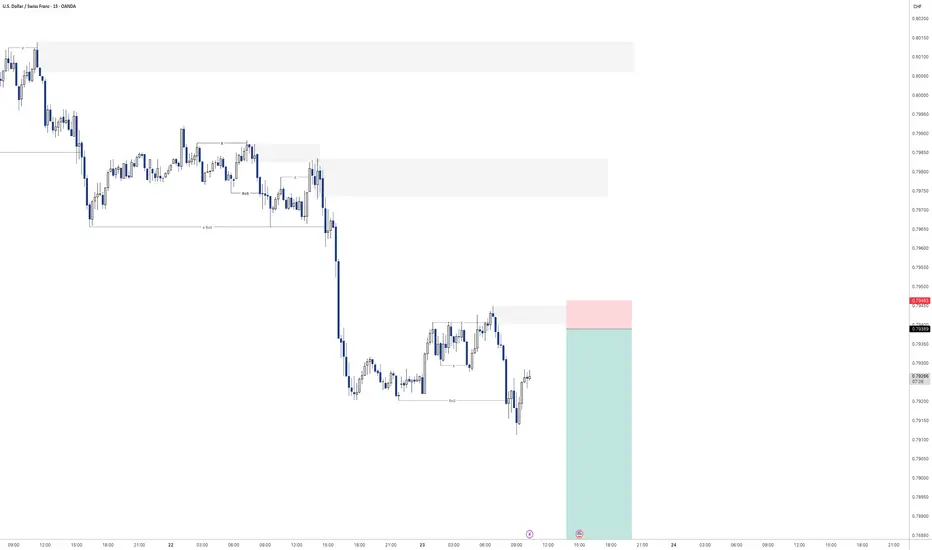
USD/CHF WATCHING🔍 USD/CHF – Watching for Pullback Setup
We’re monitoring USD/CHF for a potential pullback into a strong S/R zone.
Here’s what we need to see before considering entry:
✅ Volume increasing in the direction of the setup
✅ Momentum rising, then hooking down in alignment
✅ A clean engulfing candle at the zone for the trigger
If all criteria align, we’ll drop to the 1H chart to fine-tune the entry per VMS strategy rules.
📌 We don’t guess—we prepare. The trade either fits the strategy, or it doesn’t.

USDCHF Outlook: Further Downside Expected Next WeekUSDCHF is likely to continue its bearish momentum in the coming week. Technical signals suggest that the pair could drop further, potentially heading toward the 0.779 support zone. Traders should monitor for confirmation signals before entering short positions.

Where is USD/CHF heading?
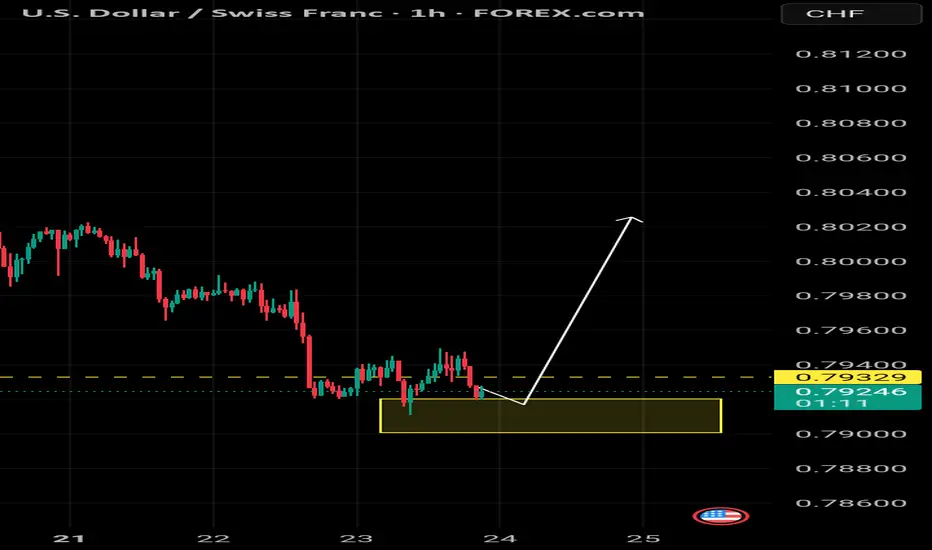
🔸 Yellow Zone in Focus
The yellow area represents a critical support level. As long as the price holds above this zone, a strong upward move is expected in the coming days.
⚠️ A break below this area would invalidate the bullish scenario and may signal the start of a downtrend.
USDCHF is Attempting to Break the Trend!!Hey Traders, in today's trading session we are monitoring USDCHF for a selling opportunity around 0.79720 zone, USDCHF was trading in an uptrend and currently seems to be attempting to break it out. If we get dips below the trend i will be looking for a retrace towards more lows.
Trade safe, Joe.

USDCHF sellUSD/CHF is currently in a downtrend, with the US Dollar exhibiting weakness throughout the year. From a technical standpoint, the pair appears poised for further decline, given the formation of a bearish flag. If considering this trade, it's essential to prioritize risk management or look for a potential retest of the flag's resistance level (or the apex of an ascending wedge, if applicable) before entering a short position.

USDCHFPossible move to the down side. Waiting for a retracement around the 0.79650 zone before we go short.
@musehanezwothe
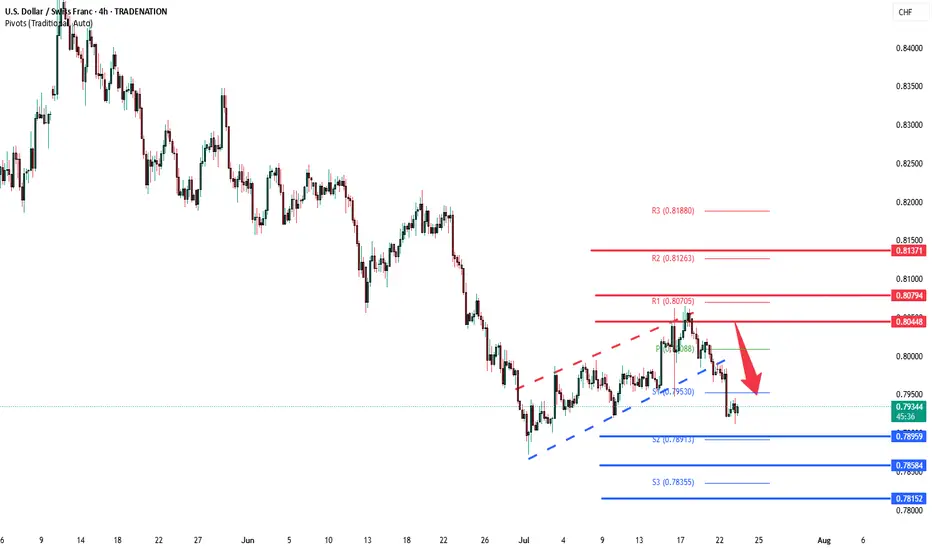
USDCHF extension to the downside The USD/CHF pair is currently trading with a bearish bias, aligned with the broader downward trend. Recent price action shows a retest of the falling resistance, suggesting a temporary relief rally within the downtrend.
Key resistance is located at 0.8045, a prior consolidation zone. This level will be critical in determining the next directional move.
A bearish rejection from 0.8045 could confirm the resumption of the downtrend, targeting the next support levels at 0.7900, followed by 0.7860 and 0.7810 over a longer timeframe.
Conversely, a decisive breakout and daily close above 0.8045 would invalidate the current bearish setup, shifting sentiment to bullish and potentially triggering a move towards 0.8080, then 0.8140.
Conclusion:
The short-term outlook remains bearish unless the pair breaks and holds above 0.8045. Traders should watch for price action signals around this key level to confirm direction. A rejection favours fresh downside continuation, while a breakout signals a potential trend reversal or deeper correction.
This communication is for informational purposes only and should not be viewed as any form of recommendation as to a particular course of action or as investment advice. It is not intended as an offer or solicitation for the purchase or sale of any financial instrument or as an official confirmation of any transaction. Opinions, estimates and assumptions expressed herein are made as of the date of this communication and are subject to change without notice. This communication has been prepared based upon information, including market prices, data and other information, believed to be reliable; however, Trade Nation does not warrant its completeness or accuracy. All market prices and market data contained in or attached to this communication are indicative and subject to change without notice.
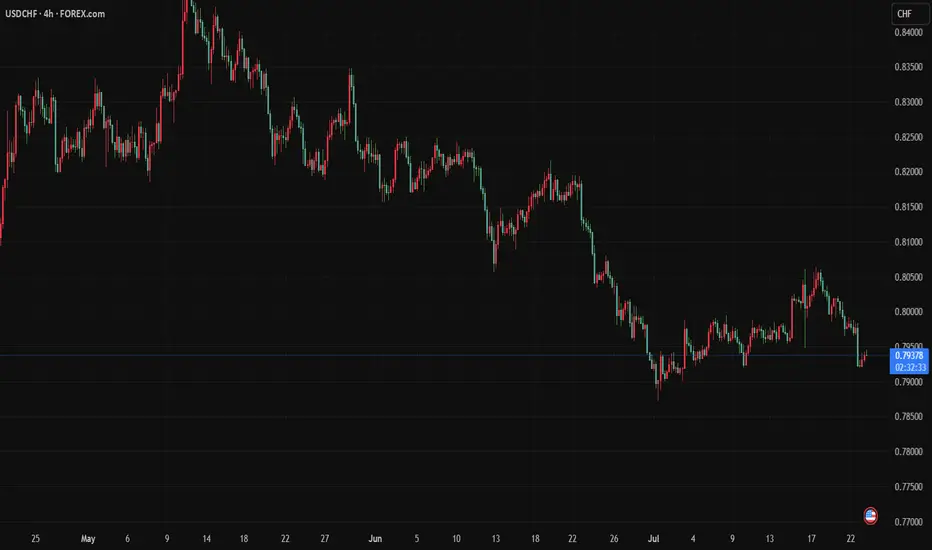
USDCHF - Sell off continuation?Looking for continuation of the selling pressure here on USDCHF
Will see how we play out for the rest of the day
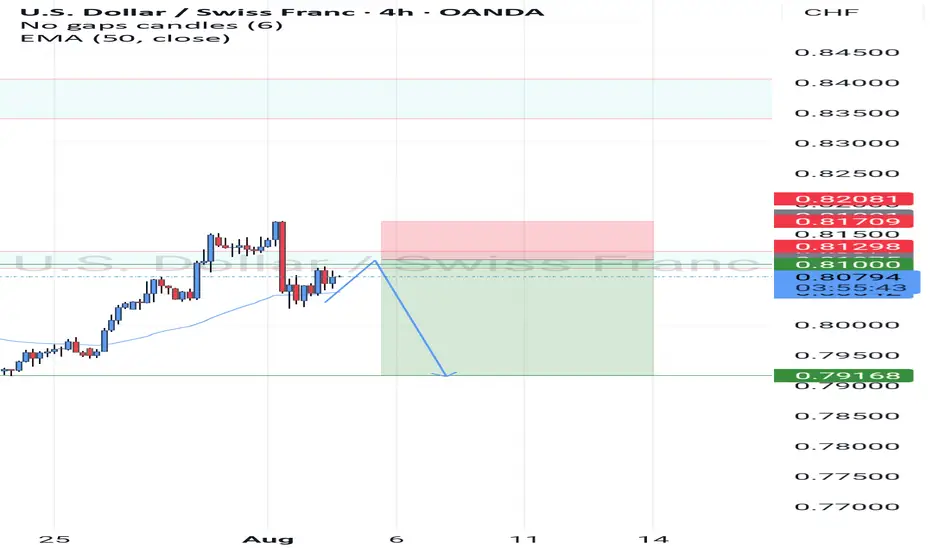
USDCHF – Two Levels, One PlanWe’re watching two key resistance zones for a potential short.
If the first level holds and gives a signal, we’ll short from there.
If that level breaks, we may switch to a short-term buy up to the next level.
Once price reaches the second resistance, we’ll be ready for another sell opportunity.
No predictions — just following the flow.

Lingrid | USDCHF Corrective Move and Bearish ContinuationThe price perfectly fulfills my previous idea . FX:USDCHF is weakening after printing a lower high beneath the resistance zone and rejecting the confluence of the downward trendline and horizontal supply near 0.80079. The structure remains bearish despite short-term corrective moves, as each rally stalls below previous highs. Price is at risk of rolling over again, aiming for the 0.78300 support if the 0.80000 area holds as resistance. Sellers remain in control as long as the pair trades below the red trendline.
📉 Key Levels
Sell trigger: Rejection below 0.80000
Sell zone: 0.79800–0.80100
Target: 0.78300
Invalidation: Close above 0.80150
💡 Risks
Bullish breakout above the descending trendline
Momentum divergence on intraday timeframes
Broader USD strength recovery
If this idea resonates with you or you have your own opinion, traders, hit the comments. I’m excited to read your thoughts!

USD/CHF Update: Missed the Last Short? Grab the New Trigger!Yo traders and market lovers, it’s Skeptic from Skeptic Lab! Here’s a quick USD/CHF update: my last short trigger after the support break gave us a 50-pip drop . With a solid stop loss, you’re likely sitting on a 2:1 R/R; risk-takers might even be at 5:1. I’m breaking down a fresh trigger in this video—don’t miss it! Drop your thoughts or coin requests in the comments, give it a boost if it helped , and don’t miss my educational post coming tonight on Skeptic Lab’s TradingView page with lessons from my first 100 trades—it’s gonna be fire. Catch you tonight! 😎


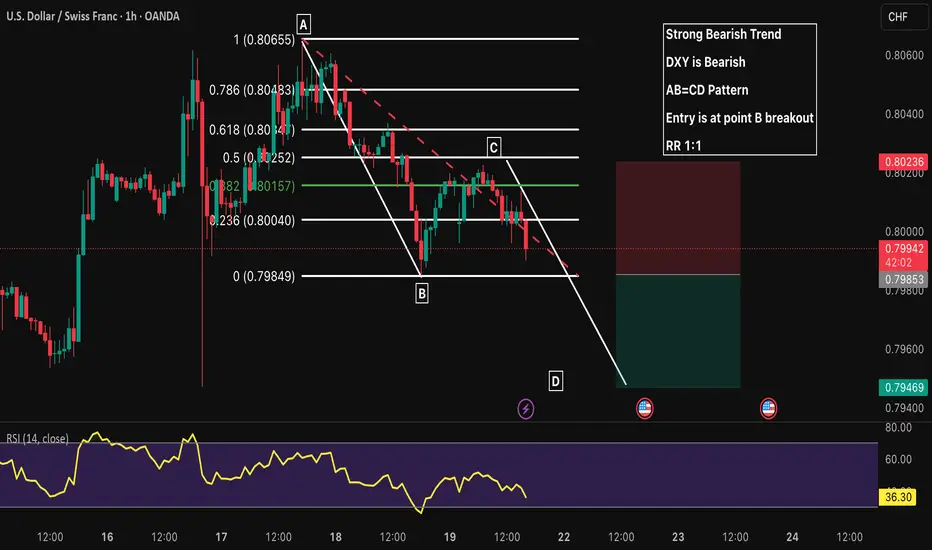
USDCHF 1H Short Strong Bearish Trend
DXY is Bearish
AB=CD Pattern
Entry is at point B breakout
RR 1:1
PIPS DEE TEISII'll like to achieve all my dreams through trading the market nor matter how difficulty could be the aim is to built a future in the long term run...
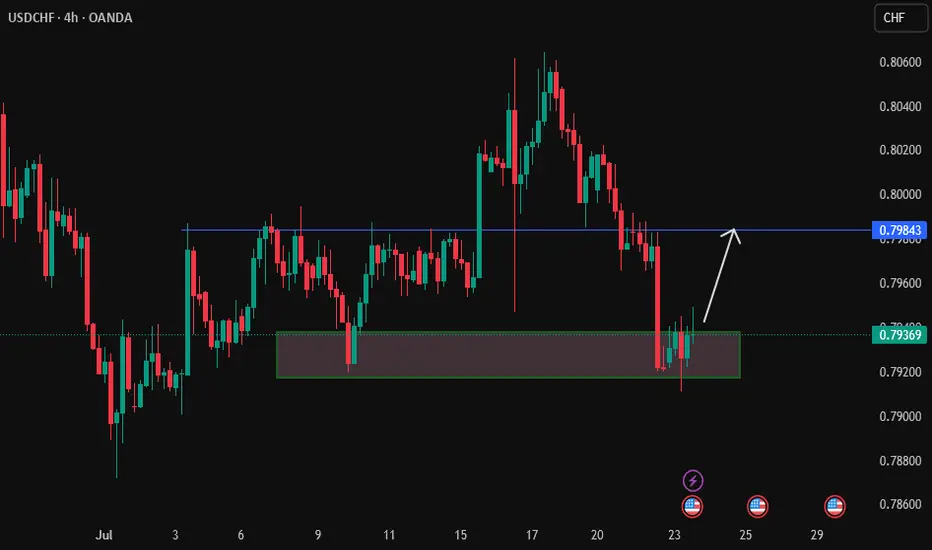
USDCHF looking Bearish!!USDCHF Looking for sell side as it holding at trendline support.
Safe Player go after breaking trendline and risky can look out for now before the US Session.
Support Zone is 0.79200, We can expect a buy from that zone or Buys above 0.79900 after breaking and retesting the resistance.

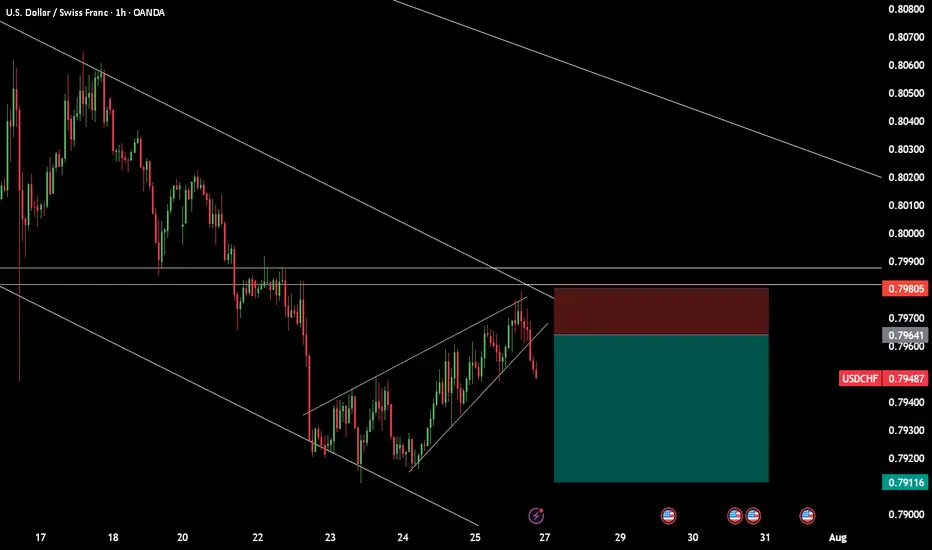
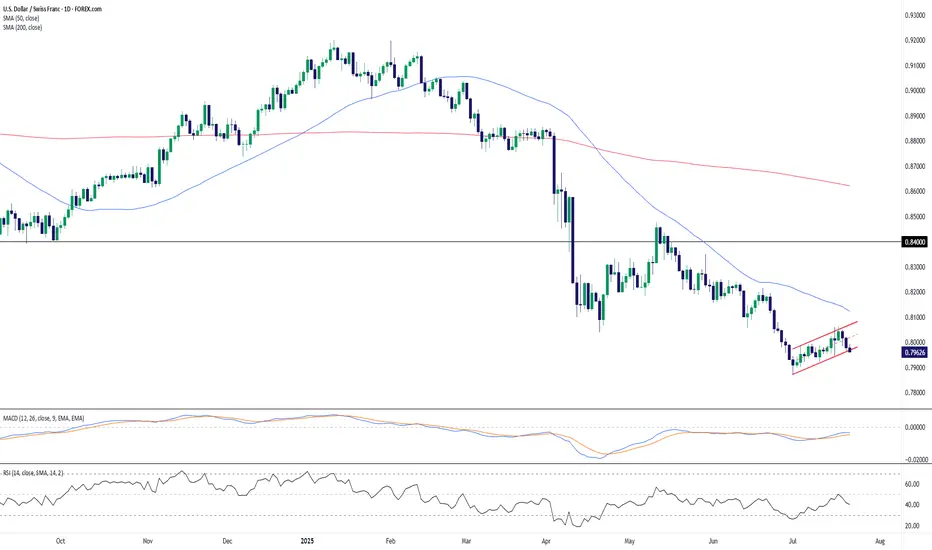
USD/CHF – Bearish Flag Forms Below Resistance, Trend Still DownUSD/CHF remains under pressure after a sustained downtrend and is currently consolidating within a potential bearish flag pattern. Price action has carved out a rising channel after the sharp June selloff, but the structure appears corrective rather than impulsive—suggesting the dominant bearish trend may soon resume.
The pair is struggling to hold the 0.7950–0.8000 zone and trades below both the 50-day (0.8124) and 200-day (0.8621) SMAs, confirming a bearish market structure. Momentum indicators also lean bearish: the MACD is below zero and has begun to curl lower again, while RSI hovers near 40, not yet oversold but lacking bullish momentum.
A breakdown below the flag’s lower boundary would confirm the continuation pattern, exposing 0.7900 initially, with scope toward fresh multi-month lows. On the upside, a close above 0.8100 would challenge the flag’s validity and place the 50-day SMA in focus as resistance.
Bias: Bearish continuation favored unless price breaks and holds above 0.8100. Flag breakdown would reconfirm downside momentum.
Time frame: Short-term (days)
-MW
USDCHFI see a wycoff pattern here that interests me into opening a short position after creating the identified phases. shooting for a tp 2 here.

Usdchf As we can see we hv price creating more lower high and lower low so we are expecting a retracment and a change of structure on the 4h then we sell
USDCHFHello Trader
I expect the price to start growing from these areas
The stop loss for this scenario is also visible in the image above❌
I hope you make the most of it...
