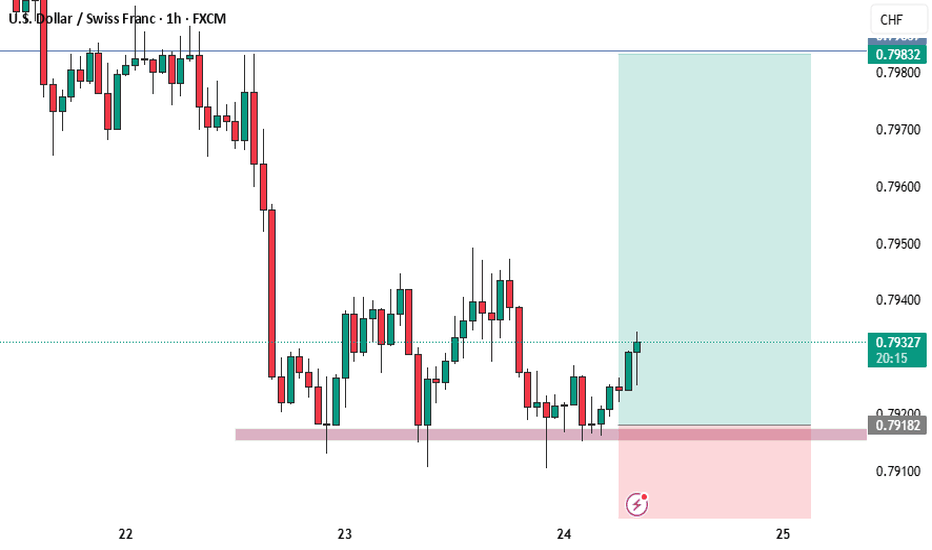
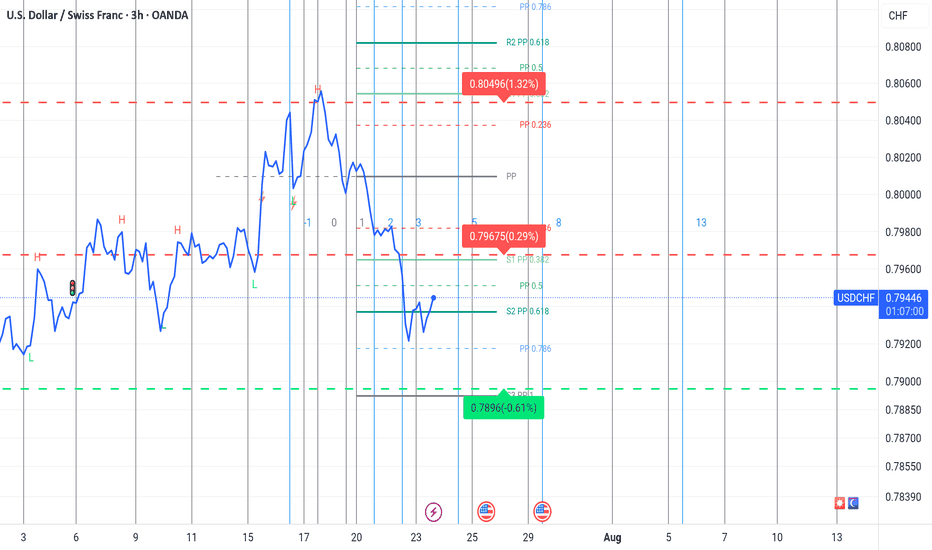
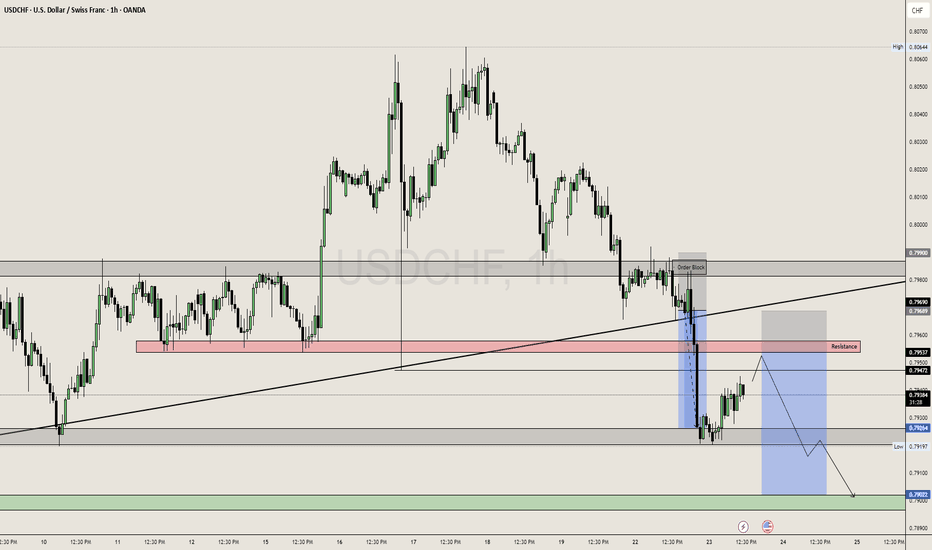
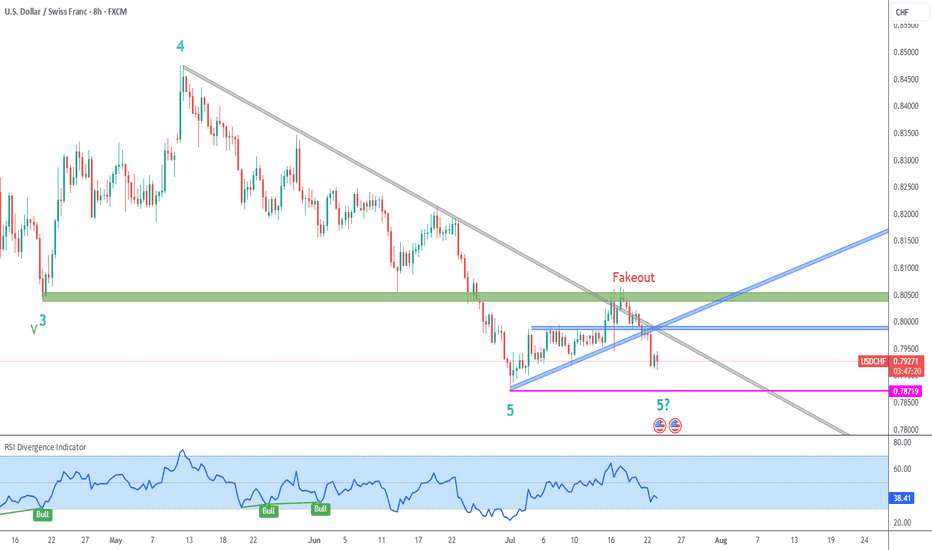
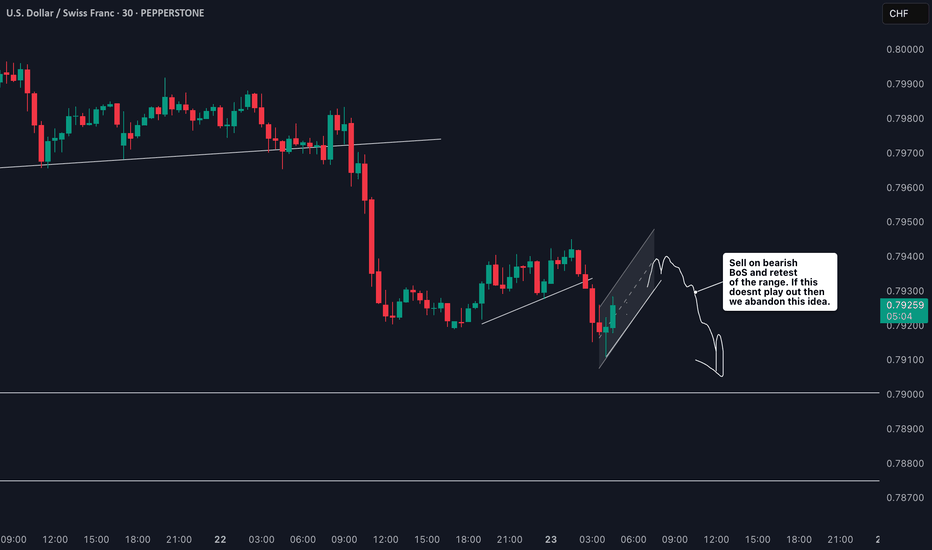
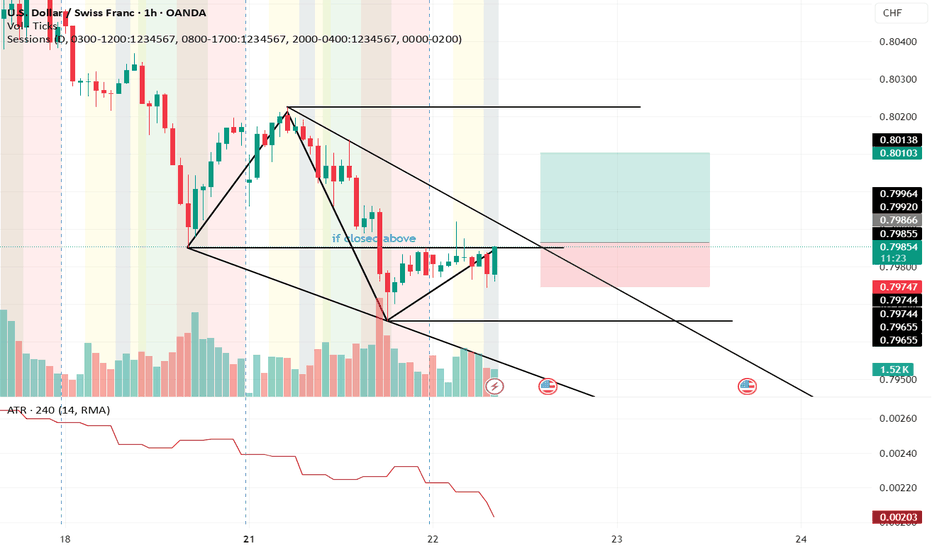
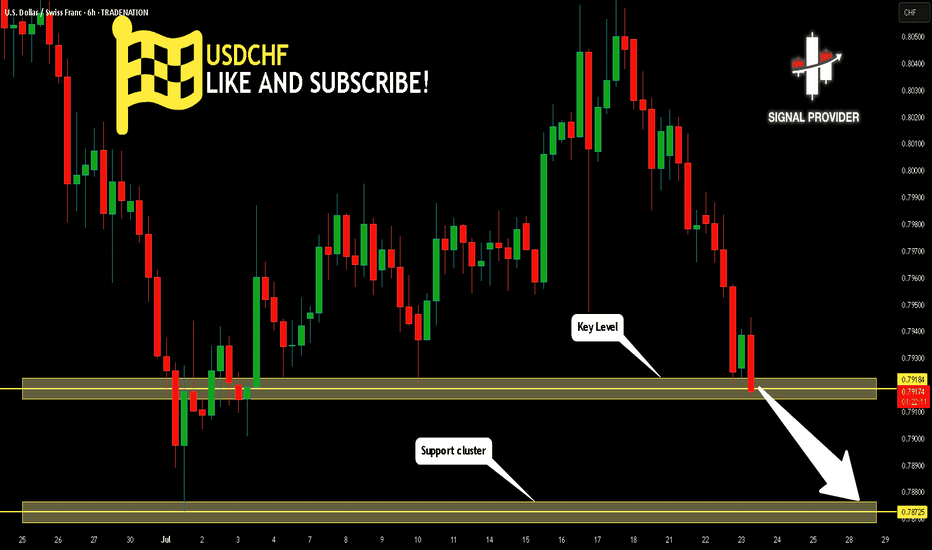
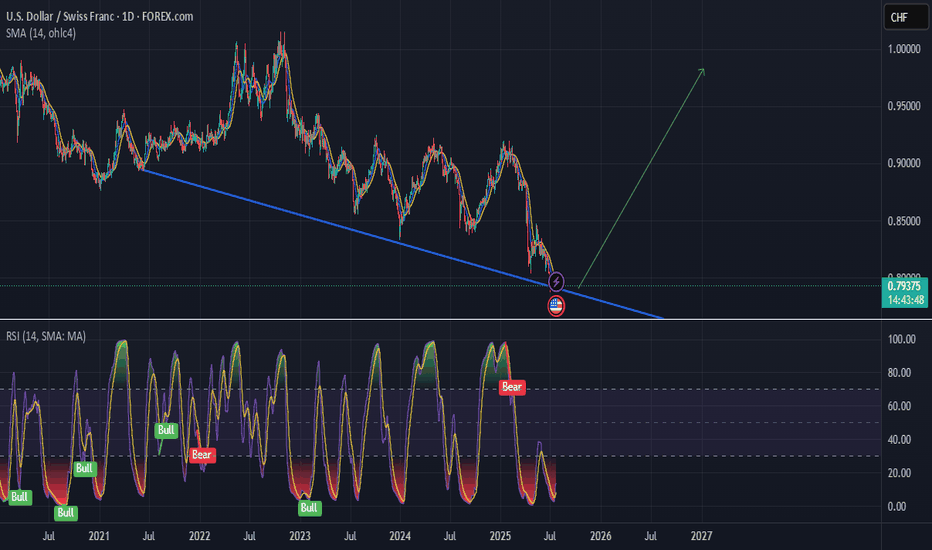
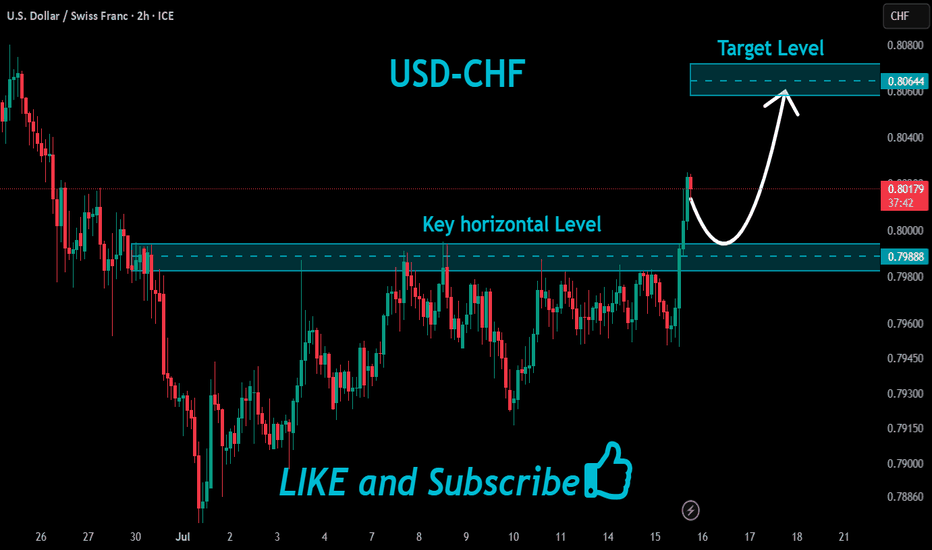
USDCHF – Bullish Target in SightUSDCHF – Bullish Target in Sight
🟢 Long Bias | 🎯 Target: 0.83056 | ⏳ Deadline: April 30
Momentum remains intact after a clean rally. With price consolidating beneath resistance, I’m watching for a push toward the 0.83056 key target.
I'm in. Will hold and add position as needed.
💡 All trades can be replayed on TradingView for confirmation.
No financial advice, just sharing my trades.
#USDCHF #ForexSetup #MarketAnalysis #GlobalHorns #TradingView
USDCHF trade ideas
USDCHF Zigzag Corrective Rally Expected to FailThe USDCHF currency pair has been trending downward since its high on January 13, 2026. The pair follows a pattern known as a 5-wave impulse in Elliott Wave analysis. This pattern helps traders predict price movements by breaking them into distinct waves. Starting from the peak, the first wave (wave 1) saw the pair drop to 0.8965. After this decline, a brief recovery, or wave 2, pushed the price back up to 0.9196. From there, the pair resumed its downward trajectory in wave 3, which unfolded in several stages.
In wave 3, the price first fell to 0.8356, marking the end of an internal sub-wave (wave ((i))). A small bounce to 0.8583 completed wave ((ii)). The decline continued, with wave ((iii)) reaching 0.8096, followed by a slight rally to 0.8203 for wave ((iv)). The final leg of wave 3, wave ((v)), bottomed out at 0.803, wrapping up the third wave.
Currently, USDCHF is in an upward correction in wave 4, which is taking the shape of a zigzag pattern. From the low at 0.803, the pair climbed to 0.8124 in wave (i). Pair dipped to 0.8066 in wave (ii) then rose again to 0.8286 in wave (iii). A pullback to 0.8194 marked wave (iv), and the final push to 0.8311 completed wave ((a)), the first part of wave 4. Right now, the pair is experiencing a short-term pullback, called wave ((b)), correcting the rise that began on April 21, 2025. As long as the key support level at 0.8036 remains intact, USDCHF is expected to resume its upward movement soon, potentially reaching higher levels before the next major trend develops.
USDCHF... 1H CHART PATTERNI am considering selling **USD/CHF at 0.82529** with a **take profit (TP) at 0.82300** — that’s a short position targeting a **~22.9 pip** gain. Let's break it down quickly:
### 🔍 Trade Overview:
- **Pair**: USD/CHF
- **Position**: Sell (short)
- **Entry**: 0.82529
- **TP**: 0.82300
- **Pip Gain**: ~22.9 pips
### ✅ Considerations Before Entering:
1. **Trend**: Is USD/CHF in a downtrend on the higher timeframes (H4, D1)?
2. **Support Area**: 0.82300 — does this align with a recent support zone?
3. **News/Events**: Any CHF or USD news coming up? (Like SNB or Fed speakers, inflation, etc.)
4. **Volume & Momentum**: Is momentum currently bearish? Look at RSI/Volume or MACD if you're using indicators.
5. **Stop Loss**: What’s your SL? Risk-reward is key — ideally at least 1:1.
### 🔒 Risk Management:
If you don’t have a stop loss yet, maybe set one above the recent swing high (like 0.82650 or above depending on market structure).
USDCHF BULLISHTrade Setup Details for USD/CHF (4H Chart)
Overview
Pair: USD/CHF (US Dollar / Swiss Franc)
Timeframe: 4H (4-hour chart)
Date of Analysis: April 23, 2022
Current Price: 0.82920 (as shown on the chart)
Market Sentiment: Bullish (indicated by "Bullish Divergence" on the RSI)
Trade Setup
Trade Type: Buy
Entry Point: 0.82792
The entry is marked just above the recent low, suggesting a potential reversal after the price broke below a descending trendline and retested a key support zone around 0.82790–0.82960.
Stop Loss: 0.80312
The stop loss is placed below the recent swing low, providing a buffer against further downside. This gives a risk of approximately 248 pips from the entry point.
Take Profit: 0.85265
The take profit is set at a key resistance level, aligning with previous highs around 0.85265. This offers a potential reward of approximately 247 pips from the entry point.
Risk-to-Reward Ratio: Approximately 1:1 (247 pips reward / 248 pips risk)
Technical Analysis
Price Action: The price has been in a downtrend, as indicated by the descending trendline. However, a break below this trendline followed by a retest suggests a potential reversal. The price is now approaching a key support zone between 0.82790 and 0.82960.
Support/Resistance:
Support: 0.82790–0.82960 (recent price action shows a bounce from this zone).
Resistance: 0.85265 (previous high, marked as the take profit level).
Indicators:
RSI (Relative Strength Index): The RSI is at 52.61, showing neutral momentum. However, a "Bullish Divergence" is noted, where the price made a lower low, but the RSI formed a higher low, indicating weakening bearish momentum and a potential reversal.
The RSI is also trending upward, supporting the bullish outlook.
Trendline: The descending trendline (drawn on the chart) has been broken, and the price is retesting this breakout area, which often acts as support after a breakout.
Trade Rationale
The setup is based on a combination of price action and technical indicators:
The break of the descending trendline suggests the downtrend may be losing steam.
Bullish divergence on the RSI indicates a potential reversal, as momentum shifts in favor of buyers.
The price is approaching a key support zone, which has historically held, increasing the likelihood of a bounce.
The take profit at 0.85265 aligns with a significant resistance level, providing a logical target for the trade.
Risk Management
The stop loss at 0.80312 ensures that the trade is invalidated if the price continues to decline significantly, protecting against larger losses.
Traders should consider position sizing to ensure the 248-pip risk aligns with their risk tolerance (e.g., risking 1–2% of their account on this trade).
Additional Notes
Monitor for confirmation of the reversal, such as a strong bullish candlestick pattern (e.g., engulfing or pin bar) at the support zone.
Be cautious of any fundamental news (e.g., US or Swiss economic data) that could impact USD/CHF volatility during the trade.
USDCHF INTRADAY bearish below 0.8300Recent price action in USDCHF suggests an oversold bounce, with resistance capping gains at the 0.8300 level.
The continuation of selling pressure could extend the downside move, with key support levels at 0.8090, followed by 0.8040 and 0.7940.
Alternatively, a confirmed breakout above 0.8300, accompanied by a daily close higher, would invalidate the bearish outlook. In this scenario, USDCHF could target 0.8365, with further resistance at 0.8450 and 0.8520.
Conclusion:
The price remains below pivotal level, with 0.8300 acting as a key resistance. Failure to break above this level could reinforce downside risks, while a breakout could shift momentum back in favour of bulls. Traders should watch for confirmation signals before positioning for the next move.
This communication is for informational purposes only and should not be viewed as any form of recommendation as to a particular course of action or as investment advice. It is not intended as an offer or solicitation for the purchase or sale of any financial instrument or as an official confirmation of any transaction. Opinions, estimates and assumptions expressed herein are made as of the date of this communication and are subject to change without notice. This communication has been prepared based upon information, including market prices, data and other information, believed to be reliable; however, Trade Nation does not warrant its completeness or accuracy. All market prices and market data contained in or attached to this communication are indicative and subject to change without notice.
USDCHF: Bearish Forecast & Bearish Scenario
Balance of buyers and sellers on the USDCHF pair, that is best felt when all the timeframes are analyzed properly is shifting in favor of the sellers, therefore is it only natural that we go short on the pair.
Disclosure: I am part of Trade Nation's Influencer program and receive a monthly fee for using their TradingView charts in my analysis.
❤️ Please, support our work with like & comment! ❤️
USDCHF likely to continue its bearish trendprice has completed its retracement from the .618 Fib level, also known as "golden pocket"; moreover, there is no any major sign of reversal. The projection of the bearish flag pattern s also shown on the chart. Instant selling with a marked stop loss would be good to enjoy decent profits
Institutional Demand: USD/CHF longsHey,
Another beautiful pullback play is likely for many USDs this week.
NU, GU, EU etc are all in or near value.
Together with USD/CHF also moving towards a key area of value.
I'll patiently wait till price reaches it and then look for our 4-hour confirmation.
Kind regards,
Max Nieveld
USDCHF Technicals & Fundamentals🔹 Structure:
Pivot zone marked around 0.8200 (purple line + yellow zone).
Support below at ~0.8160.
Resistance around 0.8240.
Currently trading at 0.82137, trying to reclaim the pivot zone.
🔹 Price Action Outlook:
Bearish Bias: Based on the projected path, the expectation is for USD/CHF to:
Reject near 0.823–0.824.
Retest the pivot zone and fail to hold.
Begin a slow grind down back to the 0.8160 support, and potentially break it toward 0.8080.
🔹 Volume:
Volume appears mixed but increasing slightly — indicating growing interest at this level, possibly setting up for a breakout (or breakdown).
🌍 Fundamentals
🔸 USD Side:
Recent U.S. CPI & Fed rhetoric suggest inflation is sticky.
Rate cut expectations are being delayed, which supports the dollar in general.
However, geopolitical tensions and slowing data may keep the USD volatile.
🔸 CHF Side:
Swiss Franc remains a safe-haven currency.
SNB (Swiss National Bank) has adopted a relatively dovish stance but supports stability.
If global risk sentiment worsens, CHF may strengthen despite policy stance.
🔸 Combined View:
Risk-off sentiment = CHF strength
Strong USD = resistance holding
This combo fits with the technical expectation of a fade from resistance and downtrend continuation.
NOTE:
If USD/CHF fails to stay above the pivot (0.8200), we could see a slow bearish fade back toward 0.8080, as fundamentals hint at CHF strength returning amid global uncertainties.
USDJPY M15 I Bullish Bounce OffBased on the M15 chart analysis, the price is falling toward our buy entry level at 0.8141, a pullback support that aligns with the 61.8% Fibonacci retracement.
Our take profit is set at 0.8215, a pullback resistance that aligns close to the 78.6% Fibo retracement.
The stop loss is placed at 0.8117, a swing low support.
High Risk Investment Warning
Trading Forex/CFDs on margin carries a high level of risk and may not be suitable for all investors. Leverage can work against you.
Stratos Markets Limited (tradu.com):
CFDs are complex instruments and come with a high risk of losing money rapidly due to leverage. 63% of retail investor accounts lose money when trading CFDs with this provider. You should consider whether you understand how CFDs work and whether you can afford to take the high risk of losing your money.
Stratos Europe Ltd (tradu.com):
CFDs are complex instruments and come with a high risk of losing money rapidly due to leverage. 63% of retail investor accounts lose money when trading CFDs with this provider. You should consider whether you understand how CFDs work and whether you can afford to take the high risk of losing your money.
Stratos Global LLC (tradu.com):
Losses can exceed deposits.
Please be advised that the information presented on TradingView is provided to Tradu (‘Company’, ‘we’) by a third-party provider (‘TFA Global Pte Ltd’). Please be reminded that you are solely responsible for the trading decisions on your account. There is a very high degree of risk involved in trading. Any information and/or content is intended entirely for research, educational and informational purposes only and does not constitute investment or consultation advice or investment strategy. The information is not tailored to the investment needs of any specific person and therefore does not involve a consideration of any of the investment objectives, financial situation or needs of any viewer that may receive it. Kindly also note that past performance is not a reliable indicator of future results. Actual results may differ materially from those anticipated in forward-looking or past performance statements. We assume no liability as to the accuracy or completeness of any of the information and/or content provided herein and the Company cannot be held responsible for any omission, mistake nor for any loss or damage including without limitation to any loss of profit which may arise from reliance on any information supplied by TFA Global Pte Ltd.
The speaker(s) is neither an employee, agent nor representative of Tradu and is therefore acting independently. The opinions given are their own, constitute general market commentary, and do not constitute the opinion or advice of Tradu or any form of personal or investment advice. Tradu neither endorses nor guarantees offerings of third-party speakers, nor is Tradu responsible for the content, veracity or opinions of third-party speakers, presenters or participants.
USDCHF INTRADAY bearish below 0.8300Recent price action in USDCHF suggests an oversold bounce, with resistance capping gains at the 0.8300 level.
The continuation of selling pressure could extend the downside move, with key support levels at 0.8090, followed by 0.8040 and 0.7940.
Alternatively, a confirmed breakout above 0.8300, accompanied by a daily close higher, would invalidate the bearish outlook. In this scenario, USDCHF could target 0.8365, with further resistance at 0.8450 and 0.8520.
Conclusion:
The price remains below pivotal level, with 0.8300 acting as a key resistance. Failure to break above this level could reinforce downside risks, while a breakout could shift momentum back in favour of bulls. Traders should watch for confirmation signals before positioning for the next move.
This communication is for informational purposes only and should not be viewed as any form of recommendation as to a particular course of action or as investment advice. It is not intended as an offer or solicitation for the purchase or sale of any financial instrument or as an official confirmation of any transaction. Opinions, estimates and assumptions expressed herein are made as of the date of this communication and are subject to change without notice. This communication has been prepared based upon information, including market prices, data and other information, believed to be reliable; however, Trade Nation does not warrant its completeness or accuracy. All market prices and market data contained in or attached to this communication are indicative and subject to change without notice.
USDCHF: Your Next Bearish Signal 🇺🇸🇨🇭
USDCHF is consolidating after a massive selloff that we saw last week.
The price formed inside bar candlestick pattern and is currently
stuck within the range of the mother's bar.
Your next confirmation to sell will be a violation and a candle close
below 0.8098.
With a high probability, the pair will continue falling then
and reach at least 0.8 psychological level.
❤️Please, support my work with like, thank you!❤️
I am part of Trade Nation's Influencer program and receive a monthly fee for using their TradingView charts in my analysis.
Bullish bounce?The Swissie (USD/CHF) is falling towards the pivot and could bounce tot he 1st resistance.
Pivot: 0.8179
1st Support: 0.8125
1st Resistance: 0.8273
Risk Warning:
Trading Forex and CFDs carries a high level of risk to your capital and you should only trade with money you can afford to lose. Trading Forex and CFDs may not be suitable for all investors, so please ensure that you fully understand the risks involved and seek independent advice if necessary.
Disclaimer:
The above opinions given constitute general market commentary, and do not constitute the opinion or advice of IC Markets or any form of personal or investment advice.
Any opinions, news, research, analyses, prices, other information, or links to third-party sites contained on this website are provided on an "as-is" basis, are intended only to be informative, is not an advice nor a recommendation, nor research, or a record of our trading prices, or an offer of, or solicitation for a transaction in any financial instrument and thus should not be treated as such. The information provided does not involve any specific investment objectives, financial situation and needs of any specific person who may receive it. Please be aware, that past performance is not a reliable indicator of future performance and/or results. Past Performance or Forward-looking scenarios based upon the reasonable beliefs of the third-party provider are not a guarantee of future performance. Actual results may differ materially from those anticipated in forward-looking or past performance statements. IC Markets makes no representation or warranty and assumes no liability as to the accuracy or completeness of the information provided, nor any loss arising from any investment based on a recommendation, forecast or any information supplied by any third-party.
USD/CHF At Interesting Area To Buy To Get 250 Pips m Agree ?Here is my analysis on USD/CHF , The price finally find a support to can go up from it , we have D Confirmation and also 4H Confirmations , so i think we can enter a buy trade when the price go back to retest the support and new 1h Up Trendline , and we will targeting 200 Pips .
This Is An Educational + Analytic Content That Will Teach Why And How To Enter A Trade
Make Sure You Watch The Price Action Closely In Each Analysis As This Is A Very Important Part Of Our Method
Disclaimer : This Analysis Can Change At Anytime Without Notice And It Is Only For The Purpose Of Assisting Traders To Make Independent Investments Decisions.
USDCHFHello Traders! 👋
What are your thoughts on USD/CHF?
On the weekly timeframe, USD/CHF has broken below a major support zone that has acted as a key reversal area multiple times over the past two years. This support zone, has now been clearly breached. Additionally, price has also fallen below the long-term ascending trendline, signaling a potential shift in market structure.
A corrective move (pullback) back toward the broken support zone is expected, after which the pair is likely to resume its downtrend.
Don’t forget to like and share your thoughts in the comments! ❤️
USD/CHF LONG FROM SUPPORT
Hello, Friends!
USD/CHF pair is trading in a local downtrend which we know by looking at the previous 1W candle which is red. On the 1D timeframe the pair is going down too. The pair is oversold because the price is close to the lower band of the BB indicator. So we are looking to buy the pair with the lower BB line acting as support. The next target is 0.862 area.
Disclosure: I am part of Trade Nation's Influencer program and receive a monthly fee for using their TradingView charts in my analysis.
✅LIKE AND COMMENT MY IDEAS✅
"USD/CHF Bearish Reversal Setup – SBR + DBD Zone in Play"🔵 Entry Zone: 0.81698
📍 Located in a SBR + DBD zone
🛑 Acts as resistance where price previously dropped
🔴 Stop Loss: 0.82617
🚫 Above the supply zone for safety
🛡️ Protects against fake breakouts
🟢 Target: 0.78500
🎯 Based on previous support/demand
🧲 High reward potential
Risk/Reward
📉 Risk (SL to Entry): ~91.9 pips
📈 Reward (Entry to Target): ~319.8 pips
⚖️ R:R Ratio: ~3.48 : 1
✅ High potential trade
Indicators
🟡 EMA (7) shows downward trend
📉 Price is moving below EMA – bearish pressure
Trade Plan
🕵️♂️ Wait for price to retest the zone
📉 Look for bearish confirmation (e.g., bearish engulfing)
🔽 Enter short
✅ Secure profits at target or trail stop if price moves in favor