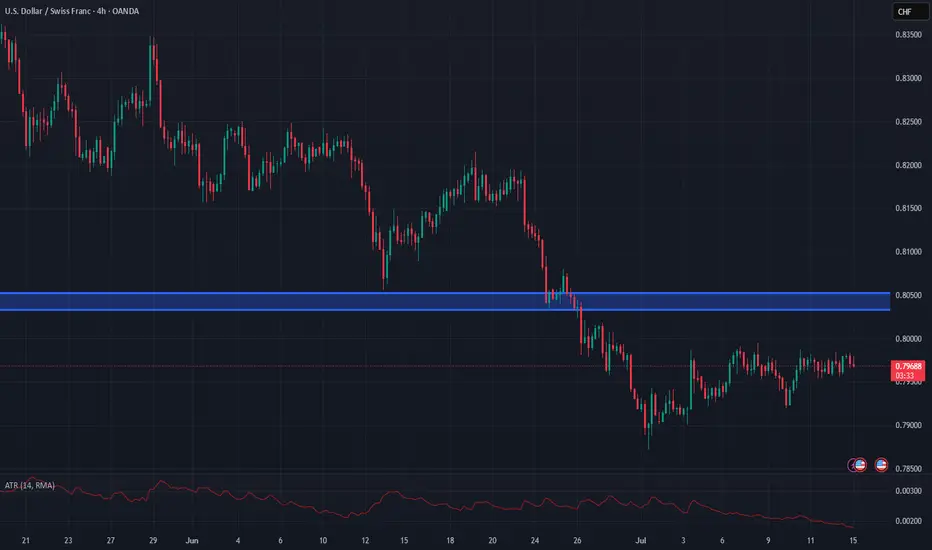
USD weakness has potential shorts on USDCHFUSD continues to show overall weakness ahead of CPI figures later today
Retests of the breakdown area on USDCHF at 0.8033-0.8048 can act as resistance on any retests
Stops should be above 0.8058
Targets can be back towards 0.7990
USDCHF trade ideas
USDCHFOne key factor in my trading style is adapting to market structure, primarily guided by the daily time frame. However, when I analyze lower time frames, I often spot potential shifts to the upside—that's the immediate trend I focus on. While I’m fully aware that overall momentum remains bearish, I understand that for the market to move downward, it first needs liquidity. That’s why I target zones where buyers get trapped.
The difference between me and most buyers is that I know exactly where to exit before the overall trend takes control. From now on, I’ve learned that I’m rarely wrong about the market’s direction—just wrong about my stop loss placement. It’s clear they hunt stop losses, so my strategy now is using minimal risk with wider stop losses.

posible scenario for usd chf we have jobless clame news coming out so we may not trade this but its a good looking setup

USDCHF LONG TERM UPUSDCHF Live Trading Session/ USDCHF analysis #forex #forextraining #forexHello Traders
In This Video USDCHF HOURLY Forecast By World of Forex
today USDCHF Analysis
This Video includes_ (USDCHF market update)
USDCHF Analysis today | Technical and Order Flow
#usdjpy #usdchftechnicalanalysis #usdjpytoday #gold
What is The Next Opportunity on USDCHF Market
how to Enter to the Valid Entry With Assurance Profit?
This Video is For Trader's that Want to Improve Their Technical Analysis Skills and Their Trading By Understanding How To Analyze The Market Using Multiple Timeframes and Understanding The Bigger Picture on the Charts.
Disclaimer: Financial Trading Has Large Potential Rewards, But Also Large Potential Risk. You must be aware of the Risk and Be Welling to Accept Them in order to Trade the Financial Market . Please be Carefully With Your Money.
We are talking about future market, anything can Happen,Markets are Always like that.dnt Risky more Than 2% of your account
Now you can join with our "vip premium" service
Join us and let's make trading together

USDCHF BEARISH OUTLOOK!!Price broke out of a major support level of 0.80962 giving traders a bearish sentiment on USDCHF from the daily timeframe perspective. How are market participants likely to react to this trend? Are we likely to see a pullback before the market continues trading bearish? Let’s see how market conditions reacts over the coming week

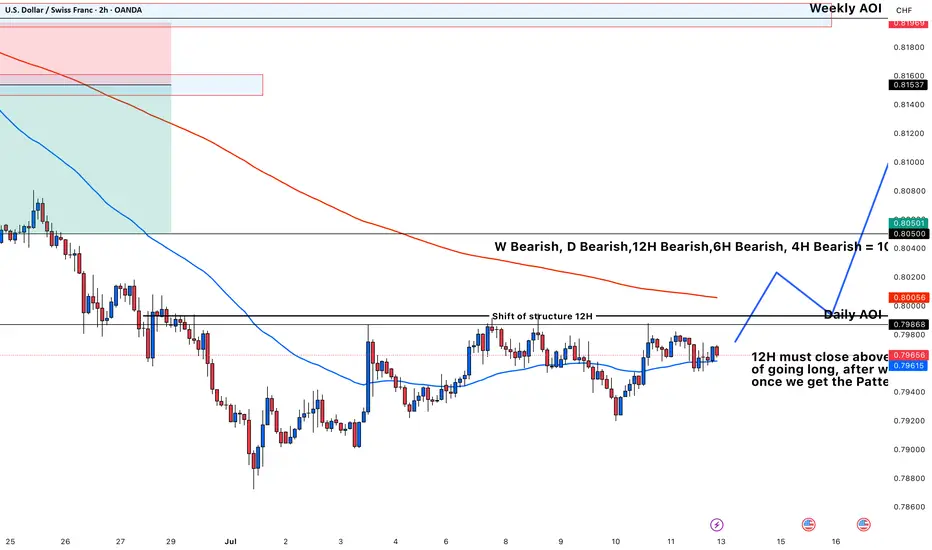
USDCHF once break the structure It will go longUSDCHF in the moment is a Bearish Bias, that is the reason I am wating the 12H to close the body candle above the level, after I am waiting for the retest of the level and once I see my Beautiful pattern { Engulfing Candle } I will take the trade.
Is it time for the buyers to step in?Double bottom forming at this key area on the pair. There's a huge abnormal sell volume candle printed in April, If really there are players positioned there a hard push up could mean a short squeeze propelling the price to go up further and quicker as sellers will have to run for cover.

USD/CHF (1-hour timeframe)USD/CHF (1-hour timeframe), the analysis appears to include:
Ascending triangle pattern (with higher lows and a horizontal resistance).
Ichimoku Cloud for trend analysis.
Two marked target levels with projected breakout potential.
Identified Targets:
1. First Target:
🔹 Around 0.80000
This is just above the current resistance zone and seems to be the initial breakout target if price breaks the horizontal resistance.
2. Second Target (Final Target):
🔹 Around 0.80300 – 0.80350
This is the next higher resistance or profit-taking zone based on projected move from the triangle breakout.
---
Summary:
If the price breaks and closes above the horizontal resistance (approx. 0.79850), your potential targets are:
🎯 Target 1: 0.80000
🎯 Target 2: 0.80300–0.80350
Keep an eye on price action and volume confirmation before entry. Let me know if you want stop-loss suggestions or a risk/reward breakdown.

USD/CHF H4 | Bearish reversal off a multi-swing-high resistance?USD/CHF is rising towards a multi-swing-high resistance and could potentially reverse off this level to drop lower.
Sell entry is at 0.7986 which is a multi-swing-high resistance that aligns closely with the 38.2% Fibonacci retracement.
Stop loss is at 0.8090 which is a level that sits above the 61.8% Fibonacci retracement and an overlap resistance.
Take profit is at 0.7871 which is a swing-low support.
High Risk Investment Warning
Trading Forex/CFDs on margin carries a high level of risk and may not be suitable for all investors. Leverage can work against you.
Stratos Markets Limited (tradu.com ):
CFDs are complex instruments and come with a high risk of losing money rapidly due to leverage. 63% of retail investor accounts lose money when trading CFDs with this provider. You should consider whether you understand how CFDs work and whether you can afford to take the high risk of losing your money.
Stratos Europe Ltd (tradu.com ):
CFDs are complex instruments and come with a high risk of losing money rapidly due to leverage. 63% of retail investor accounts lose money when trading CFDs with this provider. You should consider whether you understand how CFDs work and whether you can afford to take the high risk of losing your money.
Stratos Global LLC (tradu.com ):
Losses can exceed deposits.
Please be advised that the information presented on TradingView is provided to Tradu (‘Company’, ‘we’) by a third-party provider (‘TFA Global Pte Ltd’). Please be reminded that you are solely responsible for the trading decisions on your account. There is a very high degree of risk involved in trading. Any information and/or content is intended entirely for research, educational and informational purposes only and does not constitute investment or consultation advice or investment strategy. The information is not tailored to the investment needs of any specific person and therefore does not involve a consideration of any of the investment objectives, financial situation or needs of any viewer that may receive it. Kindly also note that past performance is not a reliable indicator of future results. Actual results may differ materially from those anticipated in forward-looking or past performance statements. We assume no liability as to the accuracy or completeness of any of the information and/or content provided herein and the Company cannot be held responsible for any omission, mistake nor for any loss or damage including without limitation to any loss of profit which may arise from reliance on any information supplied by TFA Global Pte Ltd.
The speaker(s) is neither an employee, agent nor representative of Tradu and is therefore acting independently. The opinions given are their own, constitute general market commentary, and do not constitute the opinion or advice of Tradu or any form of personal or investment advice. Tradu neither endorses nor guarantees offerings of third-party speakers, nor is Tradu responsible for the content, veracity or opinions of third-party speakers, presenters or participants.

USDCHF continues bullish recovery. Opportunity for BUY signal✏️#USDCHF is showing bullish recovery. The price is trading in a triangle pattern in the recovery phase. The 1.79500 area is an important support zone that is driving the pair's upside. 0.80700 is the immediate Target for a BUY signal.
📈Key Level
SUPPORT 0.79500
RESISTANCE 0.80700
BUY now at support 0.79500
Target: 0.80700
SELL Trigger: Break support 0.79500
Leave your comments on the idea. I am happy to read your views.

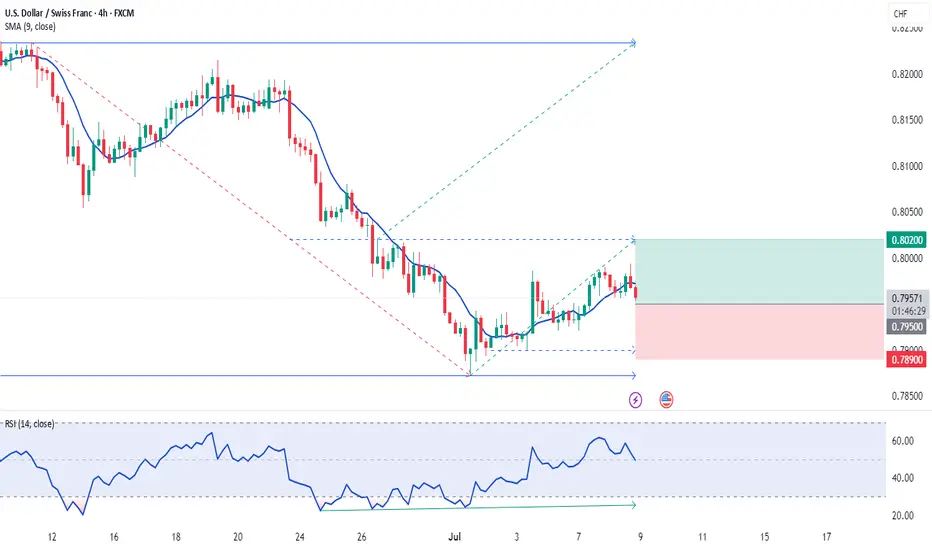
Bullish bounce off 50% Fibonacci support?USD/CHF is falling towards the support level which is an overlap support that aligns with the 50% Fibonacci retracement and could bounce from this level to our take profit.
Entry: 0.7950
Why we like it:
There is an overlap support level that lines up with the 50% Fibonacci retracement.
Stop loss: 0.7924
Why we like it:
There is a pullback support.
Take profit: 0.7986
Why we like it:
There is a pullback resistance.
Enjoying your TradingView experience? Review us!
Please be advised that the information presented on TradingView is provided to Vantage (‘Vantage Global Limited’, ‘we’) by a third-party provider (‘Everest Fortune Group’). Please be reminded that you are solely responsible for the trading decisions on your account. There is a very high degree of risk involved in trading. Any information and/or content is intended entirely for research, educational and informational purposes only and does not constitute investment or consultation advice or investment strategy. The information is not tailored to the investment needs of any specific person and therefore does not involve a consideration of any of the investment objectives, financial situation or needs of any viewer that may receive it. Kindly also note that past performance is not a reliable indicator of future results. Actual results may differ materially from those anticipated in forward-looking or past performance statements. We assume no liability as to the accuracy or completeness of any of the information and/or content provided herein and the Company cannot be held responsible for any omission, mistake nor for any loss or damage including without limitation to any loss of profit which may arise from reliance on any information supplied by Everest Fortune Group.

Continuation of the Multi-Decade DowntrendWith the US tariff trade wars about to commence, I feel that many investors will once again flock to the venerable Swiss Franc as a safer asset.

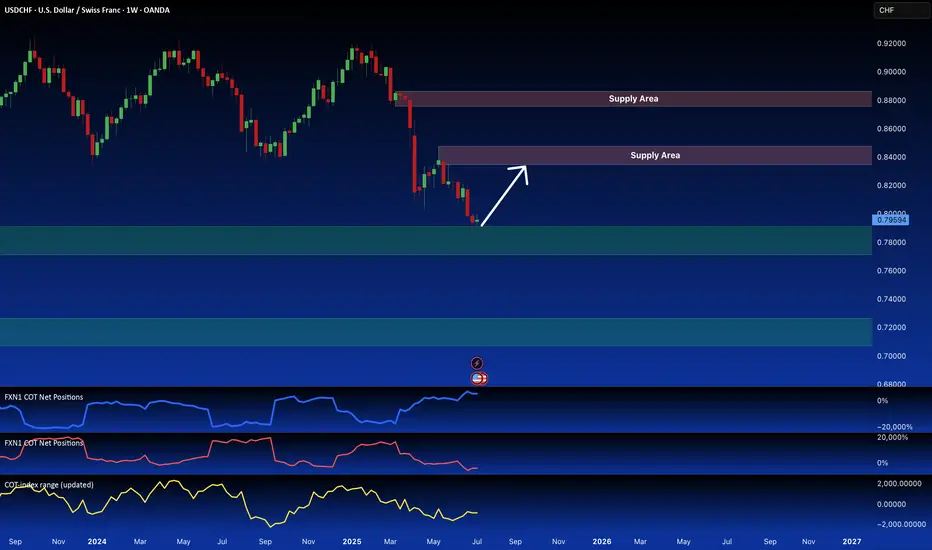
6S1! Futures Divergence Signals USD/CHF Long OpportunityI'm anticipating a bullish USD/CHF move. We're seeing a retest of a key daily demand zone, which is reinforced by a weekly supply area from the futures market (6S1! contract). Futures data suggests significant retail investor bullishness, contrasting with bearish positioning from commercial and hedge funds. This divergence suggests a potential long opportunity. I've also highlighted the next key demand area on the CFD USD/CHF chart.
✅ Please share your thoughts about 6S1! in the comments section below and HIT LIKE if you appreciate my analysis. Don't forget to FOLLOW ME; you will help us a lot with this small contribution.
Sell USDCHFI believe this may be the last downs the USD will face this quarter. I see a bearish flag pattern emerging indicating a possible declination in price to close the week negative

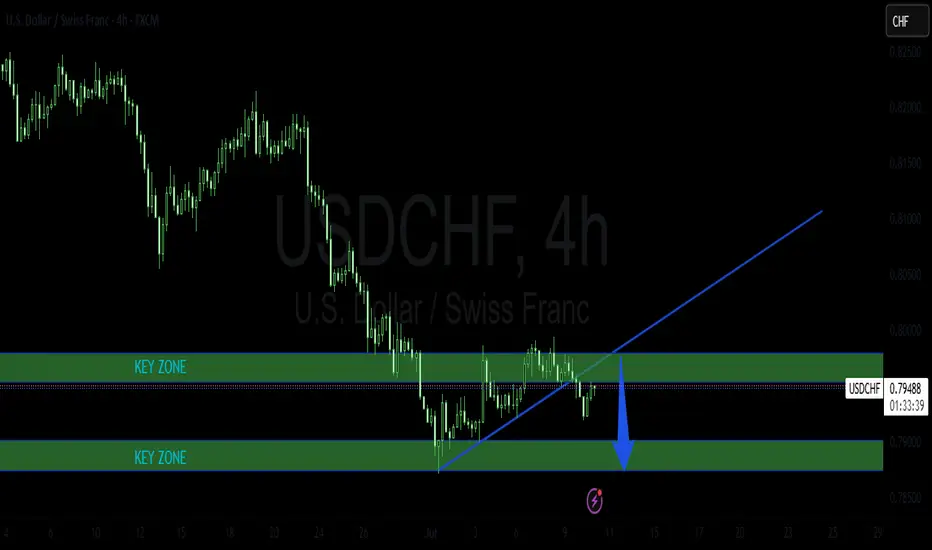
USDCHF SHORT TRADE PLANThe pair is trading in a bearish trend and recently broke below a key zone. It is now retesting the key zone area and from this point, we may see a bearish rally.
Please do your own analysis before placing any trades.
Cheers and Happy Trading !!!!
USD/CHF Weakness Alert: Retail Bulls vs. Smart Money FlowHere’s the latest aggregated data on the pair:
📊 4 out of 5 indicators suggest potential for further downside.
Sentiment - Bearish!
A quick note on sentiment in the table:
✅ It’s structured hierarchically — from the broadest view (COT reports) to specific entry points (algorithmic setups).
So, Retail traders are massively long USD/CHF — over 80% still buying , expecting strength.
But here’s the problem: the options flow tells a different story .
Looking at recent data from CME , we’re seeing fresh calls buying and growing open interest at key strikes upper current Swiss futures price — a sign that option traders are preparing for strong CHF
💡 Use this data in your trading OR quick check for market conditions at glance!
🎯 No Valuable Data, No Edge!

Will USDCHF go down?!!Hello traders, this is a trade that I have been scoping for a while but the week is about to close.
as you can see this is a clear downtrend.
You can clearly see a pullback in a form of a triangle.
A clear divergence.
You can either sell now or try to sell below the pivot point.

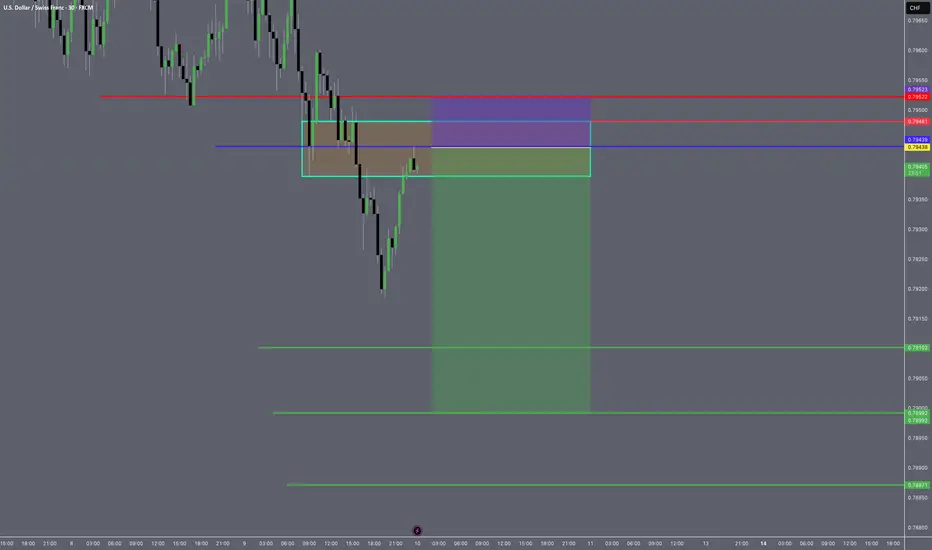
USD CHF SHORT PLAY-TITAN SIGNAL🔻 USDCHF SHORT PLAY – TITAN SIGNAL 🔻
"Impulse Drain Line Breach – Initiate Tactical Short"
📍 PAIR: USDCHF
🎯 Play Type: Short
📈 Signal Code: Impulse Drain Line Activated
📌 Entry: Upon clean break + retest of the Impulse Drain Line (0.79436
🎯 Targets:
LZ1: 0.7909
LZ2: -0.7898
LZ3: 0.7886
🛡 Stop: 0.79522
Could the Swissie bounce from here?The price is reacting off the pivot which acts as an overlap support and could bouncer to the 1st resistance which is slightly above the 37.2% Fibonacci retracement.
Pivot: 0.7933
1st Support: 0.7879
1st Resistance: 0.8016
Risk Warning:
Trading Forex and CFDs carries a high level of risk to your capital and you should only trade with money you can afford to lose. Trading Forex and CFDs may not be suitable for all investors, so please ensure that you fully understand the risks involved and seek independent advice if necessary.
Disclaimer:
The above opinions given constitute general market commentary, and do not constitute the opinion or advice of IC Markets or any form of personal or investment advice.
Any opinions, news, research, analyses, prices, other information, or links to third-party sites contained on this website are provided on an "as-is" basis, are intended only to be informative, is not an advice nor a recommendation, nor research, or a record of our trading prices, or an offer of, or solicitation for a transaction in any financial instrument and thus should not be treated as such. The information provided does not involve any specific investment objectives, financial situation and needs of any specific person who may receive it. Please be aware, that past performance is not a reliable indicator of future performance and/or results. Past Performance or Forward-looking scenarios based upon the reasonable beliefs of the third-party provider are not a guarantee of future performance. Actual results may differ materially from those anticipated in forward-looking or past performance statements. IC Markets makes no representation or warranty and assumes no liability as to the accuracy or completeness of the information provided, nor any loss arising from any investment based on a recommendation, forecast or any information supplied by any third-party.

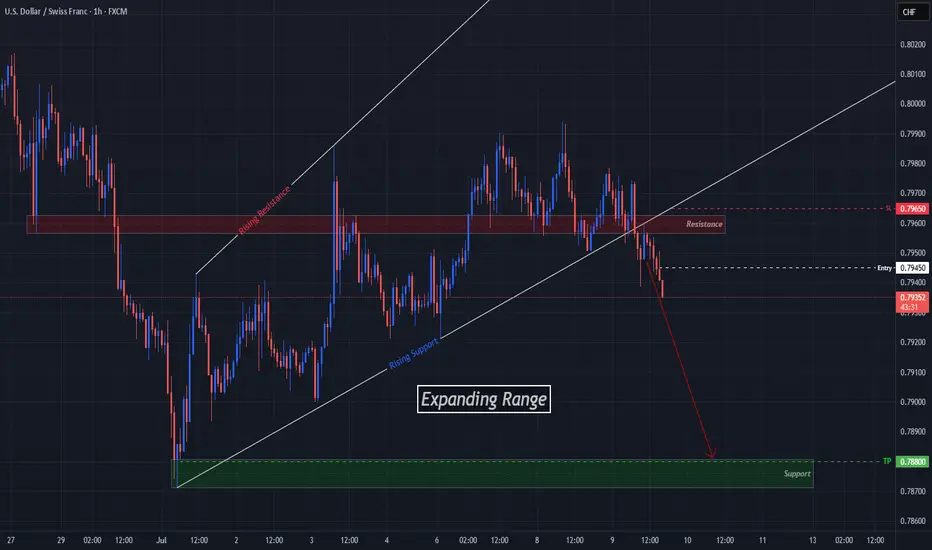
USDCHF Breaks Expansion, Aims For Next Support LevelOANDA:USDCHF has given us a Breakout of the Expanding Range it has been traveling in since the Low @ .78712 created on July 1st.
Now Price has already Retested the Breakout of the Rising Support of the Expansion and a Past Support Level, now turned Resistance @ .7960!
Hourly candles are continuing to close Lower signaling further potential to the downside!
Short Entry @ .7945
SL @ .7965 ( Above Retest of Breakout )
TP @ .7880
USD-CHF Bearish Flag! Sell!
Hello,Traders!
USD-CHF is trading in a
Downtrend and the pair broke
Out of the bearish flag so
We are bearish biased
And we will be expecting
A further bearish move down
Sell!
Comment and subscribe to help us grow!
Check out other forecasts below too!
Disclosure: I am part of Trade Nation's Influencer program and receive a monthly fee for using their TradingView charts in my analysis.

Bearish drop off pullback resistance?USD/CHF is reacting off the resistance level which is a pullback resistance that lines up with the 38.2% Fibonacci retracement and could drop from this level to our take profit.
Entry: 0.7959
Why we like it:
There is a pullback resistance level that lines up with the 38.2% Fibonacci retracement.
Stop loss: 0.7986
Why we like it:
There is a pullback resistance that is slightly above the 78.6% Fibonacci retracement.
Take profit: 0.7900
Why we like it:
There is a pullback support.
Enjoying your TradingView experience? Review us!
Please be advised that the information presented on TradingView is provided to Vantage (‘Vantage Global Limited’, ‘we’) by a third-party provider (‘Everest Fortune Group’). Please be reminded that you are solely responsible for the trading decisions on your account. There is a very high degree of risk involved in trading. Any information and/or content is intended entirely for research, educational and informational purposes only and does not constitute investment or consultation advice or investment strategy. The information is not tailored to the investment needs of any specific person and therefore does not involve a consideration of any of the investment objectives, financial situation or needs of any viewer that may receive it. Kindly also note that past performance is not a reliable indicator of future results. Actual results may differ materially from those anticipated in forward-looking or past performance statements. We assume no liability as to the accuracy or completeness of any of the information and/or content provided herein and the Company cannot be held responsible for any omission, mistake nor for any loss or damage including without limitation to any loss of profit which may arise from reliance on any information supplied by Everest Fortune Group.
