USDCNH top-down analysis, UPDATEDHello traders, this is the full breakdown of this pair. We will take this trade if all the conditions are satisfied as discussed in the analysis. Smash the like button if you find value in this analysis and drop a comment if you have any questions or let me know which pair to cover in my next analysis.
USDCNH trade ideas

USDCNH top-down analysisHello traders, this is the full breakdown of this pair. We will take this trade if all the conditions are satisfied as discussed in the analysis. Smash the like button if you find value in this analysis and drop a comment if you have any questions or let me know which pair to cover in my next analysis.

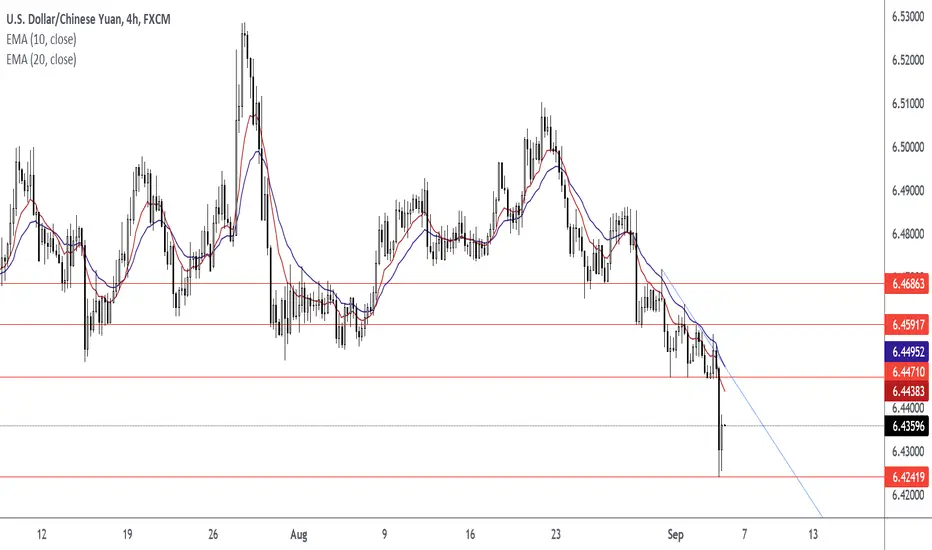
USDCNHdollar yuan came crushing down to 6.43013 and has seen quite a lot of resistance. So I am expecting to see the dollar gain strength against the yuan.
However the market could break 6.42734 but I am not so confident that the move could push to the downside.
Trade wisely

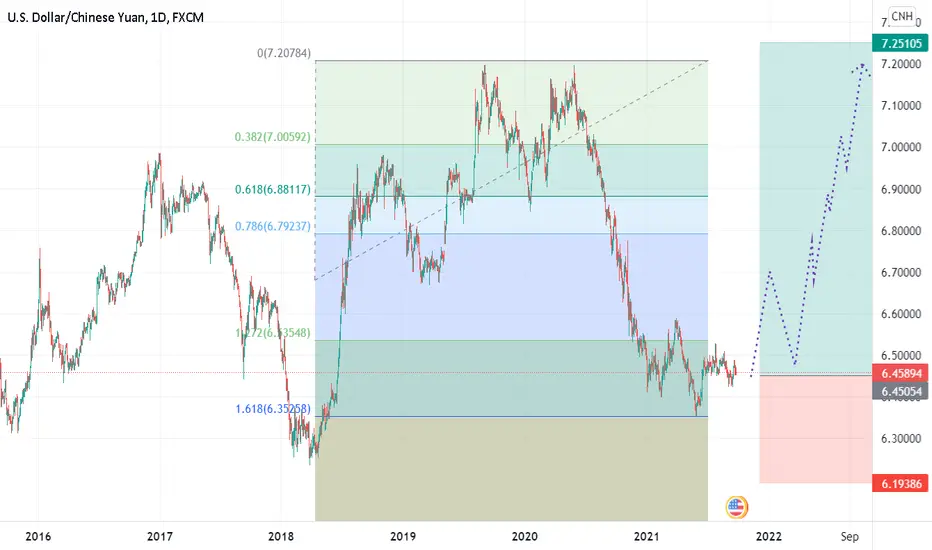
USD/CNH Triangle Apex Nears, Will Prices Break Higher or Lower? The Chinese Yuan's volatility versus the US Dollar has eased considerably in recent months compared to price action seen earlier this year. USD/CNH is quickly approaching the apex of a Symmetrical Triangle pattern, however. This may see the currency pair make a break higher or lower in the coming weeks.
Technically speaking, the triangle doesn't show bias to either side and prices are gyrating around the 100-day SMA. However, fundamentally, the Yuan's position versus the Greenback doesn't offer a strong picture given the prevailing housing market headwinds in China.


Yuan will devalue soon, US dollar $DXY will soar!Republishing this from my USDCNY post.
1. Head and Shoulders pattern
2. MA's + PA show a bottoming pattern
3. China will devalue the Yuan (Remnimbi)
4. Dollar $DXY will go over 106
5. Gold $XAUUSD will go below $1,500 oz.
6. Silvere $XAGUSD will go below $15 oz.
Trade idea related to this currency pair that goes through other macro factors
twitter.com
10, 20, 30 year yields mirror this PA - and show USD will be going up as yields are starting to. When China devalues the Yuan, the FED will be helpless to push it down unless they go all in on YCC via UBI. Then you'll want to pivot into $XAUUSD or $XAGUSD.

USDCNH: Good bullish config 4hUSDCNH presents good bullish 4h config.
MACD above 0.
Retest of the Support line.

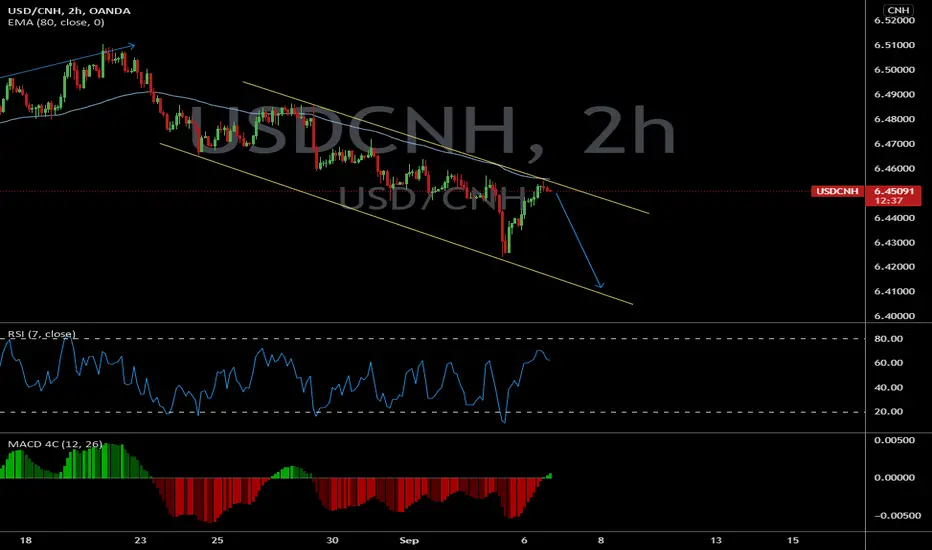
USD CNH 1hr Potential SellPrice is ranging (trending between a support and resistance). Price is currently at the resistance of the range and has shown signs of rejections hence we are expecting the price to surge bearish as it has consistently done previously. The risk to reward ratio is 1:2.5
All credits are given to CLIFFON PRYCE.

USDCNH - LongHello, traders.
This pair has the potential to go up higher after breaking its mini-wave.
If you have a similar trade, comment below.
Good lunch!

analyse de usdcnhl observation du rejet de la moyenne mobile 100 et de la resistance testée a 4 reprises laisse fortement supposer la chute du dollar americain face au monnaie chinoise

USDCNH long trade I was really bearish on this pair as it got the "Psychological 7" a year ago and have been shorting this quite a lot, but now we've gotten to major support levels and I am now long this for a swing trade. Along with other long USD trades.
3 White Soldiers ABCD ContinuationWe have a 3 white soldiers pattern that has been retraced 50 percent of the way, if we see a reversal here then i expect another big wave up.
This is a continuation trade that can lead to a much bigger move up later on, checkout the related idea for the bigger bullish target.

USDCNH OANDA🌟this pair is traded for a long term situation with a high R/R value (the R/R stays the same)
🌟in this ascending channel you can see the reversed H&S formation (or the 3 buddha or 3 rivers in Japanese trading) which is an indicator for a bullish bias and its marked with faint yellow highlight
🌟you can observe a blood waterfall (marked with red highlight) which is abnormal in the market and distracts the EMA statistics and for balancing this situation a green mountain needs to recover this bleed of the market from the top to the bottom of the channel (both waterfall and mountain phrases are visionary and not official formats)
🌟this position has a 3510 pips rewards aside a high cost stop loss so manage your leverage properly
Risk warning, disclaimer: all of the following signals/ideas are subjective and based on market judgement of our team's technical and fundamental analysis , we hope traders consider this and always check it with your own strategy, if you don't have any we can help you form one
----------------------------------------------------------------------------------------------------------------
If you want to see more and more from these 💎 free signals:
🙏 Help us grow then
Each individual support counts 🙏
Tell us what do you like to know about the market and how do you see the forecasts
Share us your opinion
----------------------------------------------------------------------------------------------------------------
👉This idea has the confirmation of "advanced price action" 👍
👉Follow us and invite your friends too, this way we can share ideas and signal to anyone we care 👍
👉Hit share and spread the information in public chats or your twitter for everybody to get profit 👍
👉Tell us what's important for you in the market or what asset makes a difference in your investment basket 👍
📝Did you know money management and risk management are as important as your entry and exit point of a chart?
💰Plan a Trade before a Trade💰
💸Develop a strategy before you enter position
your strategy have to be a combination of money management + risk management + time management and profit management (the famous MRTP method made exclusively by our team💎)
Trade well ❤️

2021-09-22 USD/CNH - longLooks like price is about to break downtrend line on daily.
Price had a nice move down and macro news seems friendly to pursue this trade

Cataclysms are brewing in the global stock markets. China.All because of the situation with one of the largest developers in China - China Evergrande Group, which found itself on the verge of default (debt size ~ $ 300 billion).
The possible bankruptcy of the company will hurt not only the Chinese economy (remember Lehman Brothers).
Deposits in Chinese banks are about to $35 trillion, which is twice the size of the United States. Chinese financial crisis will lead to unforeseen circumstances and will affect all world markets.
Industrial production has negative rates in China. Now it is near the lowest level since the global financial crisis.
The devaluation of the yuan seems inevitable.
Best regards EXCAVO

Significant CorrelationThe strength of the Chinese Yuan and equity markets appears to be correlated due to the Chinese's increased trade presence and credit expansion. If price action continues to push below the 200 day EMA we could be likely looking at a bear market.
Could the dollar milkshake theory prove to be correct?
Only time will tell. (Dramatic music engage)


monthlymonthly outlook with how we trade as we cover briefly the methodology on how we trade based on 3
1 market psychology
2 price and or time action
3 leading indicators that agree with 1 n 2
gl

USDCNH CRITICAL NEWS ALERT Tomorrow morning the USD will see massive movement off job numbers dropping. Personally I am short on USD. Long on GBP and CAD against USD. CNH has seen 200 ema cross over 50 ema so we will see the movement down. Price has also came to retracement on 4hr time period. BIG Ws. Stay tuned will be updating tmr when news drop 8:30am EST New York session
