USDCNH trade ideas

Possible SHORT position on USDCNHWaiting for a break and retest of the S/R Zone to jump in for SHORTS.

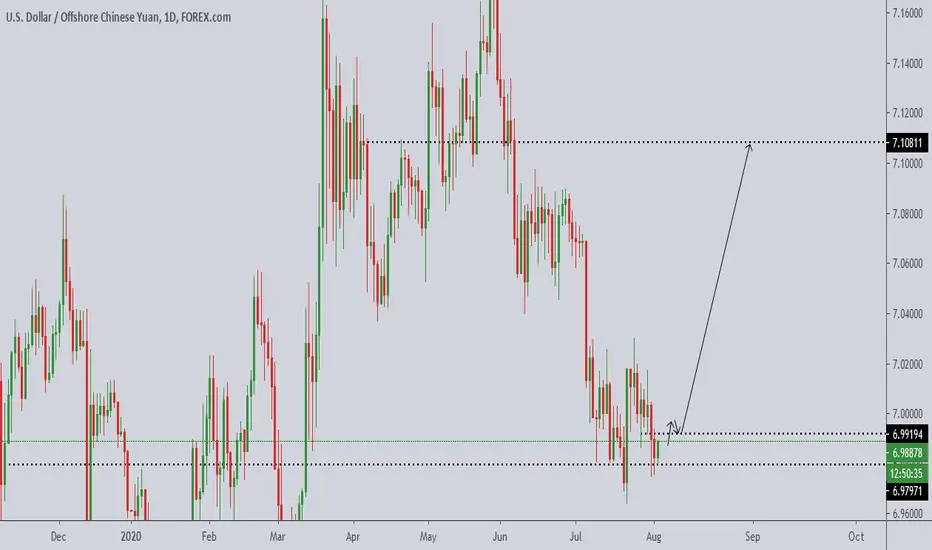
USDCNH buysFundamentals:
Mixed
Technicals:
D1 bullish gartley, price reaching W1 (weekly time frame) support


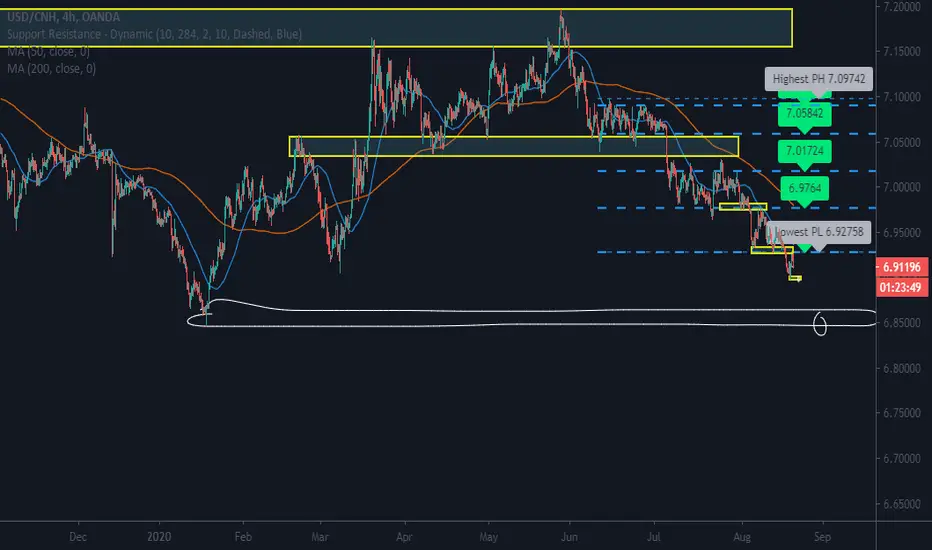
USDCNH ANALYSISUSDCNH rebounded from downtrendline with bearish movement
Price is rejected from 50% Fibonacci level at 6.9252
Pair is based below key level
Below SMA 100
MACD shows weakness in bullish momentum
RSI is below level 50
It's expected for coming bearish wave (c) to target daily demand zone at level 6.8454

SHORT ON USDCNHUSDCNH has been dropping since 28th May. We might see a push to the downside to the lows of 20th January.
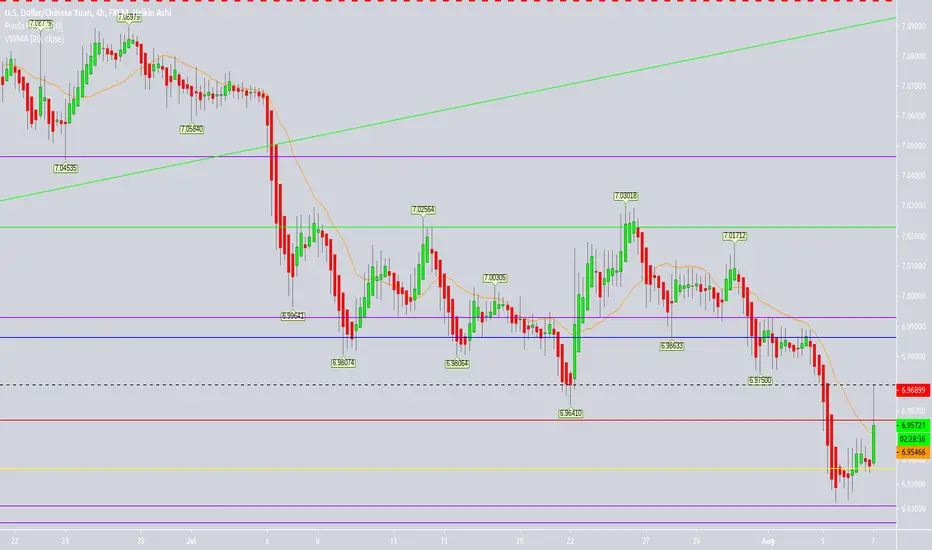
USDCNH ANALYSISUSDCNH broke major uptrendline on daily frame
Price respects major downtrendline
Pair is based below resistance level at 6.9630
Below SMA 100
MACD shows bearish momentum
It's expected for the continuation of bearish movement to target key level at 6.8165


USDCNH | MY PERSPECTIVE FOR THE WEEKWe continue to enjoy profitable Bearish opportunity on this pair in the last 3 weeks as price moved over 350pips in our direction since my last publication (see link below for reference purposes). We might be looking forward to a last Bearish drive as the PBoC intends to promote the healthy development of offshore Yuan market.
Tendency: Downtrend ( Bearish )
Structure: Supply & Demand | Trendline
Observation: i. Price has been respecting my Bearish trendline in the last couple of weeks with no structure suggesting a possible Breakout of this line soon.
ii. Present structure at this phase in the market is screaming Breakdown of my Key level ! 6.93500 in the coming week(s).
Trading plan: SELL confirmation with a minimum potential profit of 350 pips.
Risk/Reward: 1:3
Potential Duration: 1 to 6 days
NB: This speculation can be considered to make decisions on lower timeframes.
Watch this space for updates as price action is been monitored.
NirvanaForex
Risk Disclaimer:
Margin trading in the foreign exchange market (including foreign exchange trading, CFDs, etc.) has a high risk and is not suitable for all investors. The content of this speculation (including all data) is organized and published by me for the sole purpose of education and assistance in making independent investment decisions. All information herein is for your reference only and I take no responsibility.
You are hereby advised to carefully consider your investment experience, financial situation, investment objective, risk tolerance level and consult your independent financial adviser as to the suitability of your situation prior to making any investment.
I do not guarantee its accuracy and is not liable for any loss or damage which may result directly or indirectly from such content or the receipt of any instruction or notification therewith.
Past performance is not necessarily indicative of future results.

USDCHN could be forming a falling wedgeAs can be seen, the price seems to form a falling wedge which I marked with maroon. Since the price has been falling for a while, the pressure of sale could be less than the beginning.
As I said, the price seems to form a falling wedge, so the wedge is incomplete. And the price could fluctuate several times for this forming process.
Since the price would continue to fluctuate for a while, the MACD and the RSI cannot offer us too much hint about the trend after the wedge.
Basically, the price could go up after falling wedge, however, we do not have too much signal for that.
Let’s wait to see the end of the wedge.

..a nice move to the downside today!USDCNH short
stoploss at the 0.786 fibonacci level
target -0.272 from the fibonacci level


USDCNH summer sales 🦐After our last 2 call on this pair, we check for another opportunity on USDCNH pair.
The market hs moved in lower high lower low pattern and tested 3 times the ema 21 that always rejected the move.
Recently the price has retraced till the 0.5 fib level and now is pushing down to test again the weekly support.
If the price will manage to break and close below the structure we can look for a nice short order according with our strategy.
–––––
Follow the Shrimp 🦐
Here is the Plancton0618 technical analysis , please comment below if you have any question.
The ENTRY in the market will be taken only if the condition of Plancton0618 strategy will trigger.

A STRONGER YUAN AND USD SELL RALLY IS NEXT MOVE - US-CHINA WAR U.S foreign policy is in the spotlight. U.S – China relations took yet another turn for the worse late last week. Expect plenty of chatter in the week ahead, as Trump looks to woo lost support ahead of the Presidential Election. The ongoing spat between the U.S and China will continue in the week. The Chinese Yuan ended the week up 0.10% gains to CNY6.9680 against the U.S Dollar.
The fall of USD against major pairs will continue.

USDCNH. The price will not leave the downtrend boundaries.Hello dear subscribers.
The dollar price in the previous chart for this currency pair
showed a positive result and the price reached its target.
However, the price continues to be under the influence of the
downtrend and will not leave its borders.
The price will fall to the support level.
Good luck to you!
If you liked this idea, please like and subscribe to my profile.
This idea does not provide the financial advice.

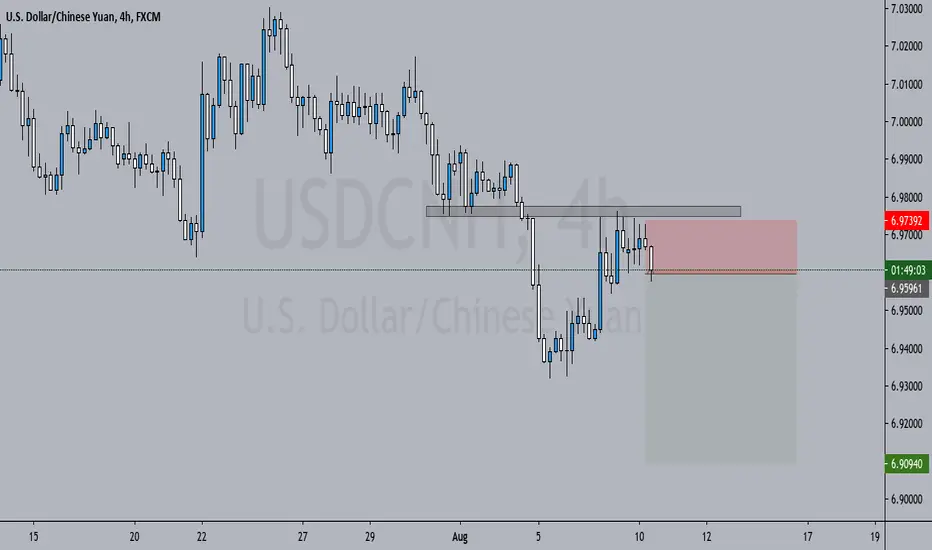
USDCNH - Plan 10/8time frame D
USD in channel decreased over 2 months from 7,195 to 6,933. The end of August 7 is a green candle that closes at a lower level than the highest price of the day. This shows that the buyers were strong from the beginning of the day but at the end of the day there were signs of being weaker than the sellers.
Smaller timeframes have a divergence formation
Time frame H4
still inside the down channel, the price is facing resistance at 6.97
Time frame H1
price patterned 2 small peaks, RSI has a divergence, showing that the price is likely to decline to 6,954
Plan
Give priority to sell orders
1. Frame H1 if the price rises above the resistance zone at 6,972, wait for price action at the edge on the corresponding channel to the resistance zone at 6.988. If the price surpasses 6,988, consider a buy order with a stop loss at 6,972. (do not prioritize buy orders)
2. Frame H1 if the price falls, waiting for the price to break through the neck line at 6.954, set up a sell order with stop loss at 6.964 and target at 6.922, at 6.922 should consider giving a buy order if there are signs of a reversal.
3. Frame H4 price increased over the channel corresponding to the 9,854 zone, consider buying with stop loss 6.974, target at 7.023, respectively at this zone, consider a sell order.

USDCNH | MY PERSPECTIVE FOR THE WEEKSince my last publication on this pair (see link below for reference purposes); price has moved over 500pips in our direction followed by a correction move with the anticipation of a further decline scattered all over the place! As USDCNH risk a further decline in the following week, a retest of my Key level is red flag to watch out for in the following week(s).
Tendency: Downtrend ( Bearish )
Structure: Retracement | Trendline | Breakdown | Supply & Demand
Observation: i. Breakdown of my Key zone @ 6.98000 followed by a retest of this zone in the following week confirms my Bearish bias on this one.
ii. Correction of Breakdown impulse leg appears to culminate at my key zone which is 61.8 retracements.
iii. It is also worthy to note how selling pressure has been strong at the corridors of my Bearish Trendline since it's inception in June 2020.
Trading plan: SELL confirmation with a minimum potential profit of 600 pips.
Risk/Reward: 1:3
Potential Duration: 3 to 7 days
NB: This speculation can be considered to make decisions on lower timeframes.
Watch this space for updates as price action is been monitored.
NirvanaForex
Risk Disclaimer:
Margin trading in the foreign exchange market (including foreign exchange trading, CFDs, etc.) has a high risk and is not suitable for all investors. The content of this speculation (including all data) is organized and published by me for the sole purpose of education and assistance in making independent investment decisions. All information herein is for your reference only and I take no responsibility.
You are hereby advised to carefully consider your investment experience, financial situation, investment objective, risk tolerance level and consult your independent financial adviser as to the suitability of your situation prior to making any investment.
I do not guarantee its accuracy and is not liable for any loss or damage which may result directly or indirectly from such content or the receipt of any instruction or notification therewith.
Past performance is not necessarily indicative of future results.

close usdcnhDid you go long trading usdcnh? consider closing that trade at whatever minimal profit you have. We do not want to incur any loss since the market did not go as we had anticipated.


USDCNHMULTI TIME-FRAME ANALYSIS DONE.
TRADE SHOULD ONLY BE TAKEN IF IT FITS YOUR IDEA OR PLAN.
TRADE SMART.
USDCNH | WEEKLY PERSPECTIVERecent upbeat data from China standing in contrast to the sluggish US statistics, the Bears once again are gradually regaining control as Sellers bombard 6.9900 level, down 0.15% on the last day of last week. With a meagre 45pips since my last publication on this pair (see link below for reference purposes), my Bearish bias still persists as price action has been caught within a consolidation phase with the anticipation that a Breakout from this range might be emphatic in the following week(s).
Tendency : Downtrend ( Bearish )
Structure : Channel (Bearish Rectangle)
Observation : i. The fall of the USD since the beginning of July 2020 appears to continue even though we had a heavy consolidation pattern throughout the later part of last month.
ii. My Key level at 6.98000 is still a level on my radar in the coming week as I anticipate a significant Breakdown considering the selling pressure @ 7.00500.
iii. Kindly refer to my previous broadcast on this pair as the Harmonic expectation (AB = CD) is still in existence.
Trading plan : SELL confirmation with a minimum potential profit of 550 pips.
Risk/Reward : 1:3
Potential Duration : 1 to 5 days
NB: This speculation can be considered to make decisions on lower timeframes.
Watch this space for updates as price action is been monitored.
NirvanaForex
Risk Disclaimer:
Margin trading in the foreign exchange market (including foreign exchange trading, CFDs, etc.) has a high risk and is not suitable for all investors. The content of this speculation (including all data) is organized and published by me for the sole purpose of education and assistance in making independent investment decisions. All information herein is for your reference only and I take no responsibility.
You are hereby advised to carefully consider your investment experience, financial situation, investment objective, risk tolerance level and consult your independent financial adviser as to the suitability of your situation prior to making any investment.
I do not guarantee its accuracy and is not liable for any loss or damage which may result directly or indirectly from such content or the receipt of any instruction or notification therewith.
Past performance is not necessarily indicative of future results.
