USDCZK trade ideas


USDCZK Buy SignalPattern: Channel Up on 1W.
Signal: Bullish as the price hit the 1D MA200 and rebounded just above the Higher Low of the Channel.
Target: 23.300 (inner Higher High).


USDCZK Lower Long SignalPattern: Channel Up on 1D.
Signal: Bullish if the price hits the inner (dashed) trend line.
Target: 23.2000.

USDCZK Exotic Setup!Analysis
-USDCZK looking bullish after showing signs of reversal. Sellers pushed price down into support but buyers brought it back up above support before the daily candle close.
-The price action resulted in a daily pinbar setup AT SUPPORT which is a bullish sign.
-On the 1H time frame, price just broke a bearish trendline or the neckline of a head and shoulders to the upside.
-We're in a rising channel and price just made a strong impulse move from the bottom of the channel
-The reward/risk is good for the setup (given the distance between daily S/R levels)
Entry, Stops and Targets
-Long Entry: 22.904 (Enter long after price pulls back, never chase a trade)
-Stop Loss: 22.7508(Set stop below the daily reversal candle)
-Take Profit: 23.2098 (Set target at a minimum of 2 times your stop depending on entry)
= 2R
*Trade Safe and at your own discretion!*

Short USD/CZKClear range pattern developed. Price is at major resistance. Breakout here is possible but playing odds that resistance holds and we retest support over the next few days.

USDCZK 1:3 Risk Reward (Long Term Breakout)(Contarian High Risk)What do you guys think?
Fundamental Scores are in favour of USD right now.
CZK has a weak score which can be seen as a sign to long USD/CZK. Breakout seems viable, already moved with me.

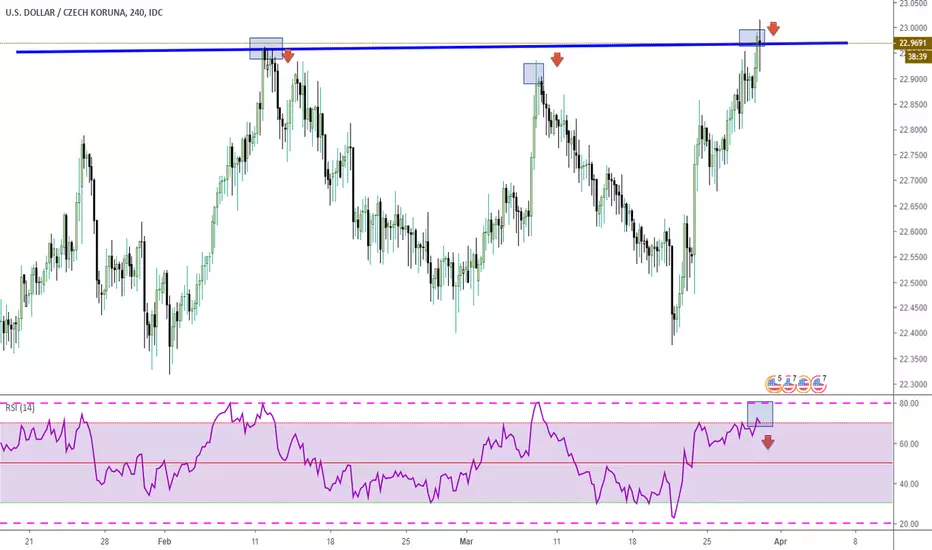
USDCZK Sell signalPattern: Channel Down on 4H.
Signal: Bearish if the dashed line within the Channel Down breaks.
Target: 22.5350 (expected Lower Low).

USDCZK price action ready for breakoutThe price action might go for one more touch at the bottom of falling wedge.
MACD is weak bullish I am expecting it will be strong bullish soon.
The POC of volume profile is above 28.78 therefore the price line will be soon pulled up insha Allah.
Regards,
Atif Akbar

USDCZK: Buy the 1D Higher Low.The price is trading within a 1D Channel Up that is now on Higher Low level (RSI = 49.861, MACD = 0.107, Highs/Lows =-0.0169). Since every Higher High is -50% the value of the previous one, then the next TP should be near 23.22625.

Buy USD/CZKThis is just a journal for me. I strongly warn you to not take this in your real account. Good luck!


USDCZK pullback to previous resistance now supportThis is a aggressive long idea. Dollar continues to be strong. So using the pullback to the structure as a long opportunity. There is also an inside bar on 4H time frame. Could be used to play either way.
Dan

USDCZK - Are EM currencies in trouble? Everybody is fixated on USDTRY rally at the moment. As impressive of a move it has been thus far, (and devastating for Turkish nationals) there could be some more strong dollar currency trades that can be taken advantage of, perhaps ones such as this;
-10 Week Ascending triangle
-Bolinger band squeeze/expansion on the daily
-Boundaries are clear but not clean
-Measured move 23.3537
30 basis points of risk, Position trade strategy
Happy to have a resting order above boundary but until I have a daily bar into the next week to set a stop against, Stop will be last H4 rule

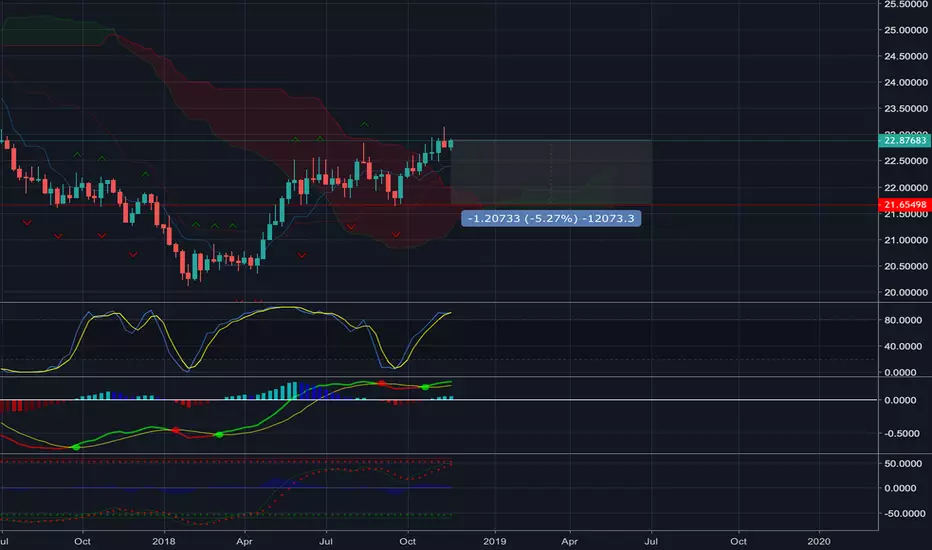
USDCZK may be running into an area of resistance defined the fol
Facing resistance at 18-month descending trendline
Stiff resistance at 200EA (weekly) seems to be at 22.60 above this 23.00 exists August 2015 low
The August 2015 low coincides with the 100MA (weekly) and with the 50.00% fib reaction (Jan 2017 high-Jan 2018 low)
The daily study RSI is indicating a lower high, if propels above 22.55 could paint a negative divergence
Set of resistances seems between 23.00-23.25 above this 23.50 exists
Overall 200MAs (weekly) spread between 23.00 and 23.50
A recovery back between 23.00-23.50 seems hard in the near-term. In this case, this would point a new downward wave towards 21.95 and 21.60 possible.


USDCZK after Short covering rally and 20.80 support retestFrom February to 23.April 18 was there some accumulation thats triggered big short covering rally. On Monthly timeframe its downtrend and 22.5 level is acting as very strong resistance. 21.80 there are big selling pressure.


