USDDKK - U.S. Dollar/Danish Krone (3 hours chart, OANDA) - LongUSDDKK - U.S. Dollar / Danish Krone (3 hours chart, OANDA) - Long Position; Short-term research idea.
Risk assessment: Medium {volume & support structure integrity risk}
Risk/Reward ratio ~ 2
Current Market Price (CMP) ~6.62000
Entry limit ~ 6.58000 on May 19, 2025
1. Target limit ~ 6.63000
Related currencies

USDDKK Buy Opportunity – Mirroring EURUSD Rejection📈 Weekly Overview
USDDKK shows bullish reaction from a key weekly support zone, in line with EURUSD rejecting resistance. Since USDDKK typically moves inversely to EURUSD, this setup aligns well for a long opportunity.
📆 Daily Chart
Yesterday formed a bullish pin bar after a period of consolidat

USDDKK (4H): TECHNICAL ANALYSISTECHNICAL ANALYSIS REPORT: USD/DKK (4H)
OVERVIEW
The USD/DKK 4-hour chart indicates significant price action dynamics with multiple pivot highs and lows. The pair is currently trading within a defined range between key support and resistance zones. The overall trend appears to be upward , as


#USDDKK 4HUSDDKK 4-Hour Analysis
The USDDKK pair is forming a descending triangle pattern on the 4-hour chart, a bearish continuation pattern that indicates the potential for further downside. The price is consolidating near the support line, and a breakout below this level would confirm the bearish setup.

USDDKK: ITF CURVE ANALYSIS (17H) - (DOWNTREND)✨ USDDKK: ITF CURVE ANALYSIS (17H) ✨ (DOWNTREND)
SLO2 @ 7.0950 ⏳
SLO1 @ 7.0650 ⏳
SSO @ 7.05928 ⏳
TP1 @ 6.95821
TP2 @ 6.87327
TP3 @ 6.81071
TP4 @ 6.71407
TP5 @ 6.6925 (Secret TP)
BLO1 @ 6.69086 ⏳ (DO NOT SET - LET PA PASS PRICE/THEN SET AS BSO)
BLO1A @ 6.6750 ⏳(POTENTIAL FOR REAL BLO)
BLO2 @ 6.63

Text book bullish W-Bottom on weekly. Huge gains here.
USDDKK and a Weekly chart Double-bottom which has just passed through the neckline.
Look for a retrace back to neckline.
On USD strength at the moment, this is sure to climb during trading today and the next several weeks. Massive RR. Thx Chris.
Stupid-bloody software. Ignore the chart above.

USDDKK Confirmed bullish break-out.The USDDKK pair broke yesterday above its 1D MA200 for the first time since August 02 and gave a strong bullish break-out signal. The 1D RSI got overbought (above 70.00), so a pull-back of a few days is possible, but on the medium-term we expect a continuation of the uptrend, similar to the two prev

Buy Signal for USDDKKAttention traders,
I'm issuing a buy signal for the currency pair USDDKK based on current market data and analysis conducted with the EASY Quantum Ai strategy.
Direction: Buy
Enter Price: 6.68024
Take Profit: 6.69487333
Stop Loss: 6.66784333
Justification
Using the EASY Quantum Ai strate

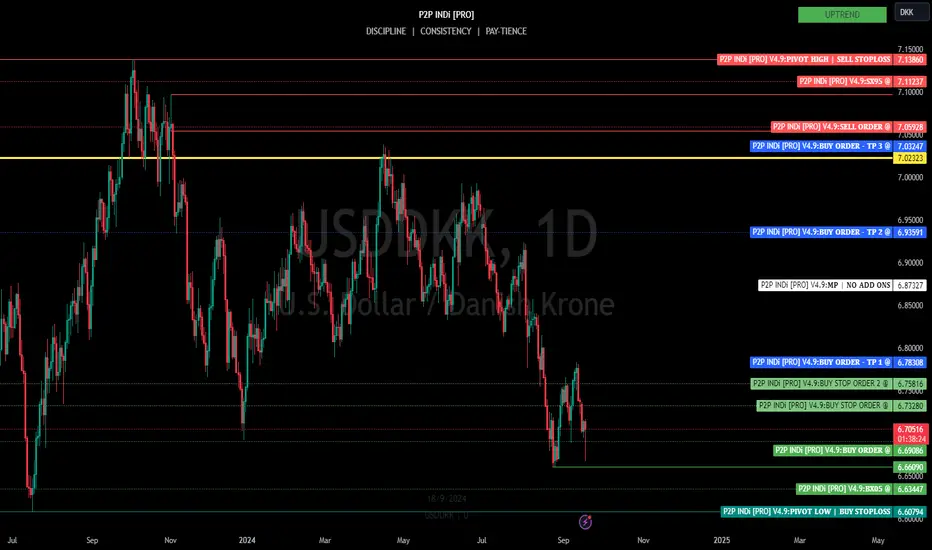
USDDKK: ITF CURVE ANALYSIS (1D) - UPTREND✨ USDDKK: ITF CURVE ANALYSIS (1D) ✨ (UPTREND)
BLO2 @ 6.63447 ⏳
BLO1 @ 6.69086 - TRIGGERED
BSO @ 6.73280 ⏳
BSO2 @ 6.75816 ⏳
TP1 @ 6.78308
TP1a @ 6.8650 (Secret TP)
TP2 @ 6.93591
TP2a @ 7.0233 (possible strong PB)
TP3 @ 7.3247
SLO1 @ 7.05928⏳
SLO1 @ 7.11237⏳
🔑
BLO = BUY LIMIT ORDER
BSO =
See all ideas
Summarizing what the indicators are suggesting.
Oscillators
Neutral
SellBuy
Strong sellStrong buy
Strong sellSellNeutralBuyStrong buy
Oscillators
Neutral
SellBuy
Strong sellStrong buy
Strong sellSellNeutralBuyStrong buy
Summary
Neutral
SellBuy
Strong sellStrong buy
Strong sellSellNeutralBuyStrong buy
Summary
Neutral
SellBuy
Strong sellStrong buy
Strong sellSellNeutralBuyStrong buy
Summary
Neutral
SellBuy
Strong sellStrong buy
Strong sellSellNeutralBuyStrong buy
Moving Averages
Neutral
SellBuy
Strong sellStrong buy
Strong sellSellNeutralBuyStrong buy
Moving Averages
Neutral
SellBuy
Strong sellStrong buy
Strong sellSellNeutralBuyStrong buy
Displays a symbol's price movements over previous years to identify recurring trends.
Frequently Asked Questions
The current rate of USDDKK is 6.43572 DKK — it has decreased by −1.57% in the past 24 hours. See more of USDDKK rate dynamics on the detailed chart.
The value of the USDDKK pair is quoted as 1 USD per x DKK. For example, if the pair is trading at 1.50, it means it takes 1.5 DKK to buy 1 USD.
The term volatility describes the risk related to the changes in an asset's value. USDDKK has the volatility rating of 1.83%. Track all currencies' changes with our live Forex Heatmap and prepare for markets volatility.
The USDDKK showed a 1.27% rise over the past week, the month change is a 1.77% rise, and over the last year it has decreased by −6.90%. Track live rate changes on the USDDKK chart.
Learn how you can make money on rate changes in numerous trading ideas created by our community.
Learn how you can make money on rate changes in numerous trading ideas created by our community.
Currencies are usually traded through forex brokers — choose the one that suits your needs and go ahead. You can trade USDDKK right from TradingView charts — just log in to you broker account. Check out the list of our integrated brokers and find the best one for your needs and strategy.
When deciding to buy or sell currency one should keep in mind many factors including current geopolitical situation, interest rates, and other. But before plunging into a deep research, you can start with USDDKK technical analysis. The technical rating for the pair is sell today, but don't forget that markets can be very unstable, so don't stop here. According to our 1 week rating the USDDKK shows the sell signal, and 1 month rating is sell. See more of USDDKK technicals for a more comprehensive analysis.