Expect of rising .This pair has a -100% correlation with EURUSD , we got a re accumulation here just like EURUSD's re distribution , i'm confidently bullish on this pair .
USDDKK trade ideas

USDDKK: Technical analysis. Hello traders,
Wave C is supposed to materialise towards the support zone at 6.27668. Then the Uptrend is supposed to resume towards the resistance zone at 6.35484.
Thanks.


double top continuationpossible short.expect the price to continue falling for the completion of M formation
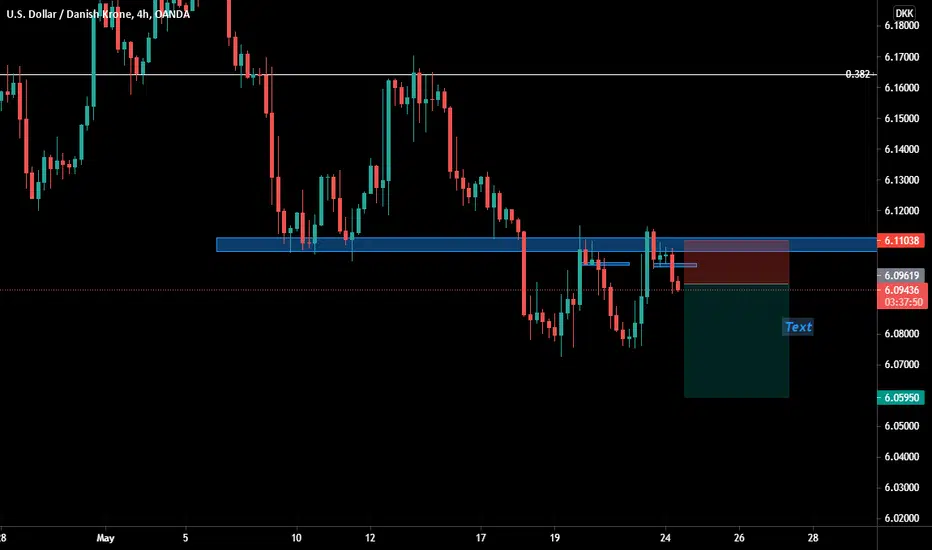
USDDKK 19 MAY 2021 1151 hrsGoing to see if this key support holds for a counter trend trade or a full reversal.
Targets as per.

USD/DKK Ichimoku Cloud AnalysisLong positions above 6.2120 with targets at 6.3350 & 6.5200 in extension.
Pivot: 6.2120
Comments: Chikou breakout, tenkan kijun cross, kumo cloud twist

DKK wait for confirmationUSD / DKK is overall bearish trading within the green channel. On the 4 hour we have 3 touches on the yellow trendline and we are approaching the daily upper trendline. Let's see if we get a fourth touch on the trendline otherwise wait for a momentum candle under the red line.


Jump n FallDo you like Head and Shoulders pattern, wolves?🔥
Here it is, guys!
Today we have h&s pattern on USDDKK on a big frame.
There was a strong bearish movement before then price entered into correction. Price has drawn h&s at the top of this correction and now it already broke support zone.
Possible retest of the new resistance zone is expected. However the price may fall without correction.
So follow the chart and wait for the best price to enter carefully.
If you enjoy my FREE Technical Analysis , support the idea with a big LIKE👍 and don't forget to SUBSCRIBE my channel, you won't miss anything!
Feel free to leave comments✉️
And always remember: "we don't predict, we react".

USDDKK massive swing tradeConfluences:
Daily time frame:
-Head and shoulder pattern formed (high probability trade setup)
-Price broke through a zone
-Pair has been in a downtrend (long-term)
-DXY is about to break 90 with the same head and shoulder pattern hence, waiting for a big drop
-Good risk reward, high probability, I love this setup
Side note: this pair is not a major but price action is price action :)
Feel free to tell me what you think!

USDDKK Short Having the US dollar weaken of the passed couple days, we most definitely will see
the EURO and the currencies that Peggie off the EU, will gain on the US dollars.
TP 1: 6.14990
TP 2: 6.13690
TP 3: 6.11490
As we have seen with ZAR strengthen against the US dollar.

USDDKK buy set up USDDKK BULL prive movement prediction ready i believe that .
usdsgd mine own perspective so what's your consideration on the price movement please comment in the below section ?
I believe that. So what is your expectations in comment below.
So guys Let's look at it 😍😍😍🥰😍😍😍😍 with #hasanat_hussain_al_ahmed_hasan


Long USDDKKQuite sometime hasn't update and share trading plan! Setting up a long on USDDKK around current level with stop below recent key support and targeting at least a retest of at least 6.16 level

USDDKK_FURTHER CONFIRMATION REQUIREDlooking foreword to H&S continuation. Further confirmation required.

USDDKK Is The purest dollarANALYST: AMUN SULED ➖ COMPANY: OCSI CAPITAL MANAGMENT ➖TRADE :
directional bias
IMPORTANT INFORMATION:📌
* ORDER FLOW: bearish
* DAY OF THE WEEK:Friday
* PROJECTED TP : $$
* PROJECTED SL: 🌚
whats up master traders! welcome to another trade idea with Genius Chart. If you like what you see and it helps you ,please support our work by writing a comment and SMASHING that like button! 👍🏾 its us against the markets❗️
Our mission is to provide the tools and knowledge to people across the world and help them tap into uncharted potentials and obtain unimaginable financial freedom. if you hang around this profile long enough you will start to visually learn valuable lessons that will help you put your puzzle together as we are all on our own journey.
Why should you follow our profile on Trading View❓
➖you will get ➖
🥇Clean charts '
🥈Consistent chart updates with our highest probability set ups
🥉 Analysis on a wide range of major markets
----------------------------------------------------------------------------------------------------------------------------------------------------------------------------------------------------------------------------------------------------------------------------------------------------------------------------------------------------------------
♟Legal Risk Disclosure
Trading foreign exchange or CFD on margin carries a high level of risk, and may not be suitable for all investors. The high degree of leverage can work against you as well as for you. Before deciding to trade foreign exchange you should carefully consider your investment objectives, level of experience and risk appetite. The possibility that you could sustain a loss of some or all of your initial investment and therefore you should not invest money that you cannot afford to lose. You should be aware of all the risks associated with foreign exchange trading, and seek advice from an independent financial advisor.

There is a possibility of the beginning an uptrend in USDDKKMidterm forecast:
While the price is above the support 6.04400, beginning of uptrend is expected.
We make sure when the resistance at 6.09700 breaks.
If the support at 6.04400 is broken, the short-term forecast -beginning of uptrend- will be invalid.
Technical analysis:
Price is below WEMA21, if price rises more, this line can act as dynamic resistance against more gains.
Relative strength index (RSI) is 45.
❤️ If you find this helpful and want more FREE forecasts in TradingView
. . . . . Please show your support back,
. . . . . . . . Hit the 👍 LIKE button,
. . . . . . . . . . Drop some feedback below in the comment!
❤️ Your Support is very much 🙏 appreciated! ❤️
💎 Want us to help you become a better Forex trader ?
Now, It's your turn !
Be sure to leave a comment let us know how you see this opportunity and forecast.
Trade well, ❤️
ForecastCity English Support Team ❤️

CLEARER PERSPECTIVE ON USD/DKK FROM THE DAILY TIMEFRAMEThis is a continuation of the previous post, make sure to check it out before continuing with this one.
Looking at USD/DKK from the daily timeframe, in order for us to go long and potentially see USD/DKK being bullish for the long term. We need to see a clean break of the trendline and removal of this recent supply zone, if all that happens it will validate our zone and we'll long to buy upon the retest of that demand zone.

LONG TERM PROJECTION OF USD/DKKThe market is currently trading very low in the curve,there is a high chance that the monhtly demand will take control and start pushing price higher. i will post a follow up of the daily chart to show where i will be looking to take potential long positions


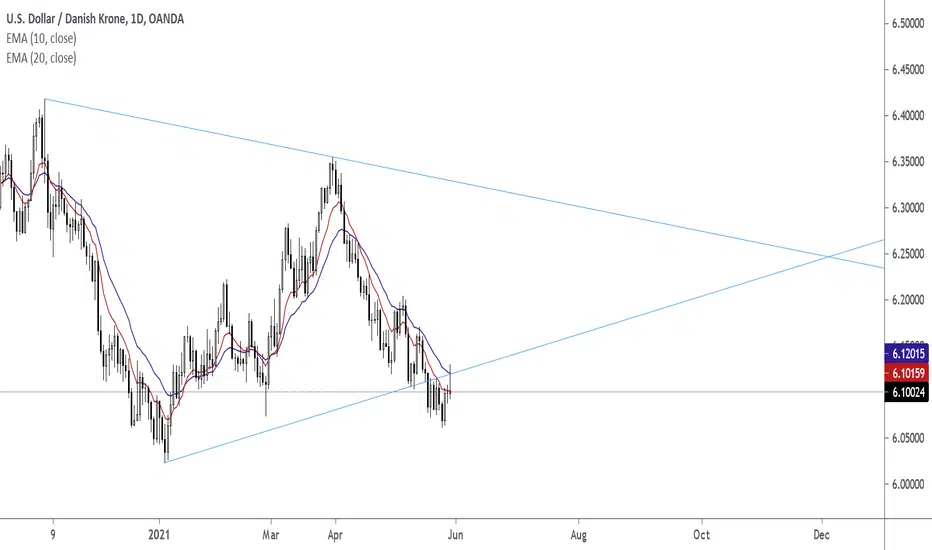
Long is expected1. The white line is the weekly support line, which the price could make a double bottom pattern on it.
2. The price could break the YELLOW LINE which is 1H downtrend line. this line has been retested too after being broken.
3. the time to get into a long position is when the price crosses the GREEN LINE as the important 4H resistance line. the more safe time is waiting until a retest.
don't forget the confirmation.
good luck.
