EURUSD - Potential Bearish ContinuationEURUSD recently tapped into a 4-hour Fair Value Gap, aligning perfectly with a prior liquidity sweep just above the recent swing high. This zone acted as a magnet for buy-side liquidity, and price reacted sharply once that liquidity was taken out. The rejection confirms this area was used by larger players to offload positions rather than push higher.
Rejection and Structure Shift
After the sweep and tap into the FVG, we saw an immediate and aggressive bearish reaction, signaling a clear rejection of higher prices. Momentum flipped decisively, breaking smaller structural points on the way down. The rejection is not just technical, it’s reactive, showing that the intent was never to sustain the breakout.
Break of Support Zone and Bearish Setup
Price is now testing the critical mid-range structure marked in red. This zone previously held as support multiple times, but it is now under pressure. If we get a clean 4H close below this area, it confirms a market structure shift and opens the door for further downside.
Bearish Target and Liquidity Zone Below
If the break confirms, the next logical move would be a push down into the broader support area below. That zone holds untapped liquidity and marks the base of the recent rally. A sweep of those lows would align perfectly with the narrative of a failed breakout, followed by a deeper correction.
Conclusion
The rejection from the 4H Fair Value Gap, combined with a liquidity sweep and a pending structure break, builds a clean bearish case. A confirmed close below the marked zone would shift this into a continuation setup, with expectations for a move toward the lower support and a potential sweep of the lows.
Disclosure: I am part of Trade Nation's Influencer program and receive a monthly fee for using their TradingView charts in my analysis.
___________________________________
Thanks for your support!
If you found this idea helpful or learned something new, drop a like 👍 and leave a comment, I’d love to hear your thoughts! 🚀
USDEUR trade ideas

EURUSD Analysis Today: Technical and Order Flow Analysis !In this video I will be sharing my EURUSD analysis today, by providing my complete technical and order flow analysis, so you can watch it to possibly improve your forex trading skillset. The video is structured in 3 parts, first I will be performing my complete technical analysis, then I will be moving to the COT data analysis, so how the big payers in market are moving their orders, and to do this I will be using my customized proprietary software and then I will be putting together these two different types of analysis.

EURUSD Analysis – Short Bias Builds on Key Resistance RejectionEURUSD pair is currently testing a critical resistance zone around 1.1495–1.1500, with bearish rejection beginning to form on the 4H timeframe. The technical setup suggests a potential lower high forming within the context of a broader downtrend, supported by a confluence of horizontal resistance and bearish risk catalysts.
🔍 Technical Overview:
Resistance Zone: 1.1495–1.1575 (multi-timeframe key levels)
Support Levels to Watch: 1.1234 (range base) and 1.1086 (swing low)
Price Action: After a sustained rally, price is showing exhaustion near previous highs, and a rejection pattern is emerging, suggesting selling interest.
Risk Management: Stop placed above 1.1575 high, with downside targets near 1.1234 and extended toward 1.1086.
🧠 Fundamental Backdrop:
ECB Policy Outlook: Lagarde recently warned that a stronger euro and higher tariffs may hurt EU exports. This dovish tone could weigh on EUR sentiment in the medium term.
US Dollar Strengthening: The latest US labor market data (ADP, JOLTS) beat expectations, showing continued resilience in employment and wage growth. This supports the Fed's data-dependent approach, favoring a stronger USD.
Macro Tensions: Global trade concerns (Trump’s tariffs, weak China demand, Germany’s slowing job market) are adding pressure to EUR while supporting safe-haven USD flows.
ECB Consumer Expectations Survey (April): Highlights persistent inflation fears and deteriorating economic confidence.
⏳ Scenario Outlook:
✅ Bearish Bias Preferred below 1.1500 with confirmation of rejection.
🎯 Target Zone 1: 1.1234 – Strong structure & demand zone.
🎯 Target Zone 2 (Extended): 1.1086 – Major low from mid-May.
❌ Invalidation: A breakout and close above 1.1575 would neutralize the bearish outlook and open up higher targets toward 1.17.
Conclusion: The EURUSD pair presents a compelling short opportunity, with both technical resistance and macro pressure aligning for a retracement or reversal. Short setups are favored unless bulls reclaim and hold above the 1.1575 handle.

EURUSDHello Traders! 👋
What are your thoughts on EURUSD?
EURUSD remains below a key resistance zone, and at this stage, it does not appear to have enough momentum to break through.
We are watching for potential sell setups around this area.
As long as there is no daily candle close above the resistance, we expect a pullback toward the specified support level.
If a daily candle closes above the resistance zone, the bearish scenario will be invalidated, and the structure may shift.
Don’t forget to like and share your thoughts in the comments! ❤️

Trading Signals for EUR/USD buy above 1.1393 (200 EMA - 6/8 Early in the European session, the euro is trading around 1.1422, undergoing a technical correction after reaching the psychological level of 1.15.
The US Non-Farm Payrolls dat will be released in the American session, and strong volatility will hit the market. If the market reacts favorably to the US dollar, it could continue to pressure the EUR/USD pair.
On the other hand, if the data comes out negative for the US dollar, we could expect the to recover and could reach the 7/8 Murray level at 1.1596.
The indicator is showing a negative signal, so we believe that if the euro falls below the 6/8 Murray level in the coming hours, it will be seen as an opportunity to sell, with targets at the 200 EMA around 1.1290.
In the past, 1.1470 has acted as strong resistance, so we believe a technical correction could occur below this area this time. Therefor, we should be alert to see if the price consolidates below this level in order to sell.

EURUSD Breakout and Potential RetraceHey Traders, in today's trading session we are monitoring EURUSD for a buying opportunity around 1.13700 zone, EURUSD was trading in a downtrend and successfully managed to break it out. Currently is in a correction phase in which it is approaching the retrace area at 1.13700 support and resistance area.
Trade safe, Joe.

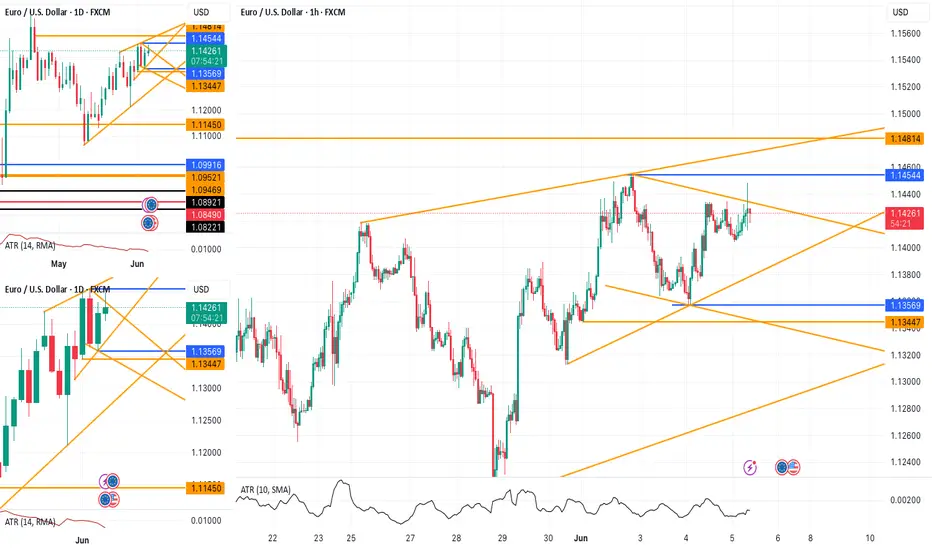
EUR/USD - After taking the highs, are the lows next?The EUR/USD currency pair is moving between two important price levels. The top level is 1.1454 and the bottom level is 1.1357. This means the price is staying inside a range. Yesterday, the price of EUR/USD went above the top level of 1.1454. By doing this, it triggered many stop-loss orders from traders who were expecting the price to go down. These traders had placed their stop-losses just above this level, and the market moved up to take them out.
Current support of the 1H FVG
Now, the price is starting to go down again. It is getting closer to the lower level of the range, which is around 1.1357. There is a chance that the market will go below this level as well. If that happens, it may take out the stop-loss orders of traders who are expecting the price to go up. These traders often place their stop-losses just below the low point of the range. When the market goes below the low, it collects liquidity. In simple words, it grabs the orders that are waiting there.
Looking at the chart, we can see that EUR/USD has found some support at the 1-hour Fair Value Gap (1H FVG). This area is acting like a short-term floor for the price. If a full 1-hour candle closes below this support area, then the price will likely fall further. In that case, it may reach the bottom of the range and possibly move below it to take out more stop-losses.
Why below support?
But why would the market go below the low on purpose? The reason is that many retail traders, those are small traders who trade from home, often put their stop-losses just below the recent low. If the market moves there, it activates those stop-losses. These stop-losses are usually sell orders, and when they get triggered, it gives the market extra selling power. After collecting this liquidity, the market often uses the new buying interest (from other traders entering long positions) to push the price back up again.
Conclusion
So in summary, the EUR/USD is still inside a range. It has already moved above the top to take out stop-losses, and now it might go below the bottom to do the same. After that, there could be a strong move upward, powered by the new liquidity in the market.
Disclosure: I am part of Trade Nation's Influencer program and receive a monthly fee for using their TradingView charts in my analysis.
Thanks for your support.
- Make sure to follow me so you don't miss out on the next analysis!
- Drop a like and leave a comment!

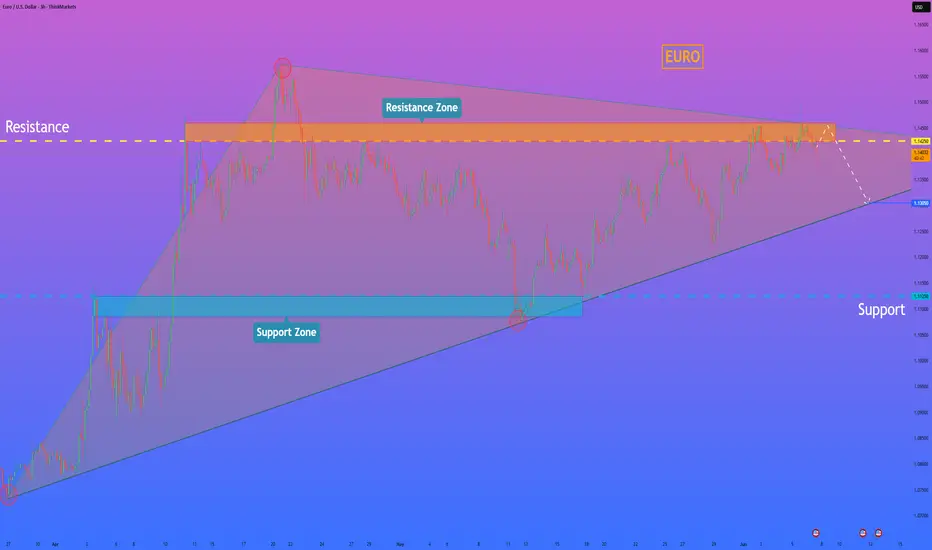
EURO - Price can boucne up of pennant, breaking resistance levelHi guys, this is my overview for EURUSD, feel free to check it and write your feedback in comments👊
Some time ago, price entered to pennant pattern, where it at once bounced up from support line and reached $1.0850 level.
Next, it broke this level and continued to grow to resistance level, and when Euro reached it, price broke it.
But, after price reached resistance line of pennant, it started to decline and soon broke $1.1380 level one more time.
Price fell to support line of pennant and then turned around and, in a short time rose to resistance area.
After this, price fell to support line of pennant, but recently started to grow and now trades near resistance level.
I believe Euro can correct slightly and then launch upward toward $1.1600, breaking resistance level.
If this post is useful to you, you can support me with like/boost and advice in comments❤️
Disclaimer: As part of ThinkMarkets’ Influencer Program, I am sponsored to share and publish their charts in my analysis.

EURO - Price will strart to grow and exit from wedge patternHi guys, this is my overview for EURUSD, feel free to check it and write your feedback in comments👊
Price entered to wedge pattern and at once dropped below $1.1455 level, breaking it and then some time traded below.
It continued to decline and in a short time reached $1.1220 level and broke it, after which fell to support line.
Then price started to grow and soon broke $1.1220 level one more time, after which made a retest and continued to grow.
Euro rose to $1.1420 points and then corrected to support level, after which turned around and rose to resistance level.
Recently price reached resistance level, but then it bounced and started to decline, and now it continues to fall.
I think that Euro can decline a little more and then bounce up to $1.1550, exiting from wedge.
If this post is useful to you, you can support me with like/boost and advice in comments❤️
Disclaimer: As part of ThinkMarkets’ Influencer Program, I am sponsored to share and publish their charts in my analysis.

Stronger U.S. JOLTS Data Pressures EURUSD!!!EURUSD ( FX:EURUSD ) failed to break the Resistance zone($1.1487-$1.1424) and started to fall again , breaking the Support lines .
In terms of Elliott Wave theory , it seems that EURUSD has managed to complete the main wave X of the Double Three Correction(WXY) structure .
Just moments ago, the U.S. JOLTS Job Openings data was released.
-------------------------------
Actual: 7.39M
Forecast: 7.11M
Previous: 7.19M
The stronger-than-expected JOLTS figure at 7.39 million signals a resilient labor market. This reduces recession fears and increases the likelihood that the Federal Reserve may keep interest rates elevated for longer.
Bullish for the U.S. Dollar( TVC:DXY )
Bearish pressure could hit EURUSD, especially if it's approaching the key resistance zone.
-------------------------------
I expect EURUSD to start to fall again after the pullback to the Support lines and to fall to the targets I have specified on the chart.
Note: If EURUSD touches $1.14580(Stop Loss(SL)), we can expect a failure of the Resistance zone($1.1487-$1.1424).
Please respect each other's ideas and express them politely if you agree or disagree.
Euro/U.S. Dollar Analyze (EURUSD), 1-hour time frame.
Be sure to follow the updated ideas.
Do not forget to put a Stop loss for your positions (For every position you want to open).
Please follow your strategy and updates; this is just my Idea, and I will gladly see your ideas in this post.
Please do not forget the ✅' like '✅ button 🙏😊 & Share it with your friends; thanks, and Trade safe.

EURUSD: Important Bullish Breakout The EURUSD broken above an important resistance zone on the daily chart.
We see its retest now.
I anticipate that the price will continue to rise from this point, aiming for a minimum target of 1.1515.

EURUSD: Bears May Regain Control of the PriceEURUSD: Bears May Regain Control of the Price
From our previous analysis, EURUSD extended the Z wave to 1.1495 due to high volatility and speculation related to Trump's comments against China and the old price theme.
However, nothing changed again. EURUSD found sellers near 1.1495 which had already rejected the price again and it seems that the downward movement may resume soon.
We do not have clear signs of a reversal yet, but as long as the price is holding and the patterns are valid, the chances are that EURUSD will fall as shown in the chart.
Bearish Targets:
1.1230 – First major support level
1.1100 – Possible second target
1.1000 – A deeper correction point
1.0900 – Strong structural support
You may find more details in the chart!
Thank you and Good Luck!
❤️PS: Please support with a like or comment if you find this analysis useful for your trading day❤️
Disclosure: I am part of Trade Nation's Influencer program and receive a monthly fee for using their TradingView charts in my analysis.

Euro will rise to seller zone and then drop to support lineHello traders, I want share with you my opinion about Euro. At first, price was moving inside a downward channel, forming lower highs and lower lows. Each rejection from the resistance line pushed the price lower, and the structure remained bearish until the price reached the buyer zone near 1.1210 - 1.1185 points. A strong rebound from this area triggered a breakout from the channel, signaling a shift in market dynamics. After this breakout, the trend reversed and price started forming an upward channel, with clean impulses and structured corrections. Bulls began stepping in from higher support levels, and the market started respecting the new rising support and resistance lines. Now the price is approaching the seller zone at 1.1435 - 1.1460 points and has already shown signs of rejection from that area. Given this setup, I believe EURUSD may start to decline and fall back toward the support line of the upward channel. That’s why I’ve placed my TP at 1.1325 points, which aligns with the channel's support structure. Please share this idea with your friends and click Boost 🚀
Disclaimer: As part of ThinkMarkets’ Influencer Program, I am sponsored to share and publish their charts in my analysis.

Trading Signals for EUR/USD sell below 1.1432 (21 SMA-6/8 MurrayEUR/USD is trading around 1.1410, below the Murray 6/8 level and within the uptrend channel formed on May 9.
The instrument has an area where buyers have found it easier to take profits around 1.1476. This level could be a barrier for the euro, and from there we could expect a technical correction.
If the bullish force prevails, the euro could reach the top of the uptrend channel around 1.1474 and even the psychological level of 1.1500.
Technically, we observe that the euro is overbought and there could be a technical correction in the coming days, as crucial data from the United States will be released later this week, which could generate strong volatility in the market.
The indicator is showing a negative signal, so if an additional upward movement occurs above the current price, we could consider selling as long as the instrument consolidates below 1.1500.

EUR/USD - Sweeping the highs, retracement following?The EUR/USD has experienced a steep and aggressive bullish run today, showing strong upward momentum across multiple timeframes. This impulsive move has led to a sweep of the recent highs, taking out key liquidity levels that were resting above previous swing points. In the context of smart money concepts and institutional trading models, such a move typically signifies the activation of buy-side liquidity, where stop-loss orders and breakout entries are triggered above a well-defined high. This behavior is often engineered by larger market participants to fulfill liquidity objectives before potentially reversing or retracing.
During this strong bullish leg, the EUR/USD left behind a noticeable imbalance, commonly referred to as a Fair Value Gap (FVG), on the lower timeframes. This imbalance reflects an area where price moved too rapidly, leaving behind unfilled orders and creating a price inefficiency. Specifically, an FVG remains open around the 1.13700 level, a zone that was bypassed during the impulsive rally and now stands as a likely magnet for price in the near term. These imbalances are significant because price tends to revisit them to seek equilibrium and fill in the inefficient areas, especially after a major liquidity grab.
The sweep of the highs was a classic liquidity-taking event. When price runs above a prominent high, especially one that's visible on higher timeframes like the 4H or daily, it often signals that buy stops (retail breakout entries or protective stops) have been targeted. Once these stops are taken, there is typically a shift in market behavior. The aggressive buyers have been filled, and institutional players may look to reverse or retrace price toward areas of unfilled orders, such as the aforementioned FVG. The market often transitions from a state of expansion (impulse move) to a state of rebalancing or consolidation, which opens the door for a pullback.
Given that the liquidity above the highs has been taken and that the 1.13700 gap remains unmitigated, it becomes increasingly likely that EUR/USD will begin a retracement. This corrective move would serve to rebalance the price, revisit the inefficiency, and potentially test the validity of any newly-formed demand zones. From a technical standpoint, this area is crucial, not only because of the gap itself but also due to its positioning in relation to prior market structure.
In summary, today’s bullish extension in EUR/USD accomplished a major liquidity objective by sweeping the highs. However, the move left behind a significant imbalance at 1.13700, suggesting that the pair could be due for a corrective pullback to fill the gap. Traders should monitor lower timeframes for signs of distribution, potential shifts in market structure, or bearish order blocks forming after the sweep. All of these could provide clues that the market is preparing to return to the gap and restore price efficiency.
Thanks for your support.
- Make sure to follow me so you don't miss out on the next analysis!
- Drop a like and leave a comment!

Bigger correction for EUHi traders,
Last week EU did not make an impulse wave 3 but instead it slowly went up. And after the ECB rate decision on Thursday it started to drop.
At the moment the pattern is not very clear.
This could be a bigger correction down for wave 4 (black) so my main bias is to the downside.
Let's see what the market does and react.
Trade idea: Wait for the finish of a small correction up to trade shorts.
If you want to learn more about trading with FVG's, liquidity sweeps and Wave analysis, then make sure to follow me.
This shared post is only my point of view on what could be the next move in this pair based on my technical analysis.
Don't be emotional, just trade your plan!
Eduwave

EURO - Price can drop to $1.1280, breaking support levelHi guys, this is my overview for EURO, feel free to check it and write your feedback in comments👊
A few days ago price broke $1.1375 level and then entered to triangle pattern, where it at once dropped from resistance line.
Price fell to $1.1375 level, where it some time traded between and then continued to decline to $1.1220 level.
When Euro declined to this level, it at once broke this level and fell to support line of a triangle pattern.
Next, price turned around and in a short time rose higher than $1.1220 level, breaking it and continued to grow next.
Euro rose to resistance line and then corrected, after which it made an upward impulse, thereby exiting from triangle.
Now, price traded inside resistance area, near $1.1375 level, and I think EUR can drop to $1.1280
If this post is useful to you, you can support me with like/boost and advice in comments❤️
Disclaimer: As part of ThinkMarkets’ Influencer Program, I am sponsored to share and publish their charts in my analysis.

Euro will correct a little and then continue to move up nextHello traders, I want share with you my opinion about Euro. Observing this chart, we can see how the price entered to upward channel, where it at once dropped from the resistance line to the support line and then started to grow. In a short time price rose to the 1.1210 level, broke it, and even rose a little more, but soon turned around and declined to the support line of the channel. Then the Euro made an upward impulse, and then broke the 1.1210 level one more time and continued to grow inside the channel. Later price reached the resistance line of the channel and then corrected, after which, in a short time rose to the support area, breaking the 1.1400 level. But soon the price turned around and dropped to the 1.1210 level, thereby exiting from channel. Next, Euro continued to grow inside the wedge, where it rose to the current support level and soon broke it. After this, the price rose to the resistance line of the wedge and then corrected, after which it made an upward impulse. Price exited from the wedge, and now I think that the Euro can make a correction, after the rise, and then continue to grow next. That's why I set my TP at 1.1560 points. Please share this idea with your friends and click Boost 🚀
Disclaimer: As part of ThinkMarkets’ Influencer Program, I am sponsored to share and publish their charts in my analysis.

03.06.25 Morning ForecastPairs on Watch -
FX:EURUSD
FX:GBPAUD
FX:AUDUSD
FX:AUDCAD
A short overview of the instruments I am looking at for today, multi-timeframe analysis down to what I will be looking at for an entry. Enjoy!

EURUSD 15 MIN Long📊 EUR/USD Smart Money Concept Trade Idea – 15-Minute Chart
This setup highlights a textbook example of how market structure, liquidity grabs, and Fibonacci confluence can provide high-probability trade setups.
🔍 Breakdown:
Support Respected (Left Side)
Price previously respected a key support zone, leading to a strong bullish impulse.
Previous Support → Resistance Flip
Once price revisited this zone (marked in red), it failed to hold, indicating a shift in sentiment. This became a liquidity zone where early buyers got trapped.
Liquidity Grab (Red Line)
Notice how price dipped below the previous swing low, triggering stop-losses from buyers. This is a liquidity grab, a classic smart money move to fuel large buy orders.
Structure Shift (Green Label)
After the liquidity grab, price formed a higher high, indicating a potential shift in market structure from bearish to bullish.
50% Fibonacci Level (Green Line)
The price then retraced perfectly to the 50% Fibonacci level of the bullish leg post-liquidity grab – a golden zone often used by institutions for entries.
Re-Entry After Pullback
The retracement to the 50 FIB level after the structure shift provided a low-risk, high-reward long opportunity, targeting the previous liquidity zone (blue line) as take-profit.
Target & Stop Placement
Entry: Around the 50 FIB level
Stop: Below the liquidity grab low
Take Profit: Near the previous liquidity zone (marked in blue), where many sell-side stops likely sit

HelenP. I Euro may continue to decline to trend lineHi folks today I'm prepared for you Euro analytics. In this chart, we can see how the price reached the trend line and then started to grow inside a triangle pattern. Price some time traded near the trend line and then made an impulse up to the support level, which coincided with the support zone, and then made a correction, after which it turned around and made an impulse up one more time, breaking the support level. The euro reached the resistance level, which coincided with the resistance zone, and then made a small correction, after which it continued to move up and rose to the resistance line of the triangle. But then the Euro dropped below the resistance level, breaking it, and then continued to decline, after a retest. Price fell to the support zone, where it rebounded from the trend line, which is the support line of the triangle as well, and then started to grow. The euro has grown to a resistance zone, but recently it started to fall and now trades below the 1.1425 resistance level. So, I think that EURUSD will enter to resistance zone one more time and then continue to fall to the trend line. For this case, I set my goal at 1.1305 points, which coincided with this line. If you like my analytics you may support me with your like/comment ❤️
Disclaimer: As part of ThinkMarkets’ Influencer Program, I am sponsored to share and publish their charts in my analysis.
EURUSD: heading toward double-top?The jobs data were in the spotlight of the US market during the previous week. The JOLTs job openings in April reached 7,391M, a bit hotter from market forecast of 7,10M. The Non-farm Payrolls in May added 139K new jobs, which was modestly higher from the forecasted 130K. The unemployment rate remained unchanged in May at the level of 4,2%. The average hourly earnings were higher by 0,4% for the month and 3,9% for the year. As for other posted data, the US ISM Manufacturing PMI for May was standing at 48,5, modestly below market estimate of 49,5. The ISM Services in May were standing at 49,9, lower from estimated 52,3.
Previous week on the European market was marked with an eighth rate cut by 25bps, bringing the reference rate to 2%. Potential further rate cuts will continue to be data-driven. The ECB also cut its inflation forecast till the end of this year to 2%, from 2,3% forecasted previously. At the same time, the posted flash inflation rate in the Euro Zone in May is 1,9% on a yearly basis, which was below market estimate of 2%. The core inflation continues to be a bit elevated, standing at the level of 2,3% y/y in May. EuroZone inflation in May was 0% compared to the previous month. The Producers Price Index in the Euro Zone in May was down by -2,2% for the month, and 0,7% on a yearly basis. The balance of trade in Germany in April had a surplus of euro 14B, which was significantly lower from estimated euro 20,2B.
During the previous week the currency pair was moving relatively slowly, within a short range. Fundamentals were shaping the investors sentiment. One one side, the ECB new cut of reference rates, while on the other side were relatively stable jobs data for the US market. The eurusd spent the previous week in a range between 1,1340 and 1,1450. There was a short move toward the 1,1490 on Thursday, but the market was not willing to test the 1,15 level on this occasion. Based on moves, the market is still not ready to move away from 1,14 lines. The RSI continues to move above the level of 50, indicating again that the market is not ready to take the path toward the oversold market side. The MA50 continues to diverge from its MA200 counterpart, without an indication of a potential change of course in the coming period.
The week ahead is bringing US inflation data for May as well as inflation expectations from the University of Michigan survey. In case of some negative movements in this segment, the market reaction might be triggered. In this case it could be expected further weakening of the US Dollar against Euro, and a trigger for testing of the 1,15 level. Highs from April this year at 1,1570 might easily become the market target. However, if May inflation holds at levels expected by the market, which could be the most likely scenario, then some short term straightening of US Dollar might take place. The first stop would certainly be the 1,14 level, while the next one stands at 1,1275. It is interesting to mention higher potential for double top formation in the technical analysis, which eurusd is currently modestly forming. In case that the double top is triggered in the coming week or two, then the next level for eurusd could be 1,12 level, where highs from September 2024 stands. However, this scenario, if it occurs, could be revealed within the next few weeks.
Important news to watch during the week ahead are:
EUR: Industrial Production in April in the EuroZone, final inflation rate in May for Germany
USD: Inflation rate in May, Producers Price Index in May, University of Michigan Consumer Sentiment preliminary for June.

EURUSD Long Setup Above 1.14544 – Trendline in FocusFX:EURUSD is showing a potential long setup if price breaks above the 1.14544 level . The trade's potential is influenced by an ascending trendline around 1.14710 . If the market hesitates at this level, it may be wise to close the position or move the stop loss to breakeven .