EURUSD is Nearing the Daily Uptrend! Hey Traders, in today's trading session we are monitoring EURUSD for a buying opportunity around 1.15800 zone, EURUSD is trading in an uptrend and currently is in a correction phase in which it is approaching the trend at 1.15800 support and resistance area.
Trade safe, Joe.
USDEUR trade ideas

EURUSD Analysis - Can Buyers Push Price To $1.18000?Hello all dear traders!
EURUSD is trading within a clear bullish channel, with price action consistently respecting both the upper and lower boundaries. The recent bullish momentum shows that buyers are in control, suggesting further upside.
The price recently broke above a key resistance zone and is now coming back to retest it. If this level holds as support, it will consolidate the bullish structure and increase the likelihood of a move towards the 1.18000 target, which is in line with the upper boundary of the channel.
As long as the price remains above this support zone, the bullish outlook remains intact. However, a failure to hold this level could invalidate the bullish scenario and increase the likelihood of a deeper pullback.
Remember, always validate your setups and use appropriate risk management.

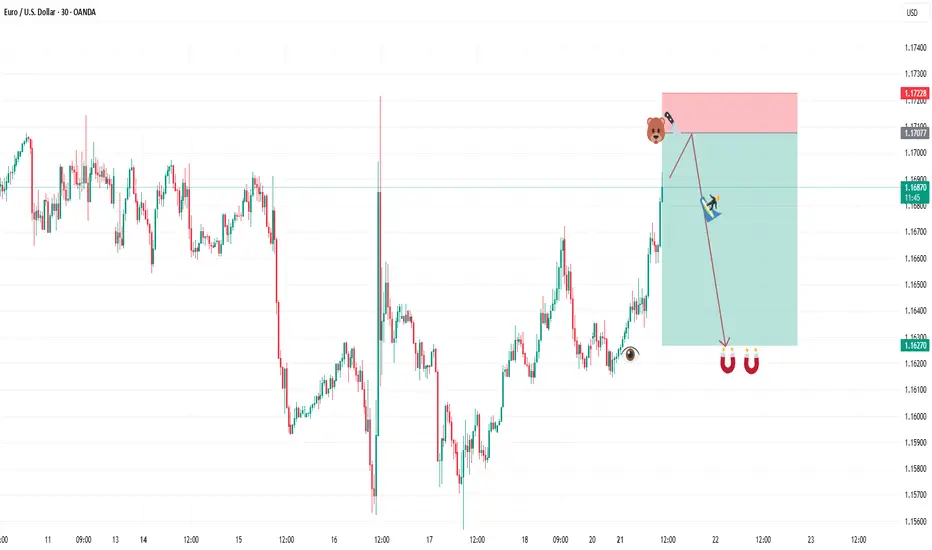
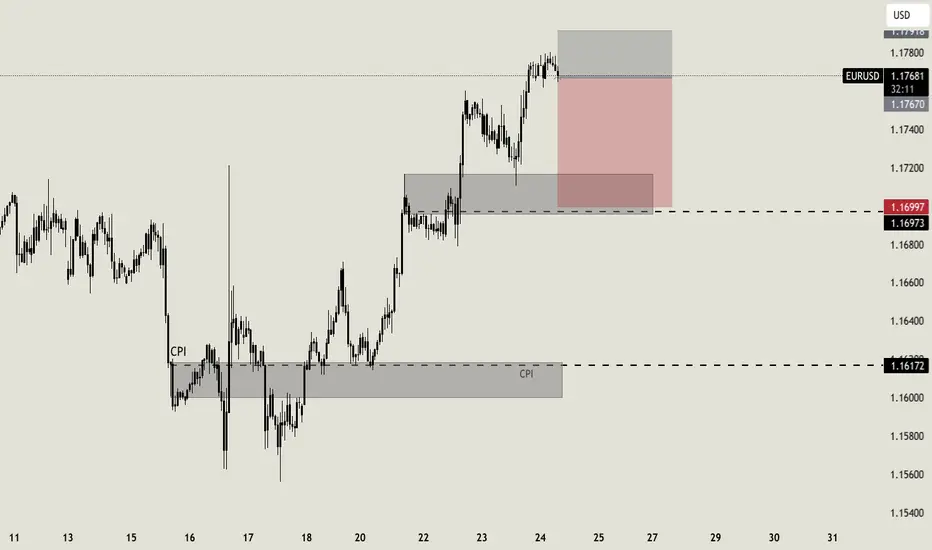
SELL EURUSDAfter todays buys hitting our target we are shifting to a sell play. Our entry is at 1.16878 and second entry at 1.17077. Our stop loss is at 1.17228 and target is at 1.16270. Use proper risk management and best of luck. Algounlocked
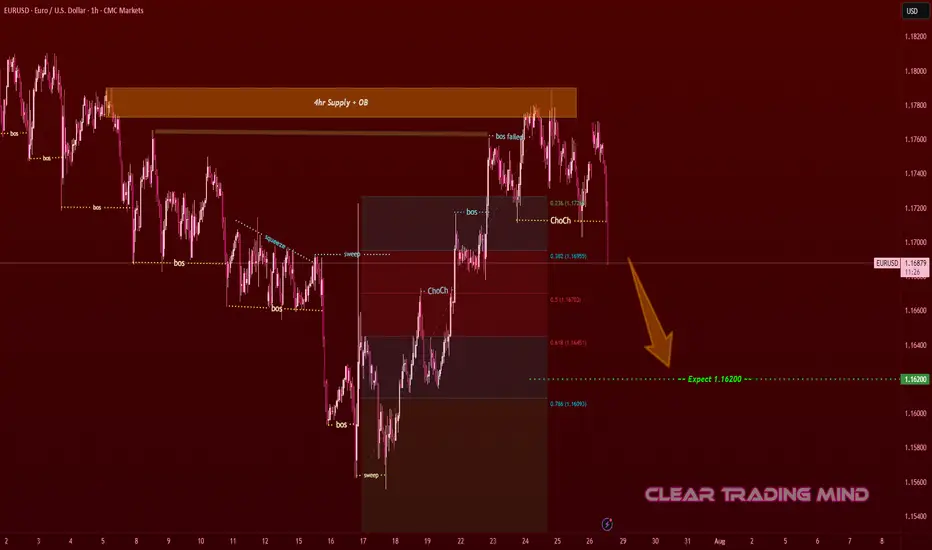
EURUSD Supply Rejection – Bearish Move ExpectedOn the 1-hour chart, EURUSD tapped into the 4hr Supply + OB zone 🟧 and failed to hold above previous structure.
- BoS (Break of Structure) shows weakness at highs
- ChoCh (Change of Character) confirms bearish shift
- Price rejected from 0.236 Fib level (1.17400) and is moving lower
Plan:
- Expecting price to move toward 1.16200 (≈ 120 pips from current level) 🎯
- Bearish momentum remains valid as long as price stays below supply zone
- Confirmation candles & retests strengthen short bias
Reasoning:
- Supply zone rejection + failed breakout
- Clear structure shift (ChoCh) toward lower lows
- Fib retracement confluence (0.5 – 0.618 zone) aligning with sell pressure
(Not financial advice – only a personal observation)
EUR/USD - Daily Chart (Wedge Breakout) (16.07.2025) The EUR/USD Pair on the D1 timeframe presents a Potential Selling Opportunity due to a recent Formation of a Wedge Pattern. This suggests a shift in momentum towards the downside in the coming Days.
Possible Short Trade:
Entry: Consider Entering A Short Position around Trendline Of The Pattern.
Target Levels:
1st Support – 1.0956
2nd Support – 1.0625
💡 Fundamental & Sentiment Context
Euro under pressure amid renewed concerns over EU‑US trade friction .
The USD is strengthening, supported by safe‑haven flows amid tariff uncertainties.
🎁 Please hit the like button and
🎁 Leave a comment to support for My Post !
Your likes and comments are incredibly motivating and will encourage me to share more analysis with you.
Best Regards, KABHI_TA_TRADING
Thank you.
Disclosure: I am part of Trade Nation's Influencer program and receive a monthly fee for using their TradingView charts in my analysis.

#EURUSD - Pivot Point is 1.174Date: 22-07-2025
#EURUSD - Current Price: 1.175
Pivot Point: 1.174 Support: 1.162 Resistance: 1.185
Upside Targets:
Target 1: 1.190
Target 2: 1.195
Target 3: 1.203
Target 4: 1.211
Downside Targets:
Target 1: 1.157
Target 2: 1.152
Target 3: 1.144
Target 4: 1.136
#TradingView #Forex #Currency #StockMarket #Investing #Trading #EURUSD
#TechnicalAnalysis #SotockCharts #Finance
#PivotPoints #SupportResistance

EURUSD LONG AND EDUCATIONAL EXPLANATION ON SNIPER TRADESEUR/USD climbs to two-week tops around 1.1760
EUR/USD now gathers extra steam and advances to new two-week peaks around 1.1760 on Tuesday. The increasing selling pressure continues to hurt the US Dollar amid steady trade concerns and rising effervescence surrounding the Trump-Powell spat.

EUR/USD BREAKS ABOVE RESISTANCE APPROACHING JULY HIGH! Hey Traders so looking at the EUR/USD still looking bullish if you took the buy zone at 1.571 consider moving stop now to Break Even.
IMO taking the risk out of a trade is the first step before locking in a profit. So now we approach July high at 1.833.
I always say markets can do 3 things as they approach significant support or resistance.
1. Consolidate
2. Breakthrough
3. Reverse
However you want to give the market room to breathe so I would start to lock in profit by staying 3 days behind market. So if you want to try this profit taking wait until tommorows candle finishes and then move the stop 3 days behind the market at 1.1670. Then just manually let the market decide when to stop you out. Just say behind 3 days behind market.
So if bullish consider protecting stops or small profit taking.
However if Bearish I don't think now is the time to short unless a significant reversal takes place and support is broken.
Good Luck & Always use Risk Management!
(Just in we are wrong in our analysis most experts recommend never to risk more than 2% of your account equity on any given trade.)
Hope This Helps Your Trading 😃
Clifford

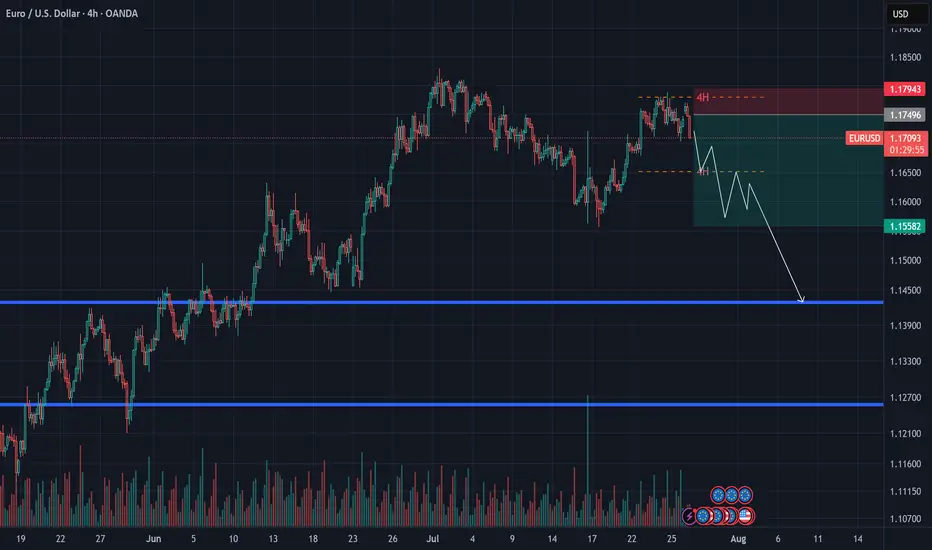
EURUSD Outlook – July 27, 2025This week, the EU is set to release key economic data, including GDP figures.
Given the recent U.S. tariff pressure, there’s a strong chance that these numbers will come in weak — weighing further on the euro.
📉 After bouncing from the 1.15 level, EURUSD entered a corrective move, but even with extended consolidation, it failed to reach the previous high — a sign of growing exhaustion.
📌 Price action suggests a lack of bullish momentum, and candles are reflecting market fatigue.
🔁 I expect the euro to enter a mid-term corrective phase, potentially heading back toward the 1.13 zone.
🎯 A short entry below 1.18 could offer a favorable risk-reward setup.
Xmoon Indicator Tutorial – Part 1 – Strategy🔻🔻🔻+ Persian version below🔻🔻🔻
📘 Xmoon Indicator Tutorial – Part 1
🎯 3Push Divergence RSI Strategy
🔥 The core of the Xmoon indicator
is built upon one of the most powerful strategies in technical analysis:
The advanced 3Push Divergence RSI pattern
🔁 A pattern that typically appears at key market turning points.
📉 When the price moves in the same direction three consecutive times on pivot points (e.g., making lower lows or higher highs), but the RSI shows the opposite behavior, it indicates a clear divergence !
💡 This divergence can act as a strong signal for a potential trend reversal.
🎯 The Xmoon Indicator is designed to detect this critical moment.
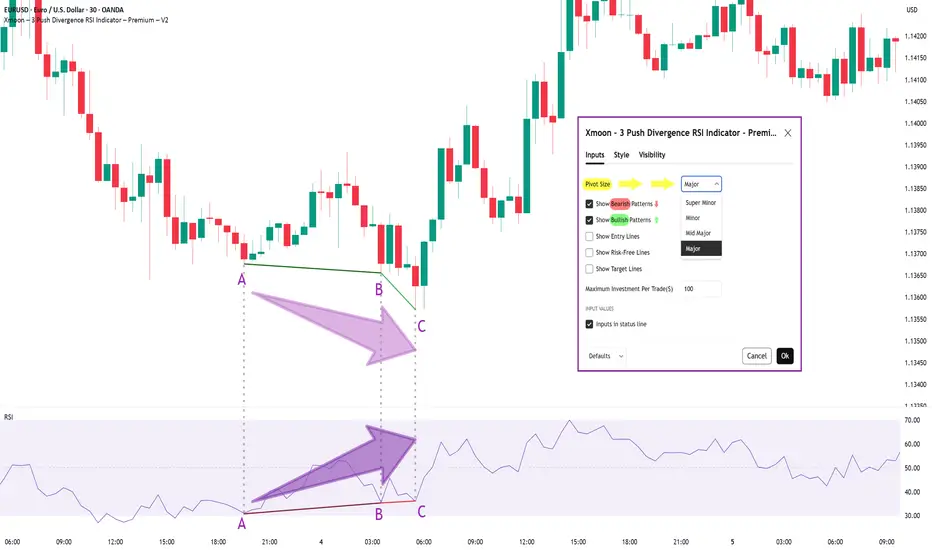
⚙️ Xmoon Indicator Settings Panel
The Xmoon settings panel offers the following options:
🔸 Pattern Type Selection: In the first and second lines, you can specify which type of pattern should be displayed: only bullish patterns or only bearish ones. You can also check both options.
🔸 Pivot Type Selection: From the dropdown menu, you can choose one of four pivot types:
“Super Minor”, “Minor”, “Mid-Major”, and “Major”, ordered from smallest to largest.
📌 Educational Note: The greater the distance (in candle count) between two lows or two highs, the larger the pivot is considered.
A Major Pivot is the largest among them.
✅ Larger Pivot = Higher Accuracy
❗ But naturally = Fewer Signals
📣 If you have any questions or need guidance, feel free to ask us. We’d be happy to help.
🔻🔻🔻بخش فارسی – Persian Section 🔻🔻🔻
📘 آموزش اندیکاتور ایکسمون - قسمت اول
🎯 استراتژی سهپوش واگرایی (3Push Divergence RSI)
🔥 هسته اصلی ایکسمون
بر پایه یکی از قویترین استراتژیهای تحلیل تکنیکال طراحی شده است
الگوی پیشرفته سهپوش واگرایی
🔁 الگویی که معمولاً در نقاط چرخش مهم بازار ظاهر میشود
📉 وقتی قیمت سه بار پشت سر هم روی نقاط پیوت ، در یک جهت حرکت میکند (مثلاً کفهای پایینتر یا سقفهای بالاتر میسازد) ، اما آر-اِس-آی خلاف آن را نشان میدهد، یعنی یک واگرایی آشکار رخ داده است
💡این واگرایی میتواند سیگنالی قوی برای برگشت روند باشد
🎯 اندیکاتور ایکسمون این لحظه را شناسایی میکند
⚙️ پنجره تنظیمات اندیکاتور ایکسمون
در بخش تنظیمات اندیکاتور ایکسمون، امکاناتی در اختیار شما قرار دارند
🔸 انتخاب نوع الگو: در خط اول و دوم میتوانید مشخص کنید چه نوع الگویی نمایش داده شود
فقط الگوهای صعودی یا فقط نزولی. همچنین می توانید تیک هر دو گزینه را بزنید
🔸 انتخاب نوع پیوتها: از پنجره کشویی بالا، می توانید یکی از ۴ نوع پیوت را انتخاب کنید
پیوت ها به ترتیب از کوچک به بزرگ عبارتند از: سوپر مینور ، مینور ، میدماژور و ماژور
📌 نکته آموزشی: هرچه فاصله بین دو کف یا دو سقف بیشتر باشد (یعنی تعداد کندلهای بین آنها زیادتر باشد)، آن پیوت، بزرگتر محسوب میشود
پیوت ماژور از بقیه بزرگ تر است
✅ پیوت بزرگتر = دقت بالاتر
❗ اما طبیعتاً = تعداد سیگنال کمتر
📣 اگر سوالی دارید یا نیاز به راهنمایی دارید، خوشحال میشویم از ما بپرسید
با کمال میل در خدمتتان هستیم
EUR/USD - Sells on H1EUR/USD broke an Ascending Channel and have also shifted the trend downwards.
We will wait for a pullback to 0.5 - 0.618 Fib level for entry with the SL placed above the last high

eurusd sell tradeThe Relative Strength Index (RSI) is showing a downward trend, indicating weakening momentum. Additionally, the Moving Average Convergence Divergence (MACD) is showing a bearish crossover, further supporting the potential for a downward move

EURUSDPossible sell opportunity. Waiting for price to make a retest + bearish confirmation on the smaller time frame before we go short.
@musehanezwothe

EURUSD Intraweek tradeI know, it's Thursday, but i still think that this can be a good intraweek trade. I expect the price to perform a correction here, till the support area at 1.17. If my analysis is correct i expect the price to be there later today or tomorrow morning

EURUSD: Long Signal with Entry/SL/TP
EURUSD
- Classic bullish pattern
- Our team expects retracement
SUGGESTED TRADE:
Swing Trade
Buy EURUSD
Entry - 1.1724
Stop - 1.1714
Take - 1.1743
Our Risk - 1%
Start protection of your profits from lower levels
Disclosure: I am part of Trade Nation's Influencer program and receive a monthly fee for using their TradingView charts in my analysis.
❤️ Please, support our work with like & comment! ❤️

EURUSDEURUSD bulish
Making HHs HLs
RIsk free as per your risk as news in noon if positive it can go further up in no time or negative new can change trend

EURUSD"As you can see in this analysis, the price is moving within an ascending channel on the 15-minute timeframe. I expect the price to react in the area that I have marked in blue, and if I see appropriate candlestick patterns, I will enter a buy position."

EURUSD LongEURUSD 15-Minute Technical Analysis
EURUSD has broken through a key intraday structure level with strong bullish momentum, indicating continued institutional interest on the buy side. The market is now approaching a higher-timeframe supply region while leaving behind a well-defined demand zone that could serve as a launchpad for further upside.
🔍 Market Structure & Momentum:
Break of Structure (BOS) was confirmed after the recent surge above the previous high, validating the current bullish trend.
Price has rallied aggressively from the IDM low at 1.16908, sweeping short-term liquidity and suggesting smart money involvement.
We are now trading inside a minor supply zone and approaching a broader liquidity cluster between 1.17550 – 1.17800.
🟩 Key Demand Zone
Level: 1.16980 – 1.17100
This zone marks a significant accumulation area where the market built up momentum before the breakout. It's also in line with the IDM (Internal Drawdown Marker), serving as a technical retracement level.
A retracement into this demand zone would align with a classic bullish continuation pattern, offering a potential re-entry area for long positions.
The imbalance left behind further supports this zone’s potential to hold.
🟥 Overhead Supply Zones (Resistance Clusters):
First Zone: 1.17550 – 1.17700
Second Zone (Stronger): 1.17750 – 1.17900
These zones represent unmitigated supply levels from previous sell-offs and may act as profit-taking or short-term reversal points for intraday traders. These areas are where we expect higher levels of volatility and potential bearish reaction before continuation or reversal.
📈 Expectations & Trade Setup:
Anticipation of a retracement into the 1.16980–1.17100 demand zone for price to establish a higher low before pushing toward unfilled liquidity above 1.17550.
If demand holds, a bullish continuation could aim for 1.17750–1.17900, where confluence with past supply suggests caution.
Should price fail to hold the demand, bearish momentum could pull price back toward the lower demand block at 1.16500 (aligned with the 0.5 fib level of the prior impulse).

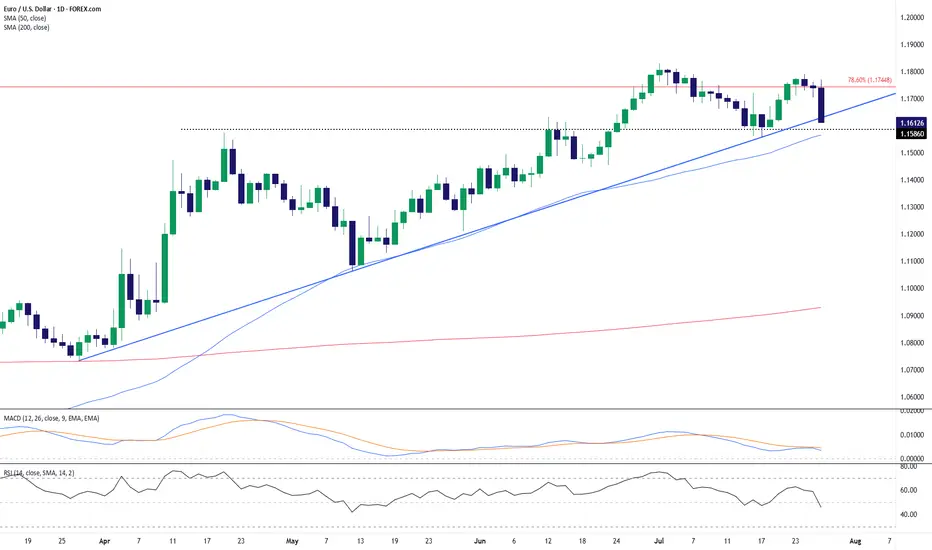
EUR/USD: Breakdown From Key Fib Confluence Threatens UptrendEUR/USD has snapped a key confluence zone after rejecting the 78.6% Fibonacci retracement level near 1.1745. The latest daily candle shows a sharp bearish engulfing bar that sliced below both the ascending trendline and the 50-day SMA (1.1565), signaling a potential trend reversal or deeper correction.
This breakdown follows a multi-week uptrend, and momentum indicators are starting to confirm the bearish shift:
MACD is showing a bearish crossover below the signal line.
RSI has dropped below 50 (currently around 45.8), reflecting weakening bullish momentum.
The pair has now settled just above horizontal support near 1.1586. A decisive close below this level could open the door toward the next support zone around 1.1450–1.1500, where prior consolidation and the rising 200-day SMA (1.0929) may act as stronger demand.
Bulls will need to reclaim the 1.1650–1.1700 zone and see a bullish crossover on momentum indicators to regain control. Until then, the path of least resistance appears tilted to the downside, especially with trendline and Fib support now breached.
Bias: Bearish while below 1.1700. Watch for continuation lower if 1.1586 fails to hold.
-MW

EUR USD longas trend suggest and as today is Friday everything should settle this trade can be viable but the question that the target will hit would not be answered today
Please note: This is for educational purposes only and not a trading signal. These ideas are shared purely for back testing and to exchange views. The goal is to inspire ideas and encourage discussion. If you notice anything wrong, feel free to share your thoughts. In the end, to learn is to share !

EURUSD BUYTapped into an orderblock on the 4hr time frame, so i scaled down to the 30mins to look for a buy entry
Entry : 1.17172
TP : 1.17891
SL : 1.17001
