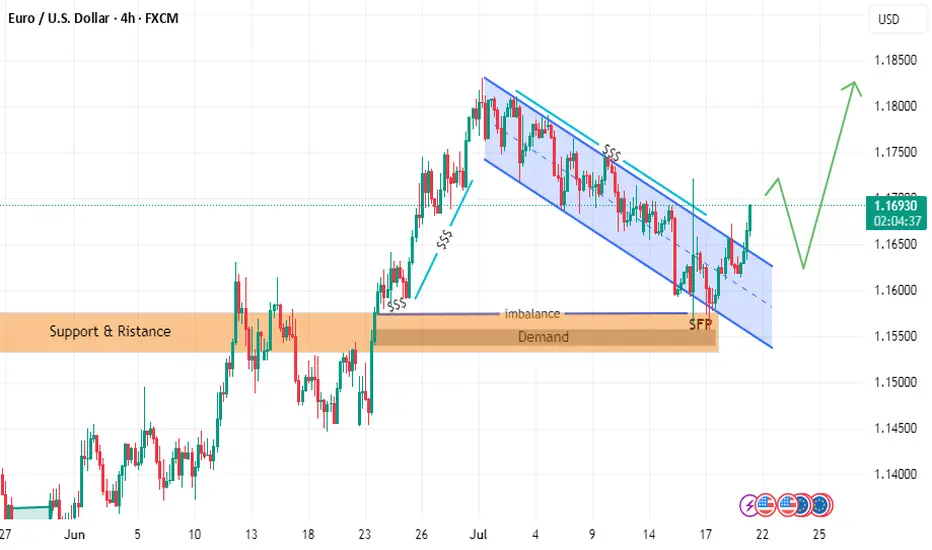
follow EURUSD LION & PLANE BUY SETUPTHE PRICE has moved as I explained in the last two posts
but we have some update to go along the way
the price could break failing channel
and withdrawal liquidity and filled imbalance
hence reflect from demand zone with zero reflection as i explained in last post with rock and plane
and it will go up to take liquidity in failing channel or downtrend
USDEUR trade ideas
What's Next On EURUSDPrice currently leans toward a bearish pullback after a series of impulsive bullish moves. So far, we haven’t seen any significant retracement since the rally began. As we anticipate a potential correction, could this be the awaited moment for the bears to step in—especially with only weaker structures left behind and bearish pressure building?
Regardless, every market scenario demands discipline and proper risk management.
Thinking of taking this outlook? Be sure to wait for strong confirmation before jumping in.
Good luck, traders, as we watch price unfold.
👉 Follow for more updates. See you in the next one 😉.

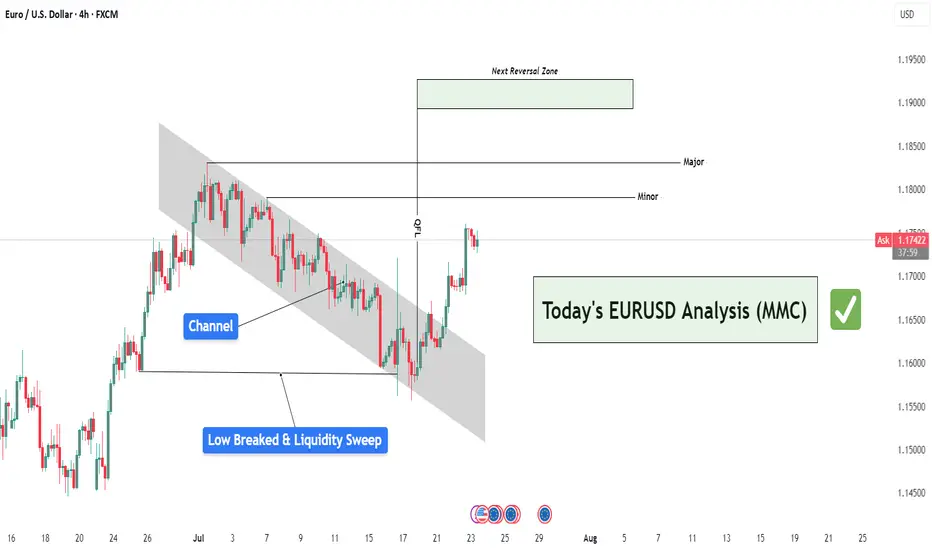
EURUSD Analysis : Liquidity Sweep – EURUSD Targets TO Reversal🧠 Institutional Context & Big Picture
EURUSD has been in a tightly controlled descending channel for several weeks—a classic sign of a market being engineered for liquidity collection. Rather than a naturally trending bearish market, this price action reflects stealth accumulation and market maker manipulation.
The channel structure was used to:
Establish a visible bearish trend (to trap sellers)
Trigger emotional bias for continued shorting
Build up stop orders below swing lows
This phase was about building energy, not continuation.
🔍 Detailed Breakdown of the Chart Elements
📌 1. Descending Channel – Controlled Manipulation
The pair moved within a well-defined bearish channel for multiple weeks.
Each touch respected the top and bottom perfectly—not random, but institutional structure.
It fostered retail confidence in the downtrend while market makers prepared for a reversal.
💥 2. Liquidity Sweep & Trap (Low Breaked & Liquidity Grabbed)
Price spiked below the previous low, clearly sweeping liquidity on July 21.
This is the "engineered breakdown", meant to trigger breakout sellers and stop out early longs.
Immediately after the sweep, the price violently reversed—clear evidence of a liquidity trap.
This is classic MMC logic: induce, trap, reverse.
🟩 3. QFL Base Formed – Bullish Engine Ignited
At the point of reversal, the chart shows the formation of a QFL (Qualified Liquidation Failure) zone.
This QFL base is the core of smart money accumulation—price broke below a base, then quickly reclaimed it.
It's not just support—it’s the true origin of the reversal and an optimal entry point.
📈 4. Breakout from the Channel – Structure Shift Confirmed
Price broke out of the descending channel with strong momentum, confirming:
Structure shift from lower lows → higher highs
Momentum shift in favor of bulls
Entry confirmation for MMC-based long setups
This breakout invalidates the bearish trend and signals a fresh leg up, likely toward unmitigated supply zones.
🟨 5. Current Price Action – Healthy Bullish Consolidation
After the breakout, price is consolidating just above the broken channel, forming a mini-flag or base.
This indicates:
Smart money is accumulating more
No significant selling pressure
Likely continuation toward next supply
🎯 6. Next Targets – Reversal Zones
Minor Resistance: ~1.1800
Major Resistance: ~1.1850 – 1.1880
Next Reversal Zone: 1.1900–1.1950
This zone is highlighted as a potential sell-off area where institutions may offload positions or create new traps.
Watch for signs of exhaustion or redistribution here.
📌 Trade Plan Based on MMC Structure
✅ Bullish Scenario (Currently Active)
Entry Area: Ideally at QFL base or breakout retest (~1.1700–1.1720 zone)
Confirmation: Bullish price action (engulfing, flag break, or liquidity wick)
Targets:
🎯 TP1: 1.1800
🎯 TP2: 1.1850
🎯 TP3: 1.1950 (Reversal Supply Zone)
❌ Invalidation:
A break below the QFL base (~1.1670) with bearish volume would invalidate the bullish MMC structure.
🧠 Smart Money Insight & Logic Recap
This entire move reflects a classic Market Maker Strategy:
Build a trend (descending channel) to shape trader bias
Trigger liquidity events (false breakdown)
Accumulate at the lows via QFL logic
Shift structure (channel breakout)
Target unfilled institutional supply (1.1850–1.1950)
This isn’t random—it’s engineered movement. Your job as a trader is to identify footprints, not follow the crowd.
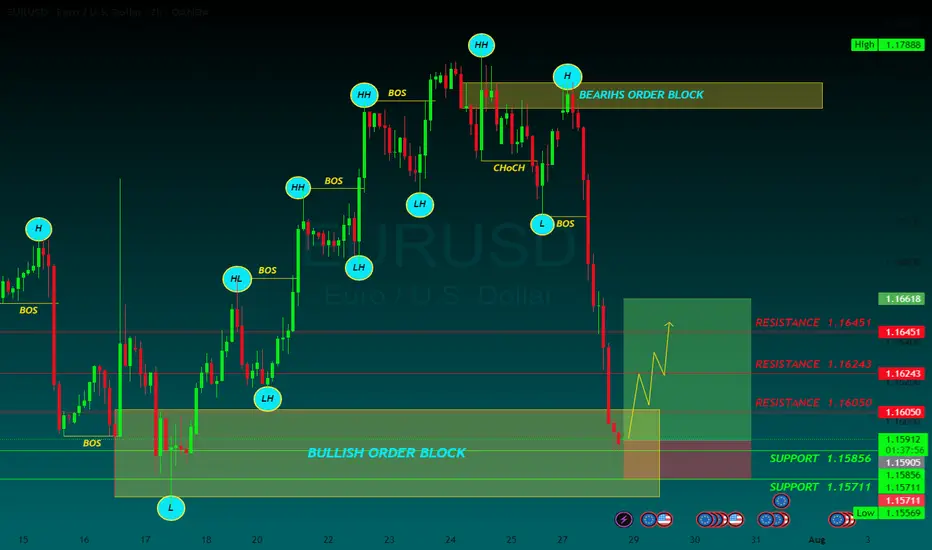
EURUSD BUYThe US Dollar (USD) gapped lower at the weekly opening amid optimism fueling demand for high-yielding assets, following news that the United States (US) and the European Union (EU) reached a trade deal.
The US and the EU agreed a 15% tariff on most European goods entering the US, much higher than the average 4.8% exporters face these days. No rates will apply to EU exports in important sectors, including aircraft parts, some chemicals, semiconductor equipment and some agricultural products.
The EU response to the headline was uneven. European Central Bank (ECB) policymaker Peter Kazimir said on Monday that the trade deal reduces uncertainty, but it is unclear for now how it impacts inflation. However, the French prime minister, François Bayrou, said the EU has capitulated to Donald Trump’s threats, adding it is a “dark day” for the EU. The trade focus now shifts to the US-China as officials from both countries resume talks in Stockholm.
The EUR/USD pair peaked at 1.1771 during Asian trading hours, but changed course early in Europe, with the USD surging across the FX board, resulting in the pair shedding over 100 pips.
The macroeconomic calendar had nothing relevant to offer at the beginning of the week, but will be flooded with first-tier releases, including US employment-related data ahead of the Nonfarm Payrolls report on Friday, the preliminary estimates of the Q2 Gross Domestic Product (GDP) for the US and the EU, and inflation updates. On top of that, the Federal Reserve (Fed) will announce its decision on monetary policy on Wednesday.
RESISTANCE 1.16050
RESISTANCE 1.16243
RESISTANCE 1.16451
SUPPORT 1.15856
SUPPORT 1.15711
Potentially, A Safer Way To Long The EURUSDIn contrast to my previous outlook, the current price action suggests an increased probability of a deeper bearish move—potentially invalidating the buy zone marked out in the previous analysis. This sudden change is largely driven by the prospect of untapped liquidity residing beneath that zone, reinforcing the well-known market principle that price seeks out liquidity before committing to directional moves.
Given this development, the newly identified zone on the chart emerges as a more technically sound and reliable area from which to anticipate bullish interest. It aligns better with the broader liquidity profile and offers a stronger base for accumulation. Traders may opt to wait for confirmations within this zone or, depending on their risk appetite, consider executing buy positions upon price entry.
As always, patience and clarity are key as we allow price to reveal its intention.
Fingers crossed 🤞
Wishing you all a focused and profitable trading week.
Catch you on the next one. 🫡

EURUSD BUY IDEAMe currently on Bull Retracement bias for EURUSD based on candlestick confirmation and divergecne on RSI and Awesome Oscilator, trade your plan ,

EURUSD - Break of support?In this moment we have a potential distribution of volume with a potential break of dinamic support we can have a deep rebound until area 1.14

Eurousd techinical analysis.Eurousd techinical analysis next move posibale at h1 time frame.not finchinal advice.

EURUSD: A Bearish Continuation?From my previous analysis, we anticipated a short-term decline on the EURUSD for a Daily bearish pullback. Price respected our zone and made a even stronger sweep before plummeting as forecasted.
Currently, price has returned to mitigate that liquidity sweep. Given the prior impulsive bearish move—which this current bullish correction stems from—we expect another drop, targeting the weak structure below for a potential liquidity grab or continuation.
We'll continue to monitor how price behaves around the current levels, but unless there's a significant shift in momentum, our bearish outlook remains valid. ✅
Follow us for more updates. 🔔
See you on the next one. 🫡

More upside for EUHi traders,
Last week EU went higher for the start of the next (impulsive or corrective) wave up as expected.
Next week we could see price go higher to finish (red) wave 5 but price is slowing down.
So the next big impulsive wave down is coming soon.
Let's see what the market does and react.
Trade idea: Wait for the finish of a correction down and a change in orderflow to bullish on a lower time frame to trade longs.
NOTE: the next three weeks I'm on holiday and I will not post any outlook during this period publicly.
If you want to learn more about trading with FVG's, liquidity sweeps and Wave analysis, then make sure to follow me.
This shared post is only my point of view on what could be the next move in this pair based on my technical analysis.
Don't be emotional, just trade your plan!
Eduwave

EURUSDEURUSD needs one more up after correction to break last week's high.
Disclosure: We are part of Trade Nation's Influencer program and receive a monthly fee for using their TradingView charts in our analysis.

EUR/USD – 1H Timeframe – Bearish Setup- Fibonacci levelsWe’re closely monitoring EUR/USD on the 1-hour chart.
🔻 Trend: Bearish
📉 Price action is clearly forming a series of Lower Highs (LH) and Lower Lows (LL) — a textbook downtrend.
🔎 Divergence: None observed, confirming trend strength.
📊 Current Action: Market is in a retracement phase.
We’ve used Fibonacci retracement, and price has now reached the 38.2% level, a key reversal zone. Based on this, we’ve entered a market sell position.
📌 Trade Setup:
🔹 Entry: Instant Sell @ 1.17302
🔹 Stop Loss: 1.17633
🔹 Take Profit 1: 1.17025
🔹 Take Profit 2: 1.16754
🔹 Risk/Reward: 1:1 and 1:2
🔹 Lot Size: 0.38
🔹 Risk: $200
🔹 Reward: $200 (TP1), $400 (TP2)
⚠️ Bias: Bearish
📍 This trade setup follows strict risk management principles and is based on solid technical confluence.
📈 Let’s see how the price reacts at the key Fib level. Always trade responsibly.
#EURUSD #ForexTrading #BearishSetup #FibonacciTrading #RiskManagement #PriceAction #TradingViewIdeas

EURUSD Challenging Trend + Liquidity ZoneEURUSD appears to be challenging the lower bound of this upward trend through a pretty major liquidity zone. If it survives, looking for entry after initial retest (confirmation on the 4h ideally) up to the upper bound of the trend channel.

EUR USD longlong-term trend is bullish yet we may have a correction or a change in trend but always trade the trends the chance of reversal is always lower then the chance of continuation ...
Please note: This is for educational purposes only and not a trading signal. These ideas are shared purely for back testing and to exchange views. The goal is to inspire ideas and encourage discussion. If you notice anything wrong, feel free to share your thoughts. In the end, to learn is to share !

EURUSDHello traders,
I've been closely monitoring the **EURUSD** pair for a while, and it’s now offering an ideal entry opportunity. It has presented several great setups for swing trading, and I’d like to share one of them with you today.
🔍 **Trade Details**
✔️ **Timeframe**: H4/D
✔️ **Risk-to-Reward Ratio**: 1:4.22
✔️ **Trade Direction**: Buy
✔️ **Entry Price**: 1.17281
✔️ **Take Profit**: 1.18997
✔️ **Stop Loss**: 1.16874
🔔 **Disclaimer**: This is not financial advice. I’m simply sharing a trade I’ve taken based on my personal trading system, strictly for educational and illustrative purposes.
📌 Interested in a systematic, data-driven trading approach?
💡 Follow the page and turn on notifications to stay updated on future trade setups and advanced market insights.

EURUSD(20250723) Today's AnalysisMarket news:
White House officials plan to visit the Federal Reserve headquarters on Thursday local time.
Technical analysis:
Today's buying and selling boundaries:
1.1730
Support and resistance levels:
1.1811
1.1781
1.1761
1.1699
1.1679
1.1649
Trading strategy:
If the price breaks through 1.1761, consider buying, the first target price is 1.1781
If the price breaks through 1.1730, consider selling, the first target price is 1.1699

Just looking for a big target, probably we will see big buyersTrends and legs are going to see high prices in most timeframes

EUR/USD || Correction || 1hr
💼 EUR/USD –🔻 Market Move
Timeframe: 30M | Broker: CMC | Brand: GreenFireForex™
Chart Type: Clean. Tactical. Smart Money meets Waves.
---
🔻 Correction Almost Done (Wave 5)
Classic Elliott 5-wave drop inside a bullish falling wedge.
The boys might be setting up a liquidity sweep before lift-off.
📉 Current Range: Grinding between 1.17334 – 1.17153
🕳️ Liquidity Below:
🩷 1.17158 (Mid OB)
🩶 1.17057 (Deep OB)
💜 1.16904 (Max Draw, SL sweep zone)
---
🚀 Upside Projections
🎯 TP1: 1.17253 (Quick scalp)
🧠 TP2: 1.17819 (Institutional Magnet)
---
🔫 Setup Mood:
🎯 Buy the Dip, don’t chase the breakout.
🧊 Let retail short the wedge, we buy into their fear.
🏎️ Risk-managed, sniper mode.
---
👑
"Liquidity funds lifestyle. Waves fund legacy."
---

EUR/USD: Is the Next Big Correction Already Underway?EUR/USD: After 120 Days Up, Are We Entering a Year-Long Correction? What Market Cycles Reveal.
As EUR/USD traders digest the stunning 120-day, five-wave rally from the January 2025 lows to the July 2025 highs, the big question now is—what's next? The clues are right in front of us, and they suggest we may be headed into an extended corrective phase, one that could last until the very start of 2026.
What the Current Structure Shows
Motive Wave Complete: The impulsive surge just wrapped up a textbook five-wave move, with each leg unfolding cleanly and culminating in a July top. Motive waves like this are the engines of market trends—fast-moving, decisive, and packed with momentum.
Corrective Phase Incoming: But all trends eventually pause, and here the evidence points to a shift. Corrective waves—unlike their trending counterparts—are time-consuming, choppy, and have a tendency to frustrate impatient traders. The completed motive wave took just 120 days, but corrections often take much longer to play out. According to this chart, the probable timeline for this correction extends into December 2025, or possibly beyond.
Why the Count Is Labelled This Way
Wave Duration Clue: One of the most reliable Elliott Wave principles is that corrective phases outlast the sharp, high-energy motive moves that precede them. With the motive wave spanning four months, a comparable correction stretching into late 2025 makes perfect structural sense.
Cycle Awareness, Major Turning Points, and MACD Divergence:
Flip to the weekly turning points chart, and a deeper pattern emerges: Major EUR/USD direction changes consistently cluster around the start of a new year, with minor tops and bottoms often forming near mid-year. Over the last eight years, six out of seven major pivots have landed at those cycle pivots.
Notably, if you look at the weekly chart’s MACD, there’s now a clear bearish divergence—while price clocked new highs into July, the MACD failed to confirm, rolling over and diverging lower. This kind of momentum divergence at a major turning point is classic for trend exhaustion and aligns perfectly with the idea that a correction is not only likely, but perhaps overdue.
This powerful confluence—timing, price structure, and momentum—underscores just how much “cycle” and structure awareness can add to your trading playbook.
What to Watch Next (Trade Planning)
Timing the Correction: If the correction follows historical precedent, expect sideways or choppy price action well into Q4 2025, with the next big directional opportunity around the calendar turn into 2026.
Cycle-Based Strategies: Recognising these cycles lets you prepare for reversals, especially if price is diverging from the MACD at those major timing windows.
Structure > Prediction: The motive phase is where you ride the trend; cycles, structure, and momentum help you avoid exhaustion traps and see when patience is required.

EURUSD Analysis : Rejection at Demand – Institutional Buy Setup🔍 Technical Storyline – What the Chart Tells Us:
🔸 1. Previous Bearish Structure – Descending Channel:
Price has been moving within a well-respected bearish channel, signifying structured sell-side liquidity control.
This channel served as a trap zone, where retail sellers were induced while institutions accumulated buy-side positions below the range.
The controlled movement inside the channel ended with a breakout to the upside, signaling a disruption in bearish control.
🔸 2. QFL Zone Formation – Manipulation & Liquidity Grab:
QFL (Quasimodo Failure Level) is evident in two phases here:
The first QFL acts as a reaction point where the market dropped to test demand and rallied aggressively.
The second QFL near the highs shows price swept previous liquidity before dumping, hinting at institutional profit-taking and possible redistribution into discount areas.
🔸 3. Central Reversal Zone (CRZ):
Price reversed sharply from this CRZ, which acted as a major supply level. The CRZ marks the top of the manipulation range.
This was a liquidity sweep targeting trapped long positions that entered too late at the highs.
🔸 4. Demand Revisit + Positive Rejection Pattern (Current Phase):
Price has now reached the MMC-validated demand zone, which previously launched a strong bullish move.
The long lower wick in the latest candle shows buyer absorption, suggesting early signs of a Positive Reversal Pattern.
This area is marked with high probability for bullish continuation, as it aligns with both technical support and smart money logic.
💡 Trading Plan & Market Mindset:
🔸 📈 Bullish Scenario (High-Probability Play):
Wait for bullish confirmation, such as:
Bullish engulfing on 1H/4H
Break of minor intraday structure (e.g., break of internal LH)
Strong volume surge from the zone
Entry zone: Within the demand block – 1.15500 to 1.15750
Stop-loss: Just below the demand zone (1.15250)
Target 1 (TP1): 1.16500 – minor intraday resistance
Target 2 (TP2): 1.17500–1.18000 – retest of QFL high and Central Reversal Zone
🔸 ❌ Bearish Invalidator:
A 4H candle close below 1.15250 would break the demand zone structure.
Invalidation of MMC reversal – move toward deeper liquidity (1.14500–1.14800)
🧠 Trader’s Psychology & Institutional Mindset:
Institutions often induce price spikes to trap both buyers and sellers.
This entire structure reflects classic accumulation → manipulation → distribution → reaccumulation.
The retest of the original demand zone allows institutions to re-enter at discount before pushing price back toward the highs.
“In MMC, patterns are not just shapes – they are footprints of institutional intent.”

Eurousd techinical analysis.Eurousd techinical analysis next move posibale at h2 time frame.not finchinal advice.

LONG TRADE PLAN (RENKO STRUCTURE)
🧱 LONG TRADE PLAN (RENKO STRUCTURE)
🔹 Entry: 1.1740
🔹 SL: 1.1690 (50 pip risk)
🔹 Style: 100-pip Renko Target Ladder
🔹 Bias: Macro uptrend forming — targeting Fib 100 and above
⸻
🎯 TARGET LADDER + STRATEGIC WHY
TP1 — 1.1800 📈
〰️ Brick 18 confirm — breakout ignition point
+60 pips | R:R 1.2:1
TP2 — 1.1900 💰
〰️ Mid-run exit — early profit-taker zone
+160 pips | R:R 3.2:1
TP3 — 1.2000 🧲
〰️ Full Fib 100 — magnet + reversal hotspot
+260 pips | R:R 5.2:1
TP4 — 1.2100 🚀
〰️ Post-Fib breakout — trap zone for late shorts
+360 pips | R:R 7.2:1
TP5 — 1.2200 🔄
〰️ Minor stall zone — profit lock-in level
+460 pips | R:R 9.2:1
TP6 — 1.2300 🔥
〰️ Thin continuation — extension in motion
+560 pips | R:R 11.2:1
TP7 — 1.2400 ⚠️
〰️ Trend exhaustion zone — monitor Renko structure
+660 pips | R:R 13.2:1
TP8 — 1.2500 🧠
〰️ Round number + gamma cluster — exit partials
+760 pips | R:R 15.2:1
TP9 — 1.2600 🪤
〰️ Liquidity sweep — trap and fade zone
+860 pips | R:R 17.2:1
TP10 — 1.2700 🏁
〰️ Full cycle climax — final high probability exit
+960 pips | R:R 19.2:1
⸻
🧠 Plan:
• Go 50% at 1.1740, scale 50% after 1.1800 confirm
• SL to BE after TP2
• Trail by 1 Renko brick after TP3
• Exit final ladder by TP8–TP10 unless macro reasserts
🔐 Invalidation: Close below 1.1700 = full reset

Important week for EURUSDOn Friday, EURUSD reached a support level and bounced off it.
This week, all eyes are on the Fed's interest rate decision on Wednesday and the U.S. jobs data on Friday.
The trend remains bullish for now, and the upcoming news will likely determine the next move.
Today and tomorrow, the market may stay in a range as traders wait for the key events.
Don't rush into new trades and avoid using large position sizes!
