EURUSD Sell SetupHello traders!
Price has strong bearish momentum and is expected to move lower.
We're selling here with the target around the higher timeframe demand zone.
Manage your risk and trade safe!
USDEUR trade ideas

EUR/USD BULLISH BIAS RIGHT NOW| LONG
Hello, Friends!
EUR/USD pair is in the uptrend because previous week’s candle is green, while the price is obviously falling on the 1D timeframe. And after the retest of the support line below I believe we will see a move up towards the target above at 1.179 because the pair is oversold due to its proximity to the lower BB band and a bullish correction is likely.
Disclosure: I am part of Trade Nation's Influencer program and receive a monthly fee for using their TradingView charts in my analysis.
✅LIKE AND COMMENT MY IDEAS✅

EUR/USD ADDED TO THE WATCHLISTPrice has fallen dramatically so we are on watch for a possible reversal (maybe short term) pattern to appear. Momentum is very low and looks prime to go up. We will need a hammer candle, with an engulfing confirmation candle, strong volume and in a best case scenario strong support to come off of. We will keep watching this one.

EURUSDUS reaching trade deal with other countries and this and given to the index rally. We are taking an opportunity in the retracement

EURUSD LOSSES BULLISH MOMENTUM. WHERE TO GO?EURUSD LOSSES BULLISH MOMENTUM. WHERE TO GO?
The asset didn't reach the local resistance of 1.18300 and started to consolidate before reaching this level. RSI shows weakness of the impulse on 4-h chart, as well as MACD is in the red zone. Therefore, we expect the price to slowly decline towards local trendline, where SMA200 is situated.

EURUSD Did Not Like the EU–US DealThe heavily one-sided EU–US deal has put negative pressure on EURUSD. Ahead of a crucial week filled with major events, including GDP data from both the Eurozone and the US, the PCE report, payrolls, and meetings from the FOMC and BOJ, EURUSD has broken a short-term head and shoulders formation. The pattern's target is near 1.1610.
A retest of the broken support is possible and could even extend to 1.1725. However, unless sentiment changes due to some news, this move may offer only a selling opportunity. The downward trend could also continue without pause.
Options market activity suggests that the 1.16 to 1.18 range is viewed as a "safe zone," with large players likely aiming to keep EURUSD within this band for the week. If the head and shoulders target is reached, EURUSD might stabilize and bounce around the 1.16 level.

EURUSD EURUSD is on an exhaustion trend after a long buy, taking a sell correctional move. The market objective yet to be fulfilled, we continue the sells the the objective is fulfilled. Having a valid sell structure that lead to a break of structure, having a structural liquidity making the low a protected low. Looking to take a sell from the supply zone(strong low) and target the weak high

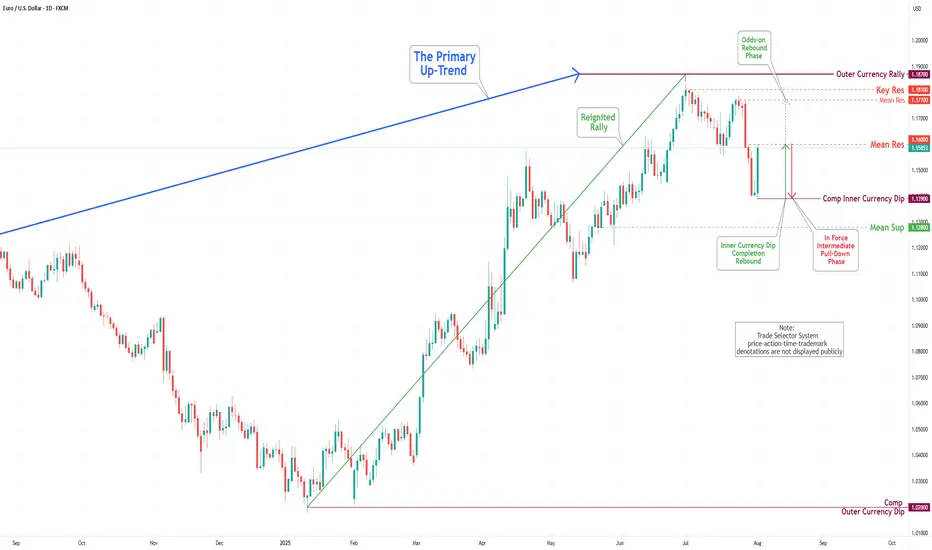
EUR/USD Daily Chart Analysis For Week of July 25, 2025Technical Analysis and Outlook:
During the previous week's trading session, the Euro experienced an increase following the completion of the Inner Currency Dip at the 1.156 level. It subsequently surpassed two significant Mean Resistance levels, namely 1.167 and 1.172; however, it reversed direction by the conclusion of the trading week. Recent analyses indicate that the Euro is likely to undergo a sustained downward trend, with a projected target set at the Mean Support level of 1.169 and a potential further decline to retest the previously completed Currency Dip at 1.156. Nonetheless, it remains essential to consider the possibility of renewed upward momentum towards the Mean Resistance level of 1.177, which could initiate a preeminent rebound and facilitate the completion of the critical Outer Currency Rally at 1.187.

HTF EURUSD PA REVIEWFeel free to provide any feedback.
It is important to note the dynamics between bearish and bullish range-initiation-mitigation-continuation.
Where one phase might be the initiation leg out of a bearish range, it can also be the point of mitigation of a previous bullish range.

EURUSDEUR/USD is the most traded currency pair in the world, representing the exchange rate between the euro (EUR) and the US dollar (USD). It reflects how many US dollars are required to purchase one euro. Introduced in 1999 with the launch of the euro, this pair has become a global benchmark due to the economic size and influence of both the Eurozone and the United States. It is highly liquid and closely watched by traders, investors, and policymakers, with its value shaped by monetary policy, interest rate differentials, macroeconomic indicators, and geopolitical developments.
Historically, EUR/USD has seen major swings. In the early 2000s, the pair fell to around 0.82 before rallying to a peak above 1.60 in 2008 during a period of dollar weakness. It then declined sharply during the European debt crisis. In 2022, amid aggressive interest rate hikes by the US Federal Reserve and rising global uncertainty, the pair briefly fell below parity, trading under 1.00 for the first time in nearly two decades. However, as inflation in the US began to ease and expectations of rate cuts grew, the euro gradually strengthened through 2023 and 2024.
As of August 2025, EUR/USD is trading around 1.15800. This reflects a moderate recovery of the euro from its lows, supported by a more stable Eurozone economy and a softer US dollar. The pair remains sensitive to central bank signals, particularly from the European Central Bank and the Federal Reserve, and is likely to continue reacting to shifts in monetary policy, inflation data, and global risk sentiment. EUR/USD remains a cornerstone of the forex market, widely used by traders for both short-term strategies and long-term positioning.

EUR/USD Reversal or Trap? 4H Clean Breakdown InsidePrice just tapped into a high-probability sell zone after a corrective Wave 2 structure. With sellers already active at 1.16342 and 1.17635, this setup is not just textbook—but a potential goldmine for swing traders.
🔻 Is this Wave 3 continuation about to begin?
🔍 Liquidity swept. Zones respected. Structure still bearish.
⚠️ Many traders will miss the bigger picture here—will you?
👇 Drop your thoughts:
Are we about to break 1.13000?
Do you agree with the Elliott Wave count?
What’s your bias on DXY?
💬 I personally reply to every comment—let’s build this chart together.
🔥 If you caught the entry, show your entry point and reasoning—let’s level up as a team.

EUR/USD Daily Chart Analysis For Week of August 1, 2025Technical Analysis and Outlook:
In this week's trading session, the Euro experienced a significant drop, reaching the 1.139 level, and completing what is referred to as the Inner Currency Dip. As a result of the completion, the currency reversed direction and made a strong rebound, hitting the Mean Resistance level at 1.160. Recent analyses suggest that the Euro is likely to enter a sustained downward move after retesting the Mean Resistance at 1.160, with the target set to revisit the completed Inner Currency Dip at 1.139. However, it is essential to consider the possibility of continued upward momentum towards the Mean Resistance level of 1.177. Such a movement could trigger a significant rebound and lead to the completion of the Outer Currency Rally at 1.187.
eurusd buy short termafter yesterday's drop of the euro, today and tomorrow should make a small correction of 100 pips, extending to 150 pips, until the value of 1.1550

Short idea!Hey all. as you see market returned from middle of no-where and the response will be right at the LOZ. it is sort of risky because the LOZ candle covered by the next candle. It makes the Zone less efficient but it is still powerful. be happy (wink)

EU possible buy idea?7 days ago, I shared a bullish idea that remains valid despite price failing to hold above 1.04321.
Current Market Analysis:
Price appears to be forming an Elliot Wave 2 (a-b-c) correction.
Key Levels to Watch:
- 38.2% Fibonacci retracement level (minimum required for Wave 2)
- 88.7% Fibonacci retracement level (maximum allowed for Wave 2 to maintain bullish bias)
Trade Plan:
With my initial position at break-even, I'll employ dollar-cost averaging for additional buys targeting 1.065 :
1. 50% Fibonacci retracement level
2. 61.8% Fibonacci retracement level
3. 78.6% Fibonacci retracement level
Stop Loss: 1.017
This is not a financial advice but if you must take the trade, apply proper risk and money management while scaling into the trade.

Euro is pumping up Officially the market is targeting the buy side liquidity on the 1.8 , next week we will see if the market confirm the up trend in lower time frame

Eurousd techinical analysis.Eurousd techinical analysis next move posibale at h1 time frame not finchinal advice.

eur usdI drew the support and resistance on the daily time frame. It broke the resistance and had a pullback, but the last uptrend left a lot of liquidity and it is not a clean and high-quality uptrend that has an order block.

EURUSD 60/15 Pullback LongOverall strong up trend. Now under consolidate phase, then pullback, looking for long.
Possible buy zones are marked, monitor when reaching buy zones.

EURUSD – Bulls Still in Control, Trend ResumesIn my previous EURUSD analysis, I pointed out that the pair was nearing an important confluence support around 1.1620, and that – given the overall bullish trend – this zone could offer solid long opportunities.
What followed?
The market briefly dipped below that zone, even challenging the psychological 1.1600 round number. But instead of breaking down, bulls regrouped, stepped in with force, and pushed the pair aggressively higher.
📍 At the time of writing, EURUSD is trading at 1.1770, and my long trade is running with a comfortable 150 pips profit.
🔍 W hat’s Next?
The current structure suggests a continuation of the uptrend, and the logical technical target is the recent high at 1.1830.
Until proven otherwise, this is still a buy-the-dip market.
✅ Buying around 1.1700 could be a valid setup, especially if we see buying power on the intraday chart
⚠️ The Warning Sign
Despite the bullish bias, keep in mind:
If EURUSD drops and closes below 1.1670, the structure begins to shift — and this could signal a deeper correction or even trend reversal.
📌 Until then, the bias remains bullish, dips are to be watched for entries, and 1.1830 is the next checkpoint.
D isclosure: I am part of TradeNation's Influencer program and receive a monthly fee for using their TradingView charts in my analyses and educational articles.

Trading balanceTrading balance The price of the asset has rebounded from the balance zone. With the prospect of growth into the resistance zone.

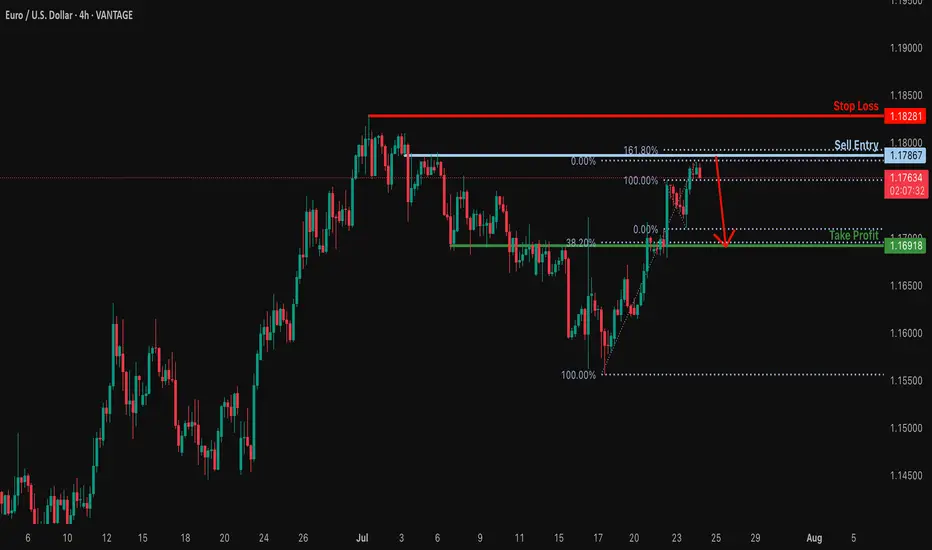
Bearish reversal off 161.8% Fibonacci resistance?EUR/USD is rising towards the resistance level which is a pullback resitance that lines up with the 161.8% Fibonacci rretracement and could drop from this level to our take profit.
Entry: 1.1786
Why we like it:
There is a pullback resistance level that lines up with the 161.8% Fibonacci extension.
Stop loss: 1.1828
Why we like it:
There is a swing high resistance.
Take profit: 1.1691
Why we like it:
There is an overlap support that aligns with the 38.2% Fibonacci retracement.
Enjoying your TradingView experience? Review us!
Please be advised that the information presented on TradingView is provided to Vantage (‘Vantage Global Limited’, ‘we’) by a third-party provider (‘Everest Fortune Group’). Please be reminded that you are solely responsible for the trading decisions on your account. There is a very high degree of risk involved in trading. Any information and/or content is intended entirely for research, educational and informational purposes only and does not constitute investment or consultation advice or investment strategy. The information is not tailored to the investment needs of any specific person and therefore does not involve a consideration of any of the investment objectives, financial situation or needs of any viewer that may receive it. Kindly also note that past performance is not a reliable indicator of future results. Actual results may differ materially from those anticipated in forward-looking or past performance statements. We assume no liability as to the accuracy or completeness of any of the information and/or content provided herein and the Company cannot be held responsible for any omission, mistake nor for any loss or damage including without limitation to any loss of profit which may arise from reliance on any information supplied by Everest Fortune Group.
Bullish momentum to extend?The Fiber (EUR/USD) is reacting off the pivot and could rise to the 127.2% Fibonacci resistance.
Pivot: 1.1746
1st Support: 1.1659
1st Resistance: 1.1907
Risk Warning:
Trading Forex and CFDs carries a high level of risk to your capital and you should only trade with money you can afford to lose. Trading Forex and CFDs may not be suitable for all investors, so please ensure that you fully understand the risks involved and seek independent advice if necessary.
Disclaimer:
The above opinions given constitute general market commentary, and do not constitute the opinion or advice of IC Markets or any form of personal or investment advice.
Any opinions, news, research, analyses, prices, other information, or links to third-party sites contained on this website are provided on an "as-is" basis, are intended only to be informative, is not an advice nor a recommendation, nor research, or a record of our trading prices, or an offer of, or solicitation for a transaction in any financial instrument and thus should not be treated as such. The information provided does not involve any specific investment objectives, financial situation and needs of any specific person who may receive it. Please be aware, that past performance is not a reliable indicator of future performance and/or results. Past Performance or Forward-looking scenarios based upon the reasonable beliefs of the third-party provider are not a guarantee of future performance. Actual results may differ materially from those anticipated in forward-looking or past performance statements. IC Markets makes no representation or warranty and assumes no liability as to the accuracy or completeness of the information provided, nor any loss arising from any investment based on a recommendation, forecast or any information supplied by any third-party.
