Possible scenario for EUR/USD based on Weekly-Daily-4h technicalPossible scenario for EUR/USD based on Weekly-Daily-4h technical and fundamental analyses.
USDEUR trade ideas

EURUSD Weekly Technical Analysis – Major Downtrend Line in Focus📈 EURUSD Weekly Technical Analysis – Major Downtrend Line in Focus
As seen on the chart, EURUSD is currently approaching a long-term descending trendline on the weekly timeframe. This trendline has historically acted as a strong supply zone, so it’s crucial to have it drawn on your chart.
🔸 If price manages to break above the resistance at 1.17545, we could see a bullish continuation toward the next targets at 1.17900, 1.18545, and potentially 1.19000.
🔻 However, if price gets rejected around the resistance zone (1.17500–1.17800), key supports to watch are 1.16960, 1.16500, and the major support at 1.14900.
⏳ A move toward the downtrend line is highly likely, but it may take time. Stay patient and monitor these key zones closely.
💬 Follow for more real-time analysis and updates!

EURUSD: Strong Growth Ahead! Long!
My dear friends,
Today we will analyse GOLD together☺️
The market is at an inflection zone and price has now reached an area around 1.17463 where previous reversals or breakouts have occurred.And a price reaction that we are seeing on multiple timeframes here could signal the next move up so we can enter on confirmation, and target the next key level of 1.17589.Stop-loss is recommended beyond the inflection zone.
❤️Sending you lots of Love and Hugs❤️

EURUSD Will Move Higher! Long!
Here is our detailed technical review for EURUSD.
Time Frame: 9h
Current Trend: Bullish
Sentiment: Oversold (based on 7-period RSI)
Forecast: Bullish
The market is testing a major horizontal structure 1.174.
Taking into consideration the structure & trend analysis, I believe that the market will reach 1.184 level soon.
P.S
Overbought describes a period of time where there has been a significant and consistent upward move in price over a period of time without much pullback.
Disclosure: I am part of Trade Nation's Influencer program and receive a monthly fee for using their TradingView charts in my analysis.
Like and subscribe and comment my ideas if you enjoy them!

EURUSD: Mid-Term Analysis💶 EURUSD Analysis
The blue boxes under liquidity look good.
📍 The Plan
If price moves into these blue boxes:
✅ Watch for footprint absorption (buyers stepping in)
✅ Look for CDV support or bullish divergence
✅ Wait for a structure reclaim to confirm entry
⚡ Why This Matters
No chasing. No guessing.
These zones are where I’m interested if the market wants to give an opportunity.
🎯 Action Point
If signals align, I will consider a risk-managed long.
If not, I am fine waiting.
Patience and clarity. The right price, or no trade.


EURUSD : Not yetBut I think it will be coming soon.
The battle between buyer and seller has been ongoing for more than 30 hours now.
If I SELL too soon (without confirmation), then it is risky, as we have seen that the price still creeps upwards. Wait for Buyer exhaustion.
We will know the winner soon. I will definitely let you know when it happens. Let's make $$$$$
Good luck.

EURUSD Long, 29 JulyReversal Setup from Daily OB + LTF Confluence
Price tapped into a Daily Bullish OB with 50EMA support, signaling potential for a bullish reaction. While structure isn’t perfect, the overextension and DXY correlation offer strong intraday confluence.
📈 HTF Confluence:
✅ Sitting inside a Daily Bullish Orderblock
📍 50EMA in the same area → added support
🟢 Expecting a bounce from this zone, even if HTF trend isn’t clearly bullish yet
📉 LTF Context:
💤 Asia range formed, still unfilled → clean liquidity target
📉 Overextended bearish move into 15m POI
🪞 DXY at its own 15m POI + Asia range to complete → supports EU upside
🎯 Entry Plan:
✅ Clear 1m BOS after reacting from 15m Decisional OB
🎯 Entry taken at 5m OB inside that 15m POI zone
⚠️ Decisional OB isn’t ideal, but stacked confluences justify the risk
🛡 SL: Below 5m OB
📌 TP: Asia high + potential continuation if DXY breaks lower

EUR/USD Potential Bearish MoveHi Traders.
1. HTF Expanding Structure
2. HnS Pattern
3. LTF Bearish Impulse
4. Breakout from Structure
Wait for LTF Correction and Breakout to confirm this setup

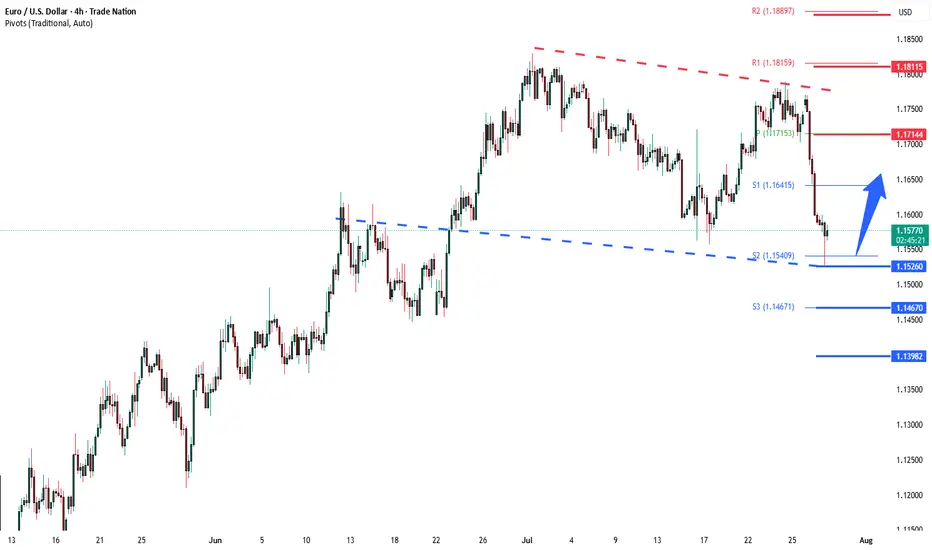
EURUSD corrective pullback support at 1.1526The EURUSD remains in a bullish trend, with recent price action showing signs of a corrective pullback within the broader uptrend.
Support Zone: 1.1526 – a key level from previous consolidation. Price is currently testing or approaching this level.
A bullish rebound from 1.1526 would confirm ongoing upside momentum, with potential targets at:
1.1714 – initial resistance
1.1810 – psychological and structural level
1.1885 – extended resistance on the longer-term chart
Bearish Scenario:
A confirmed break and daily close below 1.1526 would weaken the bullish outlook and suggest deeper downside risk toward:
1.1470 – minor support
1.1400 – stronger support and potential demand zone
Outlook:
Bullish bias remains intact while the EURUSD holds above 1.1526. A sustained break below this level could shift momentum to the downside in the short term.
This communication is for informational purposes only and should not be viewed as any form of recommendation as to a particular course of action or as investment advice. It is not intended as an offer or solicitation for the purchase or sale of any financial instrument or as an official confirmation of any transaction. Opinions, estimates and assumptions expressed herein are made as of the date of this communication and are subject to change without notice. This communication has been prepared based upon information, including market prices, data and other information, believed to be reliable; however, Trade Nation does not warrant its completeness or accuracy. All market prices and market data contained in or attached to this communication are indicative and subject to change without notice.
EUR/USD – Potential Reversal Ahead?| Daily Timeframe | Outlook (Published July 29, 2025)
⚠️ Setup Summary:
This chart is highlighting a critical juncture for EUR/USD, where price is nearing a major decision zone. Based on price action and wave structure, there are two likely scenarios unfolding. Let’s break it down simple .
EUR/USD has seen a strong bullish rally from March to July, but current price action suggests momentum exhaustion. Now, we’re watching for signs of a reversal or deeper correction in the coming weeks.
📊 Two Probable Scenarios:
✅ Case 1 – Simple Corrective Wave (ABC Pattern)
Expected Move:
Price may spike up into the 1.186–1.199 zone (final bull trap/liquidity grab)
Followed by a sharp bearish move (impulse C wave) towards 1.10505 zone
This reflects a clean correction before possible reaccumulation
📌 This is often seen after retail traders get caught chasing highs late in a move.
---
✅ Case 2 – Complex Corrective Wave (ABCDE Flat/Running Triangle)
Expected Move:
A longer, more sideways and choppy correction into Q1 2026
Price forms a distribution pattern under resistance
After a breakout below the structure, a sharp drop to 1.10505 zone (or deeper)
📌 This is a slower bleed-out pattern before continuation lower. Often traps both buyers and sellers in the chop.
---
🎯 Current Price: 1.15756
We are in a decision zone, and watching the reaction around 1.165–1.186 will be crucial to validate either Case 1 or Case 2.
---
💡 My View:
> Wait for confirmation at the 1.186 zone.
If price rejects strongly from there, Case 1 is in play. 👈❤️
If price chops sideways and holds higher for weeks, expect Case 2 structure.
---
🚨 Reminder for Traders:
Don’t chase moves — let the market show its hand
Use proper risk management
Combine this structure with session timing, liquidity sweeps, and fundamental events
---
💬 Drop a comment if you're seeing similar setups in other majors!
🧠 Follow for real-time updates & actionable setups.
#EURUSD #ForexAnalysis #WaveTheory #SmartMoney #OrderBlock #LiquidityHunt #ForexStrategy #ElliottWave #PriceAction #FXTrader #TradingView
---

EURUSD breaks structure – Is this the start of a deeper fall?Hello everyone, what do you think about EURUSD?
From a technical perspective, after a steady uptrend that lasted from early June, EURUSD has officially broken out of its ascending channel – marking a significant turning point in the market trend. The formation of a lower high suggests weakening bullish momentum, and the break of the trendline confirms a clear shift in market structure.
Notably, the price has also fallen below both the EMA34 and EMA89 – a common signal indicating that bearish momentum is starting to dominate. The combination of these signals strengthens the view that selling pressure may continue to increase in the coming sessions.
Currently, price is hovering around a key support zone near 1.16000. While this may serve as temporary support, a breakdown below this area could open the path toward the next target at 1.14525 – which aligns with a previous major low.
What do you think? Share your opinion in the comments!

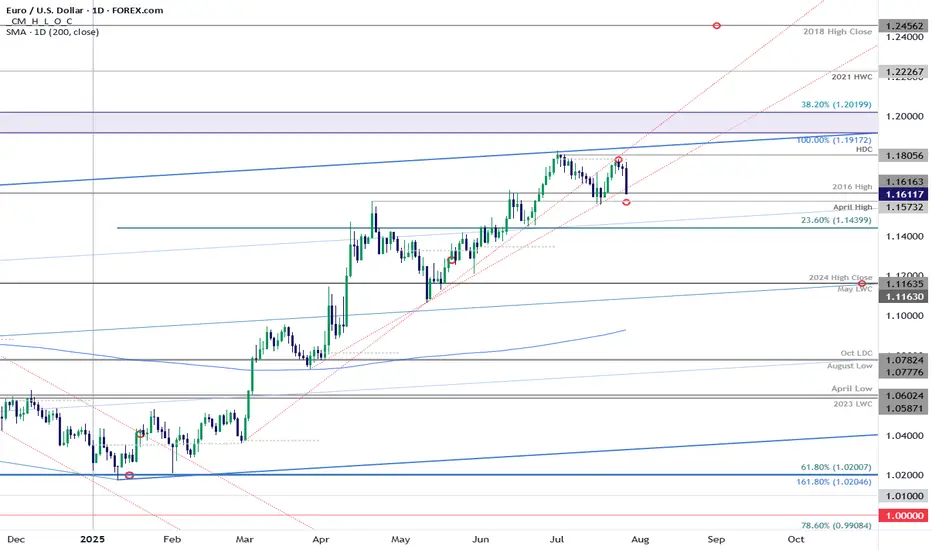
EUR/USD: Euro Poised for Monthly Range Breakout Ahead of FedEuro defended resistance at the monthly opening-range high / July open at 1.1787-1.1805 last week with price plunging back into support today at the late-February trendline / 2016 high at 1.1616.
Medium-term bullish invalidation rests with the April high at 1.1573 and a close below this level would suggest a more significant high is in place / a larger correction is underway. Stay nimble here into the monthly-cross and watch the weekly closes for guidance.
-MB
EU possible buy idea?7 days ago, I shared a bullish idea that remains valid despite price failing to hold above 1.04321.
Current Market Analysis:
Price appears to be forming an Elliot Wave 2 (a-b-c) correction.
Key Levels to Watch:
- 38.2% Fibonacci retracement level (minimum required for Wave 2)
- 88.7% Fibonacci retracement level (maximum allowed for Wave 2 to maintain bullish bias)
Trade Plan:
With my initial position at break-even, I'll employ dollar-cost averaging for additional buys targeting 1.065 :
1. 50% Fibonacci retracement level
2. 61.8% Fibonacci retracement level
3. 78.6% Fibonacci retracement level
Stop Loss: 1.017
This is not a financial advice but if you must take the trade, apply proper risk and money management while scaling into the trade.

eur usdI drew the support and resistance on the daily time frame. It broke the resistance and had a pullback, but the last uptrend left a lot of liquidity and it is not a clean and high-quality uptrend that has an order block.

EURUSD: Will Go Up! Long!
My dear friends,
Today we will analyse EURUSD together☺️
The price is near a wide key level
and the pair is approaching a significant decision level of 1.17201 Therefore, a strong bullish reaction here could determine the next move up.We will watch for a confirmation candle, and then target the next key level of 1.17348.Recommend Stop-loss is beyond the current level.
❤️Sending you lots of Love and Hugs❤️


EUR/USD LOSS❌ EUR/USD Loss – Part of the Process
We were in this trade for 4 days before price made a sharp move against us, taking out our stop.
No strategy wins every time—and this is one of those times.
But losses like this are easier to handle when you have a rules-based system like the VMS strategy behind you. It’s built to:
Filter only high-probability setups
Keep emotions out of decision-making
Win more than it loses over time
📌 This wasn’t a bad trade—it was a trade that didn’t work this time. Big difference.
We stay focused. We stay patient. And we keep showing up.

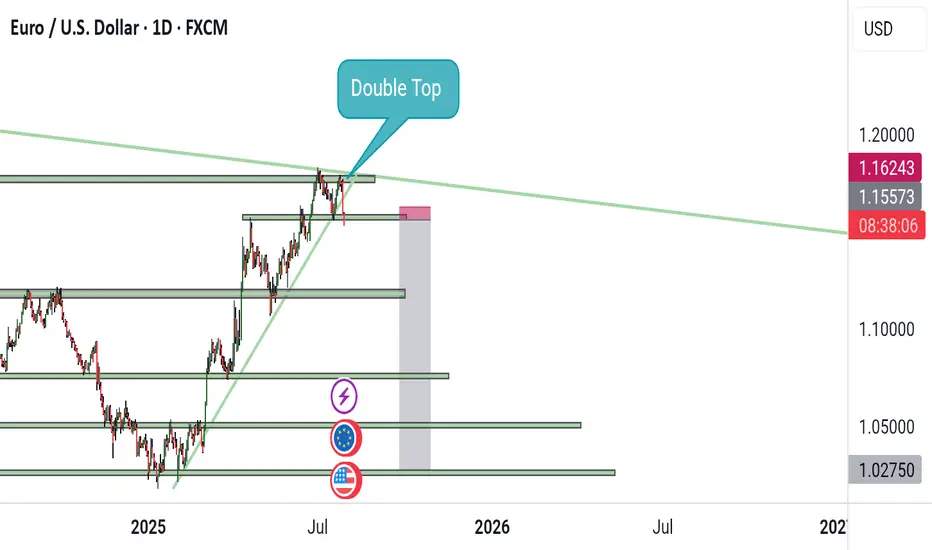
Eurusd is bearish Price was previously bullish, formed a double top on the Higher time frame. Wait for retest of the broken support zone and opt for a buy.
EURUSD Did Not Like the EU–US DealThe heavily one-sided EU–US deal has put negative pressure on EURUSD. Ahead of a crucial week filled with major events, including GDP data from both the Eurozone and the US, the PCE report, payrolls, and meetings from the FOMC and BOJ, EURUSD has broken a short-term head and shoulders formation. The pattern's target is near 1.1610.
A retest of the broken support is possible and could even extend to 1.1725. However, unless sentiment changes due to some news, this move may offer only a selling opportunity. The downward trend could also continue without pause.
Options market activity suggests that the 1.16 to 1.18 range is viewed as a "safe zone," with large players likely aiming to keep EURUSD within this band for the week. If the head and shoulders target is reached, EURUSD might stabilize and bounce around the 1.16 level.


Bullish momentum to extend?The Fiber (EUR/USD) is reacting off the pivot which is a pullback support that aligns with the 61.8% Fibonacci retracement and could bounce to the 1st resistance.
Pivot: 1.1584
1st Support: 1.1448
1st Resistance: 1.1809
Risk Warning:
Trading Forex and CFDs carries a high level of risk to your capital and you should only trade with money you can afford to lose. Trading Forex and CFDs may not be suitable for all investors, so please ensure that you fully understand the risks involved and seek independent advice if necessary.
Disclaimer:
The above opinions given constitute general market commentary, and do not constitute the opinion or advice of IC Markets or any form of personal or investment advice.
Any opinions, news, research, analyses, prices, other information, or links to third-party sites contained on this website are provided on an "as-is" basis, are intended only to be informative, is not an advice nor a recommendation, nor research, or a record of our trading prices, or an offer of, or solicitation for a transaction in any financial instrument and thus should not be treated as such. The information provided does not involve any specific investment objectives, financial situation and needs of any specific person who may receive it. Please be aware, that past performance is not a reliable indicator of future performance and/or results. Past Performance or Forward-looking scenarios based upon the reasonable beliefs of the third-party provider are not a guarantee of future performance. Actual results may differ materially from those anticipated in forward-looking or past performance statements. IC Markets makes no representation or warranty and assumes no liability as to the accuracy or completeness of the information provided, nor any loss arising from any investment based on a recommendation, forecast or any information supplied by any third-party.

Sell then Buy!Hello all. if market return right from here (IF IF IF IF), the response is the zone I have shown on the chart. I had no time to Optimize it. but enter with your confirmation method. I try to optimize it tonight (wink)
