EURUSD 4H - BUYOver all it's an uptrend, I believe price finish the correction by reach 61.8 Fib and price is showering Divergency in the daily Time farm, I expect price to continue with the uptrend.
USDEUR trade ideas

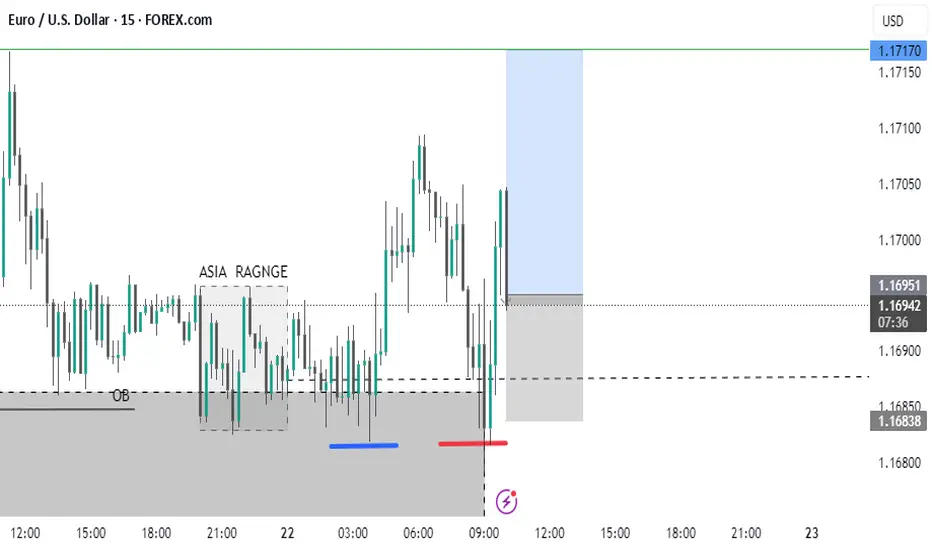
EURUSD LongEURUSD 15-Minute Technical Analysis
EURUSD has broken through a key intraday structure level with strong bullish momentum, indicating continued institutional interest on the buy side. The market is now approaching a higher-timeframe supply region while leaving behind a well-defined demand zone that could serve as a launchpad for further upside.
🔍 Market Structure & Momentum:
Break of Structure (BOS) was confirmed after the recent surge above the previous high, validating the current bullish trend.
Price has rallied aggressively from the IDM low at 1.16908, sweeping short-term liquidity and suggesting smart money involvement.
We are now trading inside a minor supply zone and approaching a broader liquidity cluster between 1.17550 – 1.17800.
🟩 Key Demand Zone
Level: 1.16980 – 1.17100
This zone marks a significant accumulation area where the market built up momentum before the breakout. It's also in line with the IDM (Internal Drawdown Marker), serving as a technical retracement level.
A retracement into this demand zone would align with a classic bullish continuation pattern, offering a potential re-entry area for long positions.
The imbalance left behind further supports this zone’s potential to hold.
🟥 Overhead Supply Zones (Resistance Clusters):
First Zone: 1.17550 – 1.17700
Second Zone (Stronger): 1.17750 – 1.17900
These zones represent unmitigated supply levels from previous sell-offs and may act as profit-taking or short-term reversal points for intraday traders. These areas are where we expect higher levels of volatility and potential bearish reaction before continuation or reversal.
📈 Expectations & Trade Setup:
Anticipation of a retracement into the 1.16980–1.17100 demand zone for price to establish a higher low before pushing toward unfilled liquidity above 1.17550.
If demand holds, a bullish continuation could aim for 1.17750–1.17900, where confluence with past supply suggests caution.
Should price fail to hold the demand, bearish momentum could pull price back toward the lower demand block at 1.16500 (aligned with the 0.5 fib level of the prior impulse).

EURUSD - BUY - Doesn't need any more confirmations..EURUSD - Bumping short term. Get your entries. Doesn't need any more confirmations..
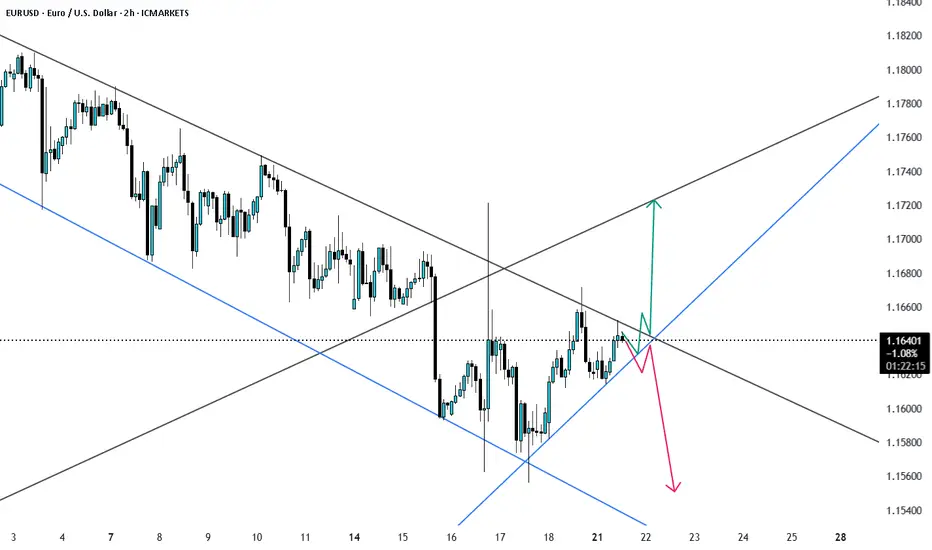
EURO - Price can continue to decline in falling channelHi guys, this is my overview for EURUSD, feel free to check it and write your feedback in comments👊
For a long time, the price was moving within a large ascending wedge, showing a gradual upward trend.
However, buyers failed to maintain momentum, and the price made a decisive breakout below the wedge's support line.
Following the breakout, the instrument established a new structure, a local falling channel, and has been trading within its boundaries since.
Currently, the price is in a corrective upward move, approaching the key resistance area of $1.1630 - $1.1660.
This zone is significant as it aligns with a previous support level and the upper boundary of the current falling channel.
I expect that the price will face rejection from this resistance area and will then continue its decline towards the channel's support line, targeting the $1.1465 level.
If this post is useful to you, you can support me with like/boost and advice in comments❤️
Disclaimer: As part of ThinkMarkets’ Influencer Program, I am sponsored to share and publish their charts in my analysis.

EURUSD Breaks Bullish Structure – Here’s My Trade Plan📍 Watching EURUSD closely—it's recently broken bullish (market structure) on the daily timeframe 📈.
I’m now waiting for a retrace into a fair value gap, watching for the rebalance and a possible support zone touch before the next leg up 🔄🟢.
🎥 In this idea, I walk you through:
🔍 Price action
🧱 Market structure
📊 Trend direction
📋 And my personal trade plan for this setup
Not financial advice ❌💼

EUR USD longlong-term trend is bullish yet we may have a correction or a change in trend but always trade the trends the chance of reversal is always lower then the chance of continuation ...
Please note: This is for educational purposes only and not a trading signal. These ideas are shared purely for back testing and to exchange views. The goal is to inspire ideas and encourage discussion. If you notice anything wrong, feel free to share your thoughts. In the end, to learn is to share !

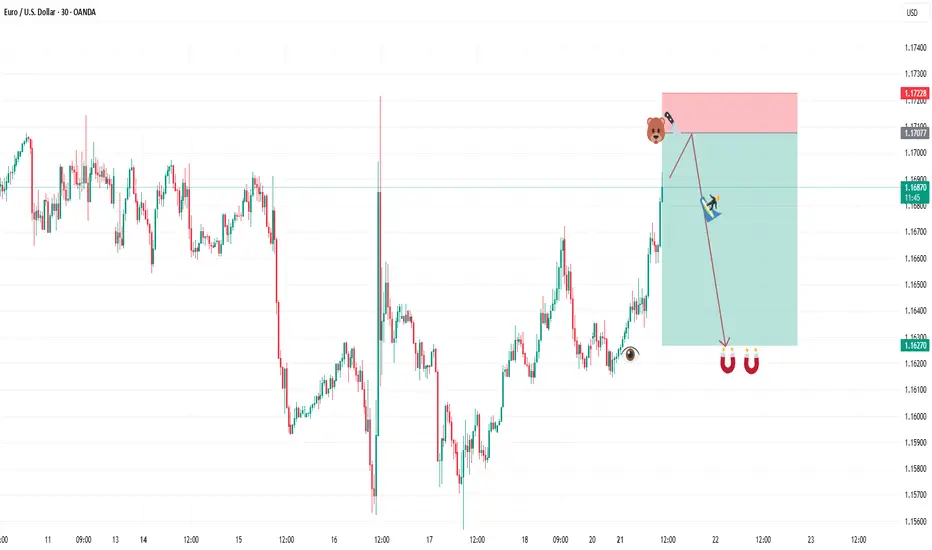
SELL EURUSDAfter todays buys hitting our target we are shifting to a sell play. Our entry is at 1.16878 and second entry at 1.17077. Our stop loss is at 1.17228 and target is at 1.16270. Use proper risk management and best of luck. Algounlocked
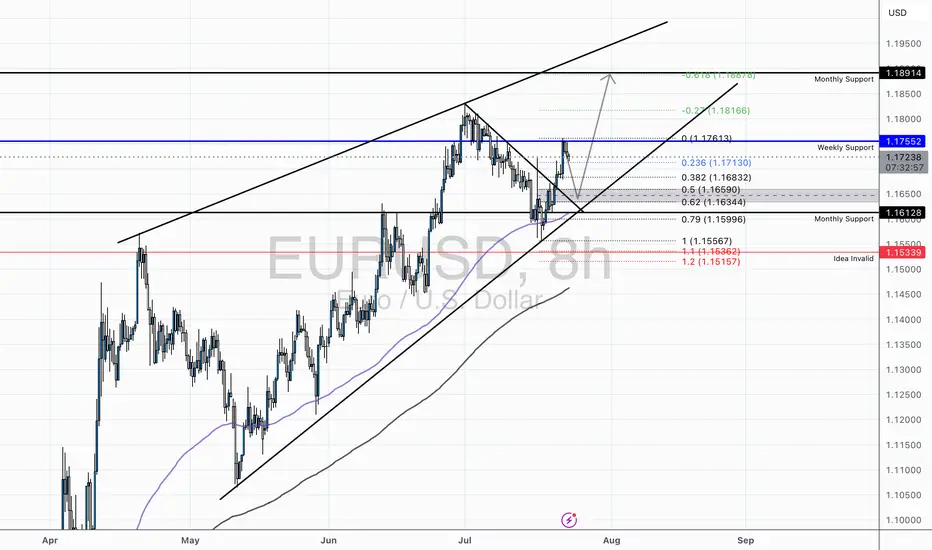
EUR/USD - Holding Bullish Structure Above Key Fibs and TrendlineTechnical Overview:
EUR/USD continues to respect its ascending channel structure, currently rebounding from the lower trendline support while trading above the 50 EMA and 200 EMA. After a healthy retracement to the monthly support (1.16128), the pair has shown strong buying interest, supported by bullish RSI divergence from oversold conditions on the 8H chart.
Key Levels:
Support Zone: 1.1613 – 1.1634 (Fib Cluster + Channel Support + Monthly Support)
Resistance Zone: 1.1755 (Weekly Resistance) followed by 1.1816 (0.27 Fib Extension) and 1.1887 (0.618 Extension)
Invalidation Level: Below 1.1533 (1.272 Fib + Structural Breakdown)
Confluences:
Price broke above a descending correctional trendline, indicating a potential bullish continuation.
Multiple Fibonacci levels (0.382, 0.5, 0.618) have stacked around the previous consolidation area, increasing probability of a sustained move.
RSI bounce from below 40 suggests short-term momentum reversal.
Trade Idea:
We may see a minor pullback into the 1.16344–1.1659 area before a potential continuation higher. Conservative bulls may wait for a retest of this zone with a bullish engulfing or pin bar confirmation before entering long.
Targets:
First target at 1.1755 (prior weekly resistance)
Second target at 1.1816 (Fib extension)
Final target near 1.1887 (major resistance / upper channel boundary)
Risk Management:
A break and close below 1.1533 would invalidate the bullish setup and signal potential bearish pressure returning to the pair.
EURUSDI am thinking that a Wycoff pattern during a strong uptrend has formed up. I'll put a buy limit order here on 1H time frame and let it run and see what happens.

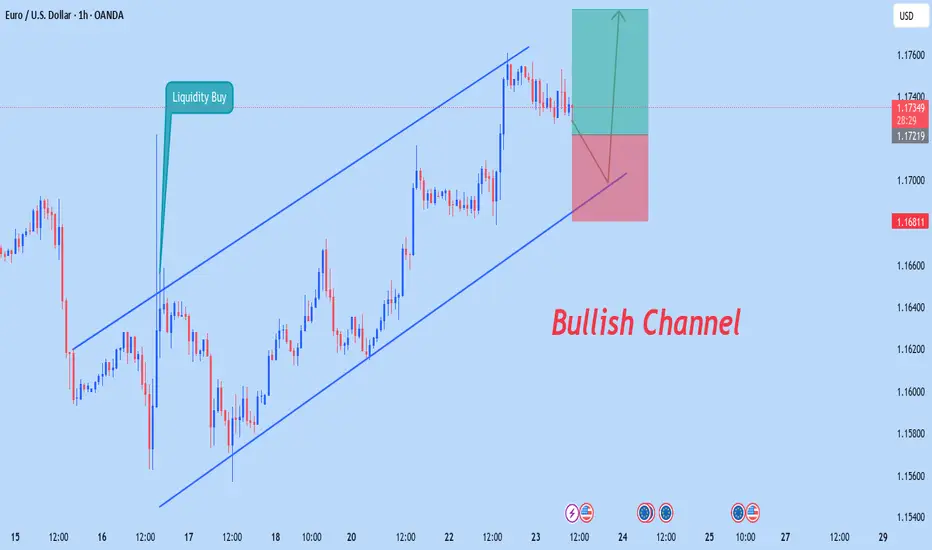
Eurusd Bullish StructureEurusd sjowing bullih channel lets try buy now @ 1.17346 with 200 pips target please follow money management use proper risk management always trade smarter not like a gambler stay grouped stay safe happy trading
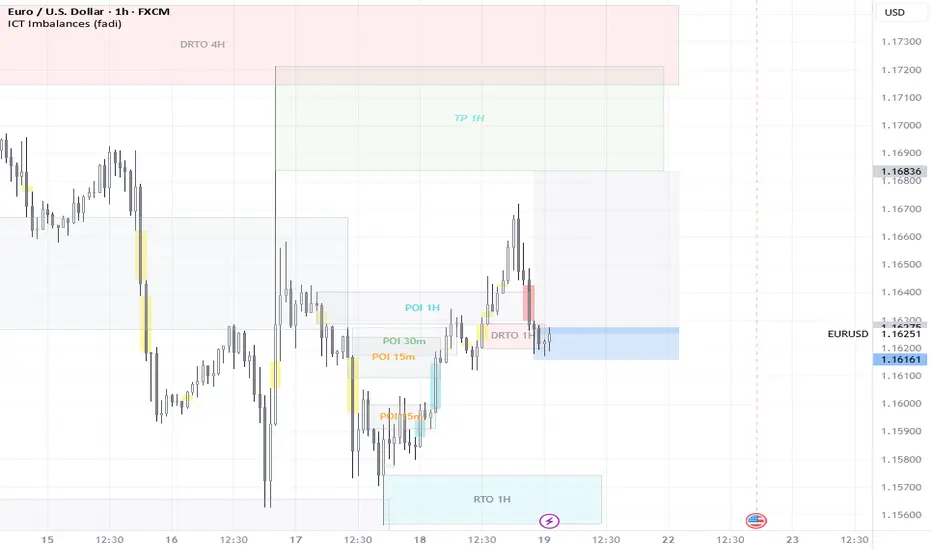
EUR/USD || Correction || 1hr
💼 EUR/USD –🔻 Market Move
Timeframe: 30M | Broker: CMC | Brand: GreenFireForex™
Chart Type: Clean. Tactical. Smart Money meets Waves.
---
🔻 Correction Almost Done (Wave 5)
Classic Elliott 5-wave drop inside a bullish falling wedge.
The boys might be setting up a liquidity sweep before lift-off.
📉 Current Range: Grinding between 1.17334 – 1.17153
🕳️ Liquidity Below:
🩷 1.17158 (Mid OB)
🩶 1.17057 (Deep OB)
💜 1.16904 (Max Draw, SL sweep zone)
---
🚀 Upside Projections
🎯 TP1: 1.17253 (Quick scalp)
🧠 TP2: 1.17819 (Institutional Magnet)
---
🔫 Setup Mood:
🎯 Buy the Dip, don’t chase the breakout.
🧊 Let retail short the wedge, we buy into their fear.
🏎️ Risk-managed, sniper mode.
---
👑
"Liquidity funds lifestyle. Waves fund legacy."
---

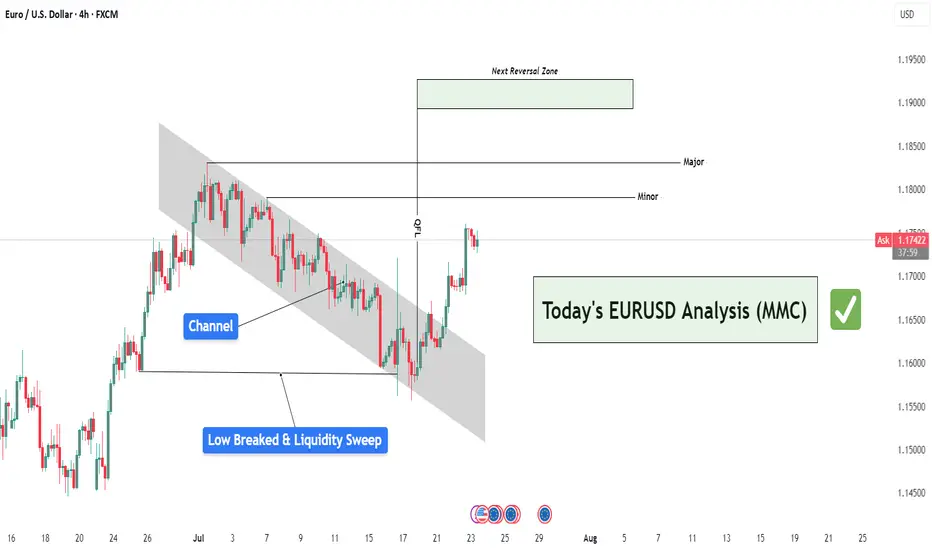
EURUSD Analysis : Liquidity Sweep – EURUSD Targets TO Reversal🧠 Institutional Context & Big Picture
EURUSD has been in a tightly controlled descending channel for several weeks—a classic sign of a market being engineered for liquidity collection. Rather than a naturally trending bearish market, this price action reflects stealth accumulation and market maker manipulation.
The channel structure was used to:
Establish a visible bearish trend (to trap sellers)
Trigger emotional bias for continued shorting
Build up stop orders below swing lows
This phase was about building energy, not continuation.
🔍 Detailed Breakdown of the Chart Elements
📌 1. Descending Channel – Controlled Manipulation
The pair moved within a well-defined bearish channel for multiple weeks.
Each touch respected the top and bottom perfectly—not random, but institutional structure.
It fostered retail confidence in the downtrend while market makers prepared for a reversal.
💥 2. Liquidity Sweep & Trap (Low Breaked & Liquidity Grabbed)
Price spiked below the previous low, clearly sweeping liquidity on July 21.
This is the "engineered breakdown", meant to trigger breakout sellers and stop out early longs.
Immediately after the sweep, the price violently reversed—clear evidence of a liquidity trap.
This is classic MMC logic: induce, trap, reverse.
🟩 3. QFL Base Formed – Bullish Engine Ignited
At the point of reversal, the chart shows the formation of a QFL (Qualified Liquidation Failure) zone.
This QFL base is the core of smart money accumulation—price broke below a base, then quickly reclaimed it.
It's not just support—it’s the true origin of the reversal and an optimal entry point.
📈 4. Breakout from the Channel – Structure Shift Confirmed
Price broke out of the descending channel with strong momentum, confirming:
Structure shift from lower lows → higher highs
Momentum shift in favor of bulls
Entry confirmation for MMC-based long setups
This breakout invalidates the bearish trend and signals a fresh leg up, likely toward unmitigated supply zones.
🟨 5. Current Price Action – Healthy Bullish Consolidation
After the breakout, price is consolidating just above the broken channel, forming a mini-flag or base.
This indicates:
Smart money is accumulating more
No significant selling pressure
Likely continuation toward next supply
🎯 6. Next Targets – Reversal Zones
Minor Resistance: ~1.1800
Major Resistance: ~1.1850 – 1.1880
Next Reversal Zone: 1.1900–1.1950
This zone is highlighted as a potential sell-off area where institutions may offload positions or create new traps.
Watch for signs of exhaustion or redistribution here.
📌 Trade Plan Based on MMC Structure
✅ Bullish Scenario (Currently Active)
Entry Area: Ideally at QFL base or breakout retest (~1.1700–1.1720 zone)
Confirmation: Bullish price action (engulfing, flag break, or liquidity wick)
Targets:
🎯 TP1: 1.1800
🎯 TP2: 1.1850
🎯 TP3: 1.1950 (Reversal Supply Zone)
❌ Invalidation:
A break below the QFL base (~1.1670) with bearish volume would invalidate the bullish MMC structure.
🧠 Smart Money Insight & Logic Recap
This entire move reflects a classic Market Maker Strategy:
Build a trend (descending channel) to shape trader bias
Trigger liquidity events (false breakdown)
Accumulate at the lows via QFL logic
Shift structure (channel breakout)
Target unfilled institutional supply (1.1850–1.1950)
This isn’t random—it’s engineered movement. Your job as a trader is to identify footprints, not follow the crowd.
EURUSD Will Move Higher! Long!
Here is our detailed technical review for EURUSD.
Time Frame: 9h
Current Trend: Bullish
Sentiment: Oversold (based on 7-period RSI)
Forecast: Bullish
The market is testing a major horizontal structure 1.174.
Taking into consideration the structure & trend analysis, I believe that the market will reach 1.184 level soon.
P.S
Overbought describes a period of time where there has been a significant and consistent upward move in price over a period of time without much pullback.
Disclosure: I am part of Trade Nation's Influencer program and receive a monthly fee for using their TradingView charts in my analysis.
Like and subscribe and comment my ideas if you enjoy them!

EURUSD BUY TRADE PLAN WITH CAUTIONEURUSD TRADE PLAN** 🔥
📅 Date: July 23, 2025
---
### 📋 Trade Plan Overview
| Plan ID | Type | Direction | Confidence | R\:R | Status |
| ----------------- | -------- | ----------------- | ---------- | ----- | ---------- |
| EURUSD-20250723-A | Swing | **Buy** (Primary) | ⭐⭐⭐⭐ (80%) | 3.5:1 | 🕒 Waiting |
| EURUSD-20250723-B | Tactical | Sell (Alt. Setup) | ⭐⭐⭐ (65%) | 2.5:1 | 🕒 Waiting |
🧭 **Guidance:**
Favor the **buy plan** due to HTF trend and liquidity sweep setup. Sell setup is tactical against trend.
---
## 📈 Market Bias & Trade Type
* **Bias:** Bullish overall (HTF)
* **Trade Type A:** Continuation (Buy) - PRIMARY / PREFERRED
* **Trade Type B:** Countertrend (Sell) - ALTERNATIVE
---
## 🔰 Confidence Level Breakdown
* ⭐⭐⭐⭐ 80% (Buy Plan A)
* H4 OB + Volume Imbalance = 35%
* Fib Confluence = 25%
* Sentiment Score +6/10 = 10%
* DXY Divergence = 10%
* ⭐⭐⭐ 65% (Sell Plan B)
* Short-term exhaustion pattern
* Inducement to the downside
---
## 📍 Entry Zones & Status
### 🟩 **Primary Buy Zone**
* **Zone:** 1.1680 – 1.1705 (H4 OB + Fib 61.8%)
* **Status:** 🕒 *Waiting*
### 🟧 **Secondary Buy Zone**
* **Zone:** 1.1640 – 1.1660 (Deeper imbalance)
* **Status:** 🕒 *Waiting*
---
### 🟥 **Sell Zone (Scenario B)**
* **Zone:** 1.1760 – 1.1790 (Liquidity sweep, bearish engulfing risk)
* **Status:** 🕒 *Waiting*
---
## ❗ Stop Loss Levels
* **Buy SL:** 1.1620 (Below OB + 1.5x ATR)
* **Sell SL:** 1.1815 (Above H4 supply & wick inducement)
---
## 🎯 Take Profit Targets
* 🥇 **TP1:** 1.1745 (OB imbalance reclaim) – \~65 pips
* 🥈 **TP2:** 1.1785 (Swing high) – \~100 pips
* 🥉 **TP3:** 1.1840 (Full extension / trail) – *Swing only*
---
## 📏 Risk\:Reward
* Buy Plan A: **3.5:1** to TP2, **5.2:1** to TP3
* Sell Plan B: **2.5:1** to TP2
---
## 🧠 Management Strategy
* Risk: 1.0% of account ($\ , \ lots)
* SL to breakeven at TP1
* Take: 30% at TP1, 50% at TP2, trail final 20%
* Exit if: H4 BOS or USD Index flips strongly bullish
---
## ⚠️ Confirmation Checklist
* Bullish engulfing or inside bar (H1-H4)
* Volume confirmation on bounce (preferably NY or London open)
* Optional: M30 RSI divergence
* **Avoid:** FOMC / ECB pressers
---
## ⏳ Validity
* **Buy Plan (H4):** Valid 48–72 hours → until July 26
* **Sell Plan (H1):** Valid 12–16 hours → intraday only
---
## ❌ Invalidation Conditions
* Close below 1.1620 (Buy)
* Close above 1.1815 (Sell)
* Major USD macro shift
---
## 🌐 Fundamental & Sentiment Snapshot
* COT: USD weak bias
* DXY: Retracing lower from 106.00
* Retail: 68% short EURUSD
* Cross-Pair: EURGBP also trending up
* Macro: EUR resilience post-ECB minutes
* Sentiment Score: **+6/10**
---
## 📋 Final Trade Summary
🟩 **Buy plan is preferred**, aligned with HTF trend, clean OB-Fib structure, and good RR.
🟥 **Sell plan** is tactical, potential liquidity grab before bullish continuation.
Both setups allow flexibility with proper confirmation and risk control.
---
Major EUR-related news is scheduled this week, and it's critical to factor into both trade timing and plan execution. Here's your ⚠️ Fundamental Update for EURUSD:
🌐 EUR Fundamental Events – This Week
Date Event Time (UTC) Impact Level Forecast / Notes
July 24 (Wed) 🇪🇺 Eurozone PMIs (Manu. & Services) 08:00 UTC 🔴 High Strong driver of EUR intraday volatility
July 25 (Thu) 🇪🇺 ECB Interest Rate Decision 12:15 UTC 🔴🔴🔴 Very High Key market mover – Dovish = bearish EUR
ECB Press Conference 12:45 UTC 🔴🔴🔴 Critical High volatility expected
July 26 (Fri) 🇩🇪 IFO Business Climate 08:00 UTC 🟡 Medium Impactful for EUR strength sentiment
🔍 Implications for Your EURUSD Trade Plan
✅ Buy Plan
Wait until post-ECB OR only take the setup with strong candle confirmation, ideally after NY session pullback.
Hold reduced exposure before July 25 ECB to avoid whipsaw.
❌ Sell Plan
Be extremely cautious; if ECB is neutral/hawkish, any tactical short may get invalidated rapidly.
If you take the short, exit before Thursday's ECB, unless trailing with SL to breakeven.
📊 Summary:
Yes, major EUR events this week — especially Thursday's ECB — could invalidate technical setups or accelerate them violently. Patience + confirmation = priority. Avoid entry during red events. Let volatility settle.
Let me know if you'd like to pause your trade plan until post-news or want a modified low-volatility alternative!
🧠 Always manage risk tightly around macro events. This is not investment advice.
🧠 Fundamental Snapshot
🔵 EUR Macro Landscape:
Factor Signal Explanation
Inflation 🔼 Still elevated Keeps ECB hawkish bias alive
ECB Policy ⚠️ Potentially hawkish hold Market expects no cut, but hawkish tone could push EUR higher
Economic Activity ⚪ Mixed PMIs Slight slowdown, but not recessionary
COT/Positioning 🟢 Light EUR longs Room for upside without overcrowding
Retail Sentiment 🔴 Bearish crowd Contrarian signal supports buys
USD Pressure 🟠 Mixed Fed possibly done hiking, but US economy resilient
⚠️ ECB SCENARIOS (July 25):
Scenario Likelihood Market Reaction
🟢 Hawkish Hold (no cut, firm inflation tone) 60% 🔼 EURUSD likely rallies
🟡 Neutral/Dovish Hold 30% 🔄 EUR consolidates or fades spike
🔴 Surprise Cut / Dovish Pivot 10% 🔽 EUR drops hard – buy invalidated
Most institutional forecasts lean toward a hawkish or neutral hold, giving EURUSD room to rise after the event.
🎯 Conclusion:
✅ Fundamentals support a buy, especially post-ECB.
❗ Best entry is after July 25, when market digests Lagarde's tone.
🔄 If entering early, stay small and manage risk very tightly — ECB surprises = volatility.
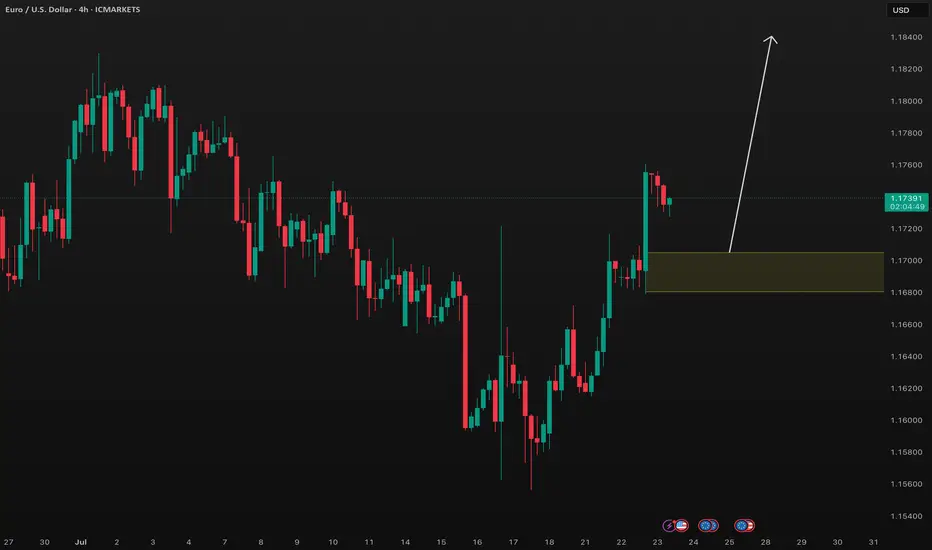
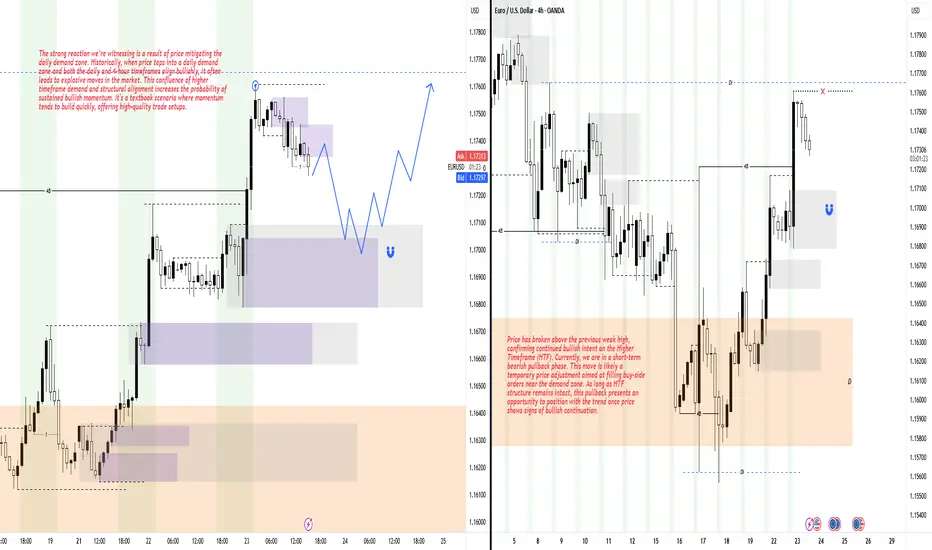
Short-Term Pullback Within a Bullish Higher Timeframe StructureHey Traders, hope you're all doing well! 👋
Price has recently broken above the previous weak high, showing strong bullish momentum. At the moment, we're seeing a short-term bearish pullback — a common market behavior aimed at filling buy orders near the demand zone.
Despite this minor retracement, the Higher Timeframe (HTF) remains firmly bullish. As long as that structure holds, this pullback could present a solid opportunity to rejoin the trend. Wait for bullish confirmation before executing any entries to stay aligned with the prevailing market direction.
EUR/USD – The Cleanest Buy Setup This Quarter
Channel respecting every pivot.
Liquidity beneath – Smart Money needs fuel.
This is not an entry.
This is a precision blueprint.
🔹 Tap into the demand zones at 1.15824 or 1.13862, and ride the next impulse to 1.19614+
Wave D correction underway.
Wave E coming to steal the spotlight.
🧠 Elliott wave structure. Liquidity mapping. Channel geometry.
You’re either chasing price... or anticipating it. I prefer the second.
📍Forex | Where Price Meets Purpose
—
#EURUSDSetup | #WaveEIncoming | #SmartMoneyMoves | #ForexBlueprint | Forex | Trading | #InstitutionalFlow | #LiquidityHunt
---

EURUSD buyThe eurusd looks set for upward move , its in a huge uptrend on the daily chart so this pullback down looks perfect for a return to the highs, now back to the 2 hr chart and we can see we have clearly bounced off a dynamic support zone not once but twice and formed a double bottom then for the first time since July 4th we have broken up throughout the 50 day moving average breaking the structure and returning back , I can now see a move upwards from here.

EUR USD longit can be a viable setup , as last week we got trumped the uncertainty about dollar can continue...
one thing about how i trade . the last method I'm using is using a secondary analyzer app that can detect the lines and patterns , in mass numbers . i would put my favorite asset beside then ill open trades with a proper risk to reward ratio ( 1/ 1.5 usually) , i have fixed hour for job its 5 hours of monitoring the market. after that i wont open trades as it enters new york session . in whole day i would close my trades as i reach my daily goal, then i go do my daily life ...
so you may think i copy these ideas . that's not the case, its true for my real account im using a fish catcher but i know some day i dont have this and i should be able to catch the fishes with my hand. so im sharing these ideas based on my experience and yet i have to work on them ...
Please note: This is for educational purposes only and not a trading signal. These ideas are shared purely for back testing and to exchange views. The goal is to inspire ideas and encourage discussion. If you notice anything wrong, feel free to share your thoughts. In the end, to learn is to share !

EURUSD at Channel resistance possible scenariosERUUSD is trading in a channel pattern and now the price has reached the Upper Resistance trendline. Will it break the resistance or follows the channel pattern again ? let us see. Buy at breakout or sella at breakdown.
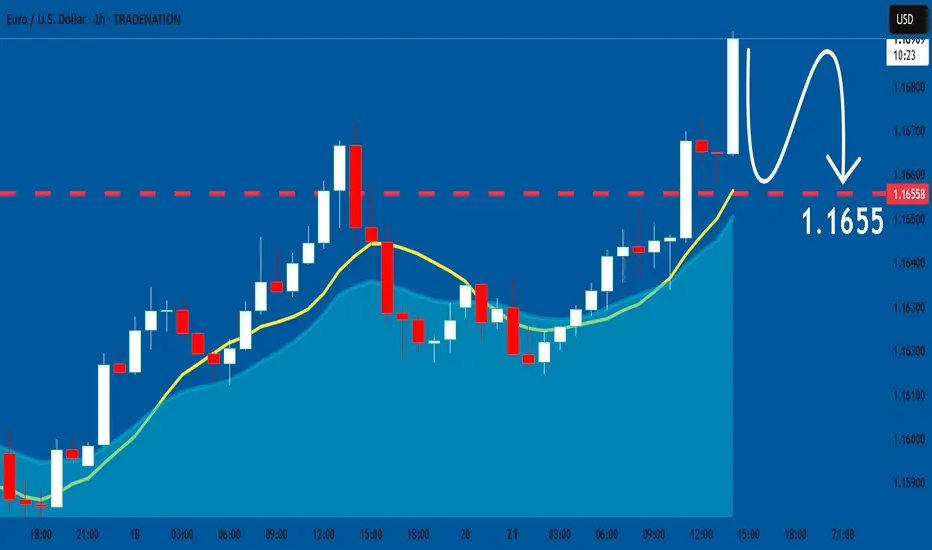
EURUSD: Expecting Bearish Movement! Here is Why:
Balance of buyers and sellers on the EURUSD pair, that is best felt when all the timeframes are analyzed properly is shifting in favor of the sellers, therefore is it only natural that we go short on the pair.
Disclosure: I am part of Trade Nation's Influencer program and receive a monthly fee for using their TradingView charts in my analysis.
❤️ Please, support our work with like & comment! ❤️
DeGRAM | EURUSD moving in an ascending channel📊 Technical Analysis
● Bulls punched through the 11-day descending trend-line (circled “breakout”) and immediately based on it, keeping the rising 30-min channel of higher-lows intact.
● The next confluence lies at 1.1665 where the channel mid-line meets the prior swing top; clearance unlocks the upper band / July supply at 1.1692-1.1700.
💡 Fundamental Analysis
● Friday’s slide in US 2-yr yields after soft existing-home-sales and mixed Fed speak trims dollar carry, while pre-ECB-meeting sources stress “data-dependent patience,” limiting euro downside.
✨ Summary
Long 1.1635-1.1650; hold above 1.1665 targets 1.1692 → 1.1700. Bias void on an H1 close below 1.1615.
-------------------
Share your opinion in the comments and support the idea with a like. Thanks for your support!

Uptrend Given the price behavior within the current support range, a trend change and the start of an uptrend is likely. Otherwise, a continuation of the downtrend is possible upon the support range being broken.
