Can the Euro-Dollar Maintain Its Leadership in the FX Market?The Euro-Dollar is the best-performing major FX pair in 2025, and a short-term consolidation phase has begun below $1.18. This strength of the euro-dollar is surprising given the divergence in monetary policies. Can the euro-dollar go higher this year? How can this strength be explained fundamentally? In this week of ECB monetary policy decision (Thursday, July 24), let’s take a technical and fundamental look at the euro-dollar, which is stalling after reaching the technical resistance at $1.18.
1) Euro-Dollar’s Leadership in 2025 Defies the Logic of Monetary Policy Divergence
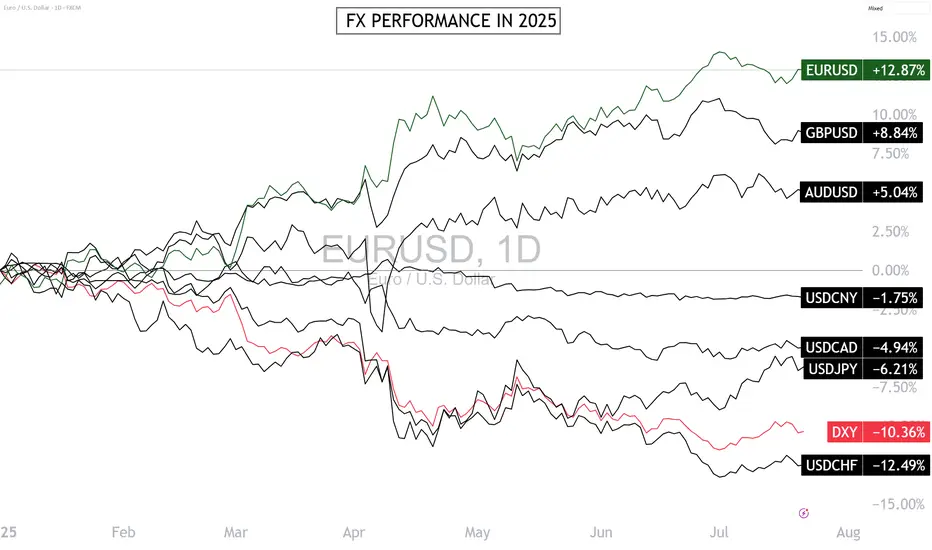
2025 is proving surprising in the FX market: the euro-dollar (EUR/USD) is the top-performing pair, with a gain of over 12% since the beginning of the year. This outperformance is puzzling if we rely on classic monetary fundamentals. The divergence between the Federal Reserve (Fed) and the European Central Bank (ECB) should favor the dollar.
The Fed maintains a prolonged monetary status quo with high rates due to persistent inflation and labor market tensions. In contrast, the ECB continued its rate-cutting cycle, reflecting a weaker European economy and better-contained inflation. Theoretically, this monetary asymmetry should have strengthened the dollar — yet the euro leads. This paradox is explained by a combination of fundamental factors.
2) Unexpected Fundamentals Are Driving the Euro-Dollar’s Strength in 2025
The euro-dollar’s bullish trend this year ignores the interest rate differential between the Fed and the ECB, both current and projected for the end of 2025.
Here’s a summary of the bullish fundamentals that allowed the euro-dollar to overlook monetary divergence:
• Trump administration’s fiscal policy raises concerns over U.S. debt sustainability (see long-term bond yields)
• Trade war initiated by the Trump administration creates economic slowdown risks for U.S. companies heavily reliant on international trade
• U.S. administration’s political will to improve currency competitiveness for exporters
• European stocks catching up to U.S. stocks in valuation
• Emerging markets’ will to diversify their public debt issuance
• Euro catching up as a global reserve currency as diversification away from the U.S. dollar
• Germany’s structural shift in fiscal and debt policy with massive investments in defense and industry
• EU stimulus spending and the ECB’s perceived monetary policy coherence
3) Is $1.18 the Final High for the Euro-Dollar in 2025? Probably Not.
The euro-dollar has been consolidating since early July after hitting $1.18. Is this the peak for the year? The answer is no — unless EUR/USD breaks below the $1.13/$1.15 support and unless institutional net positions reverse from their upward trend (see yellow line in CFTC COT data).
DISCLAIMER:
This content is intended for individuals who are familiar with financial markets and instruments and is for information purposes only. The presented idea (including market commentary, market data and observations) is not a work product of any research department of Swissquote or its affiliates. This material is intended to highlight market action and does not constitute investment, legal or tax advice. If you are a retail investor or lack experience in trading complex financial products, it is advisable to seek professional advice from licensed advisor before making any financial decisions.
This content is not intended to manipulate the market or encourage any specific financial behavior.
Swissquote makes no representation or warranty as to the quality, completeness, accuracy, comprehensiveness or non-infringement of such content. The views expressed are those of the consultant and are provided for educational purposes only. Any information provided relating to a product or market should not be construed as recommending an investment strategy or transaction. Past performance is not a guarantee of future results.
Swissquote and its employees and representatives shall in no event be held liable for any damages or losses arising directly or indirectly from decisions made on the basis of this content.
The use of any third-party brands or trademarks is for information only and does not imply endorsement by Swissquote, or that the trademark owner has authorised Swissquote to promote its products or services.
Swissquote is the marketing brand for the activities of Swissquote Bank Ltd (Switzerland) regulated by FINMA, Swissquote Capital Markets Limited regulated by CySEC (Cyprus), Swissquote Bank Europe SA (Luxembourg) regulated by the CSSF, Swissquote Ltd (UK) regulated by the FCA, Swissquote Financial Services (Malta) Ltd regulated by the Malta Financial Services Authority, Swissquote MEA Ltd. (UAE) regulated by the Dubai Financial Services Authority, Swissquote Pte Ltd (Singapore) regulated by the Monetary Authority of Singapore, Swissquote Asia Limited (Hong Kong) licensed by the Hong Kong Securities and Futures Commission (SFC) and Swissquote South Africa (Pty) Ltd supervised by the FSCA.
Products and services of Swissquote are only intended for those permitted to receive them under local law.
All investments carry a degree of risk. The risk of loss in trading or holding financial instruments can be substantial. The value of financial instruments, including but not limited to stocks, bonds, cryptocurrencies, and other assets, can fluctuate both upwards and downwards. There is a significant risk of financial loss when buying, selling, holding, staking, or investing in these instruments. SQBE makes no recommendations regarding any specific investment, transaction, or the use of any particular investment strategy.
CFDs are complex instruments and come with a high risk of losing money rapidly due to leverage. The vast majority of retail client accounts suffer capital losses when trading in CFDs. You should consider whether you understand how CFDs work and whether you can afford to take the high risk of losing your money.
Digital Assets are unregulated in most countries and consumer protection rules may not apply. As highly volatile speculative investments, Digital Assets are not suitable for investors without a high-risk tolerance. Make sure you understand each Digital Asset before you trade.
Cryptocurrencies are not considered legal tender in some jurisdictions and are subject to regulatory uncertainties.
The use of Internet-based systems can involve high risks, including, but not limited to, fraud, cyber-attacks, network and communication failures, as well as identity theft and phishing attacks related to crypto-assets.
USDEUR trade ideas
EURUSD: Can't break the whale line!📉 EUR/USD Whale Wall – 1.1675 Rejection Zone
🐋 Smart Money is guarding 1.1675 like it’s sacred.
Every test into this level has been slapped down—likely a whale-level supply zone where institutional sell orders are stacked. VolanX projection curve suggests a macro fade into late July, aligning with DXY strength and bond volatility signals.
Outlook:
As long as 1.1675 holds, momentum favors downside toward 1.1450–1.1400. Rate divergence + weak Eurozone prints fuel the short bias. Break above 1.1675 invalidates.
📊 VolanX Protocol – Predict. React. Dominate.
#WaverVanir #VolanX #EURUSD #Forex #SmartMoney #FXStrategy #MacroTrading

EUR/USD: Bearish Trend in FocusHello everyone, what are your thoughts on EUR/USD?
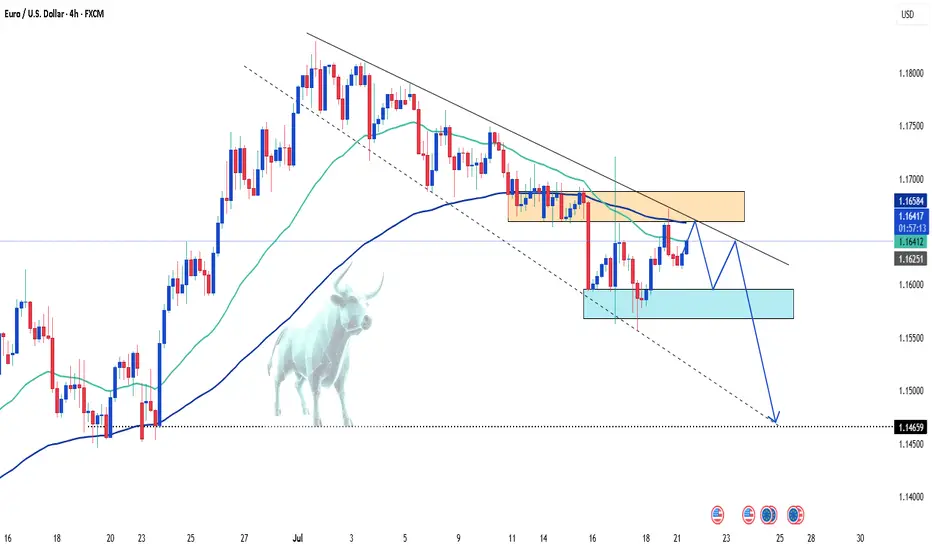
From my personal analysis, it's clear that EUR/USD is extending its downtrend. The pair is trading around 1.164 and is under pressure from sellers after breaking below both the EMA 34 and EMA 89, with EMA 34 already turning downward — a classic bearish signal.
On the macro side, the European Central Bank is set to announce its monetary policy decision on Thursday. Meanwhile, U.S. President Donald Trump's ongoing trade tensions may add further uncertainty to the market. This corrective downtrend in EUR/USD could very well continue in the weeks ahead.
What do you think — will EUR/USD keep falling?
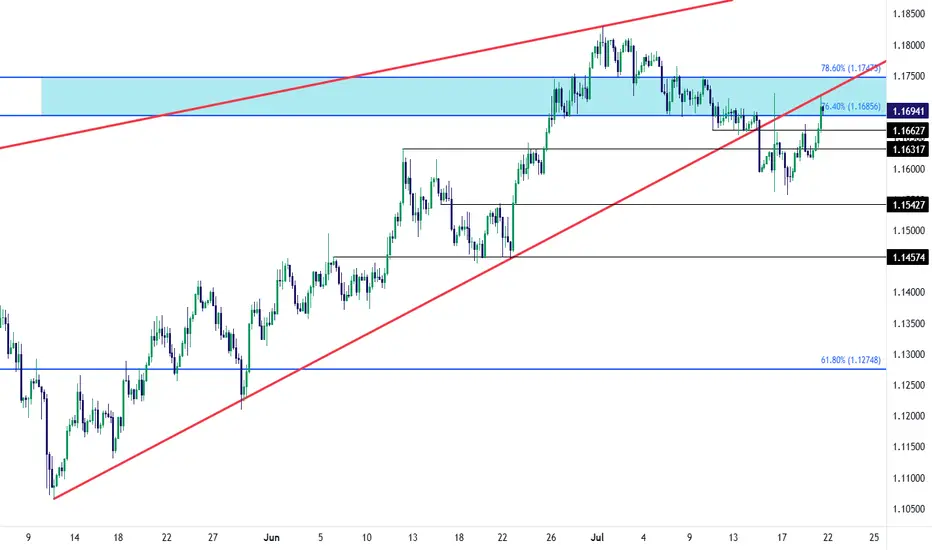
EUR/USD Recovery into Resistance TestEUR/USD bears had an open door to make a run last week and, so far, they've failed. The Wednesday turn around Trump's threat to fire Jerome Powell certainly made a mark, but the question now is whether the USD can respond to support at a longer-term trendline; and, in turn, EUR/USD is now testing in the zone between 76.4 and 78.6% Fibonacci retracements of the 2021-2022 major move.
There's also the underside of the falling wedge pattern that's now coming in as resistance as taken from prior support. The next resistance level overhead is the 1.1748 level, which is the 78.6% retracement that had offered both resistance and support with short-term price action in the pair. - js
EURUSD is Nearing an Important Support!!Hey Traders, in today's trading session we are monitoring EURUSD for a buying opportunity around 1.15400 zone, EURUSD is trading in an uptrend and currently is in a correction phase is in a correction phase in which it is approaching the trend at 1.15400 support and resistance area.
Trade safe, Joe.

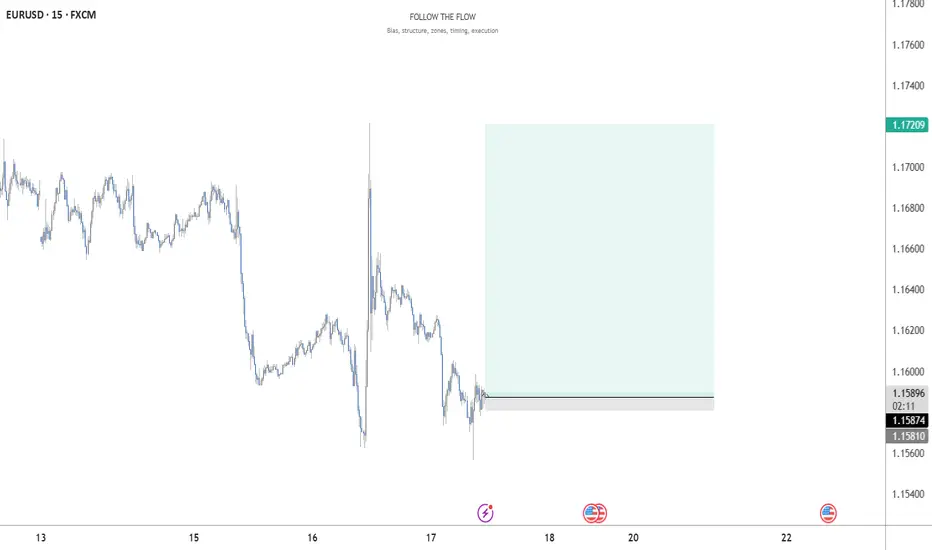
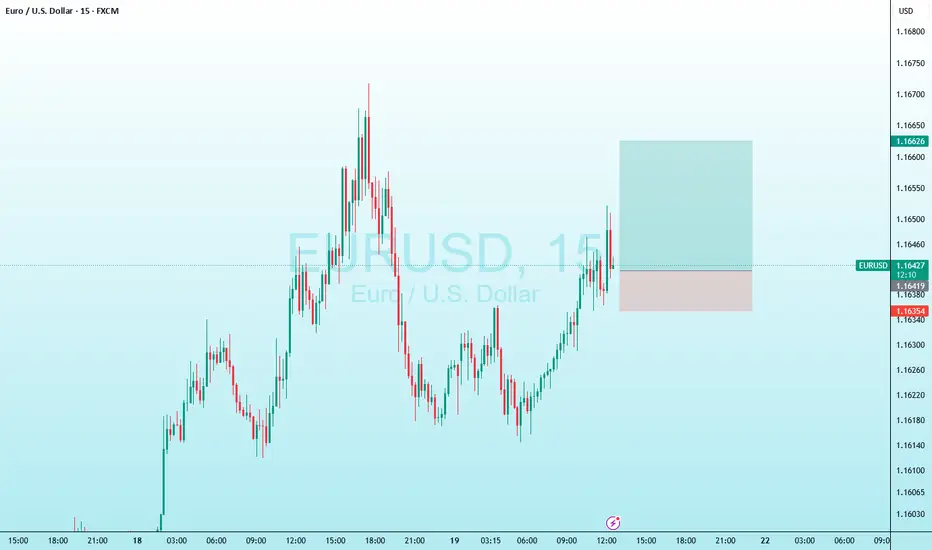
Analysis The market has gotten to the H1 FVG and idn it. Now we need to look for short opportunity. The lq has been taken.

Long EURUSDI want to long EURUSD here, kinda looks nice.
Good risk reward, expecting a rejection in this area.
EURUSD Bullish ProjectionIt’s been a while since my last update here.
Here’s my projection and actual entry/entries on EURUSD, based on a sweep of the previous 1H swing low and mitigation of a Daily imbalance (Fair Value Gap).
We're anticipating a full Change of Character to mark the end of the ongoing Daily pullback.

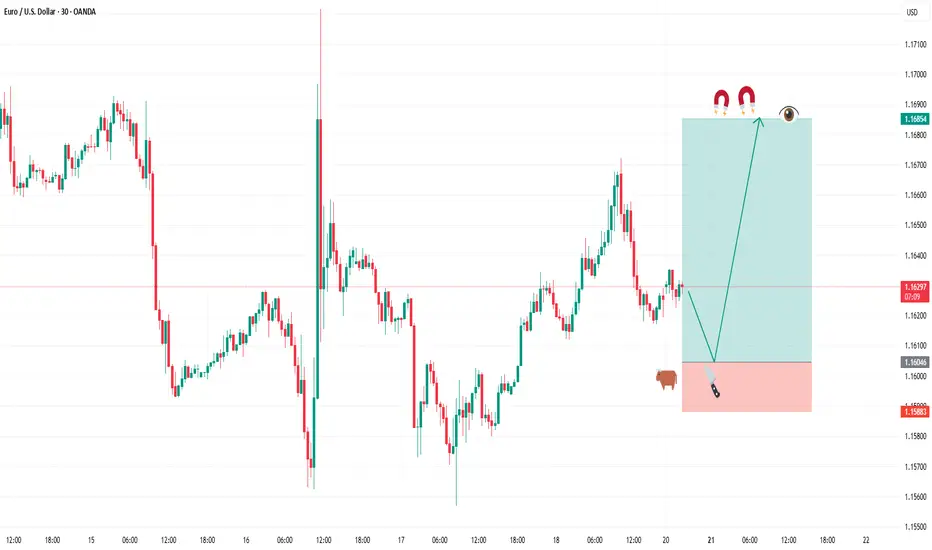
BUY FIBERGreetings traders, today we are looking for buys on EURUSD. Our first entry is at 1.16288 and second entry will be lower at 1.16046 our target is 1.16854 and stops are below 1.15883. use proper risk management and best of luck.
This trade is based on a fine tuned DAILY approach to the algo. Be careful and risk wisely.
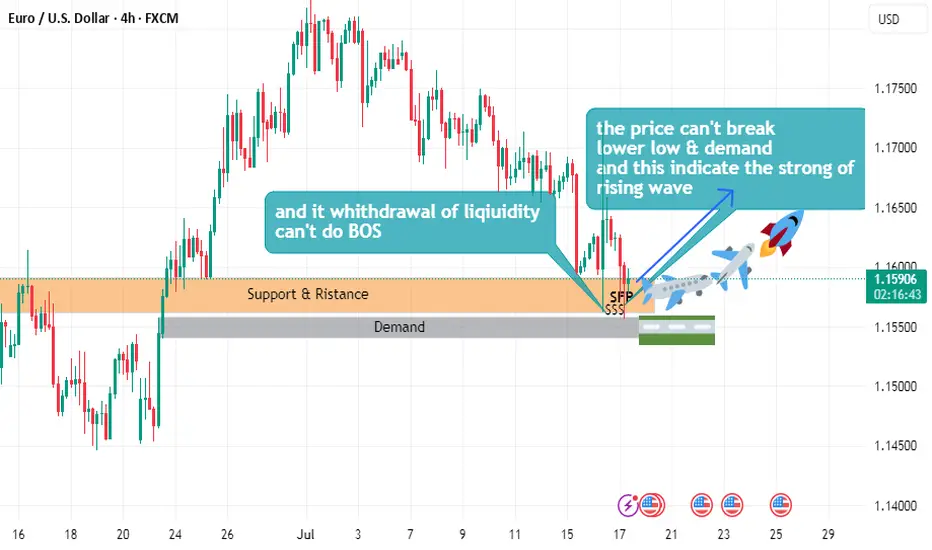
EURUSD buy plane Setuphello
the price can't break lower low
and can't demand
and this indicate the strong of uptrend wave
and it withdrawal of liquidity
and can't do beak of structure
EURUSD Will Go Up! Long!
Please, check our technical outlook for EURUSD.
Time Frame: 2h
Current Trend: Bullish
Sentiment: Oversold (based on 7-period RSI)
Forecast: Bullish
The market is approaching a significant support area 1.166.
The underlined horizontal cluster clearly indicates a highly probable bullish movement with target 1.170 level.
P.S
Overbought describes a period of time where there has been a significant and consistent upward move in price over a period of time without much pullback.
Disclosure: I am part of Trade Nation's Influencer program and receive a monthly fee for using their TradingView charts in my analysis.
Like and subscribe and comment my ideas if you enjoy them!

CHECK EURUSD SIGNAL READ THE CAPTAINEntry Point: Around 1.16700 1.16530
Stop Loss: Around 1.16000
🎯 Target Levels
Take Profit 1:
1.17100
Take Profit 2:
1.17600
last target
1.18300

EURUSDCOT data shows increasing net long positions on the euro, signaling bullish sentiment from institutional traders. This shift suggests growing confidence in the EUR against the USD.

EURUSD Considering the higher timeframe trend, I expect further downside in price.
It has reached a key price level on this same timeframe, and I anticipate a rejection from this area.
The highlighted blue zones represent the target levels for EUR/USD.

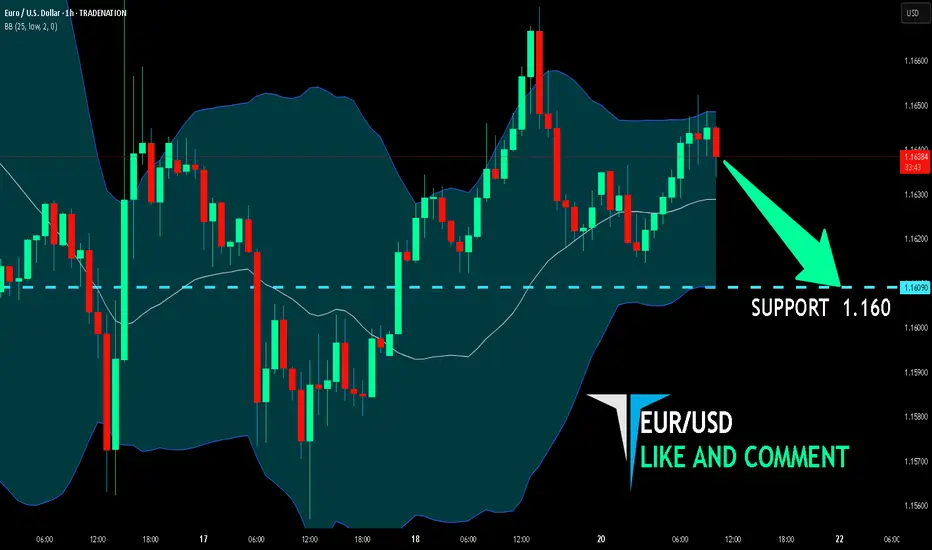
EUR/USD BEST PLACE TO SELL FROM|SHORT
Hello, Friends!
EUR/USD is making a bullish rebound on the 1H TF and is nearing the resistance line above while we are generally bearish biased on the pair due to our previous 1W candle analysis, thus making a trend-following short a good option for us with the target being the 1.160level.
Disclosure: I am part of Trade Nation's Influencer program and receive a monthly fee for using their TradingView charts in my analysis.
✅LIKE AND COMMENT MY IDEAS✅
EURUSD Forming Bullish Continuation SetupEURUSD is currently retesting a key breakout zone that previously acted as resistance and is now serving as strong support around the 1.1620–1.1630 area. After a healthy bullish impulse in recent weeks, the pair is pulling back in a controlled manner, likely forming a bullish continuation setup. I entered from earlier levels and remain confident in a further upward move, with the structure showing signs of a new bullish wave forming.
From a fundamental perspective, the euro is gaining strength as the European Central Bank (ECB) continues to signal a more cautious stance on rate cuts compared to the Federal Reserve. US inflation data released last week came in softer than expected, increasing speculation that the Fed could start its rate-cutting cycle as early as September. This shift in monetary policy outlook has weighed on the US dollar, opening up room for EURUSD to push higher.
Additionally, eurozone macro data is showing early signs of recovery, especially in Germany, where industrial production and sentiment indicators are slowly improving. As inflation in Europe trends lower but remains sticky, the ECB has fewer reasons to rush into easing, which adds strength to the euro over the medium term. This divergence is a critical driver of the current bullish sentiment in EURUSD.
Technically, the market is respecting a clean demand zone, with momentum indicators starting to flatten after the recent correction. With the trend structure intact and fundamentals aligned, I'm targeting the 1.2180–1.2200 zone as the next leg of this bullish cycle. Price action remains favorable, and the broader sentiment on TradingView is also increasingly bullish, confirming my conviction in this setup.

eurusd long positionin my opinion this is a good trade with a good r/r
hope hit the tp
consider this is my trade not your trade and i just like to share my trades with world
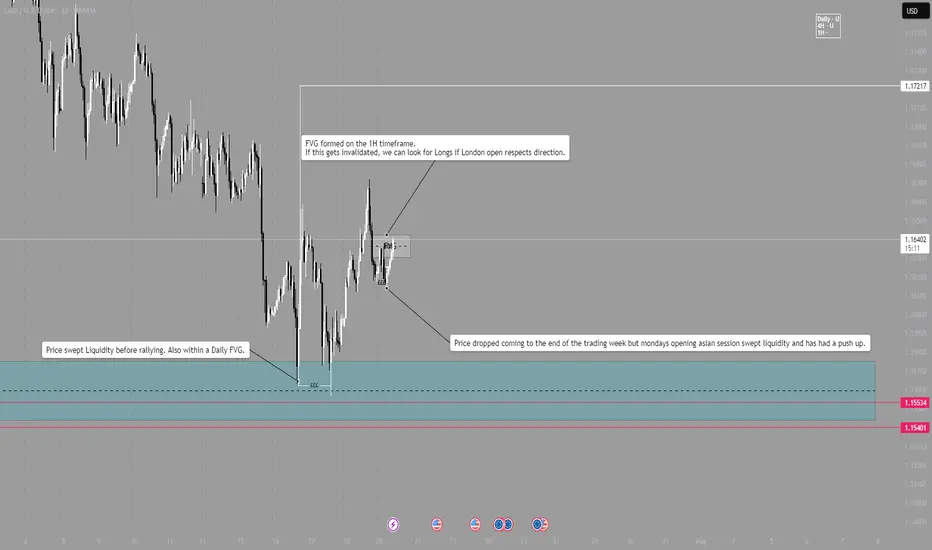
EUR/USD - LONGLondon Session Pre market breakdown.
Daily bias is long.
4H bias is Long.
1H bias is Long.
After last weeks sweep on liquidity within a Daily FVG, market pushed higher, providing several long opportunities.
Now at the beginning of the week, price dropped during Asia session and swept some of Fridays New York liquidity.
Price is pushing higher and is now in a 1H Bearish FVG, if the FVG is broken, we can look for Longs around that range.
NOTE - Wait and see how London open plays out, DO NOT enter within first 15mins and wait for trend continuation to be verified before entering. Always wait for a candle close and a break of structure.
3-Year Euro Uptrend — An Absurdity Amid a Weak EconomyCMCMARKETS:EURUSD
The euro is climbing, hitting its highest levels since late 2021 near $1.18. This surge is driven by diverging central bank policies—with the ECB holding rates steady while the Fed leans dovish—amid global tensions that push gold higher and rattle markets, weakening the dollar even though the eurozone economy remains fragile.
📉 1️⃣ Dollar Weakness Takes Center Stage
Since its January 2025 peak, the U.S. Dollar Index (DXY) has fallen by over 11% 📉—one of its worst starts in decades, comparable to the slumps of 1986 and 1989. As inflation cools, markets are betting on Fed rate cuts, pulling U.S. Treasury yields lower. Coupled with monetary policy divergence and tariff drama, the dollar’s usual safe-haven appeal is fading, even amid ongoing geopolitical tensions.
📊 2️⃣ Fed–ECB Policy Divergence
While the ECB has signaled the possibility of one or two cuts this year, markets are pricing in a milder path. By contrast, the Fed is tilting dovish, with swaps markets expecting a rate cut in September and another by December 🗓️. This widening yield differential supports EUR/USD, even though eurozone growth remains soft.
⚖️ 3️⃣ Trump Tariff Risks and Sentiment Shift
Uncertainty around U.S. trade policy—especially the threat of renewed tariffs—has weighed more heavily on USD sentiment than on eurozone currencies. Markets view these tariffs as inflationary and damaging to U.S. growth prospects. Speculative positioning data confirms record bearish sentiment on the dollar, with funds underweight USD for the first time in 20 years 💼.
💶 4️⃣ Eurozone’s Fiscal Shift
Germany has begun spending and borrowing, marking a dramatic pivot from years of fiscal restraint. This has raised hopes for an investment-driven recovery across the eurozone. Meanwhile, ECB President Christine Lagarde is avoiding signaling aggressive cuts, stabilizing market expectations and maintaining a sense of monetary calm—for now 🛡️.
🛡️ 5️⃣ Safe-Haven Flows Shifting
Traditionally, geopolitical stress boosts the USD as a safe haven. This cycle is different: investors are increasingly turning to gold, the Swiss franc, and the yen as defensive assets, indirectly supporting the euro. In April, when Trump delayed tariff plans, safe-haven USD flows unwound further, fueling euro gains 💰.
⚠️ Risks Ahead for EUR/USD:
💔 Weak Eurozone Fundamentals:
The eurozone economy is not booming. The IMF projects just 0.9% growth for 2025, with Germany, France, and Italy struggling to regain momentum. The ECB’s Financial Stability Review flags worsening credit conditions, weak private investment, and deteriorating balance sheets, none of which support sustained euro appreciation 📉.
🚢 A Strong Euro Hurts Exports:
Eurozone exporters in machinery, chemicals, and autos are already facing squeezed margins from rising input costs and global protectionism. A stronger euro makes exports less competitive, shrinking the eurozone’s current account surplus, which dropped sharply from €50.9 billion in March to €19.8 billion in April, according to the ECB 📊.
⚡ Political Risks Looming:
Fragile coalitions in Germany, budget battles in France, and rising anti-EU sentiment in Italy and the Netherlands could swiftly unwind euro gains if tensions escalate. Should the ECB turn dovish to support a weakening labor market, the euro’s rally could reverse quickly 🗳️.
📈 7️⃣ Technical Picture: Overextension Warning
In addition to the macro drivers, EUR/USD is now technically overextended. The pair has already retraced exactly 78.6% of its major bearish trend that started in January 2021 and ended in September of that year. Ahead lies a strong resistance zone at 1.18000–1.20000, which will be difficult to break without a significant catalyst.
Notably, the daily chart shows bearish RSI divergence, indicating fading momentum beneath the surface of this rally. A pullback toward the 1.13000 level would not be surprising, even as near-term momentum remains strong. This technical setup calls for caution while the pair tests these critical levels.
📈 Technical Outlook: EUR/USD Showing Signs of Overextension
Beyond macroeconomic factors, EUR/USD is currently technically overextended. The pair has retraced exactly 78.6% of its major bearish trend that began in January 2021 and concluded in September the same year. It is now approaching the upper boundary of a 3-year ascending channel, facing a significant resistance zone between 1.18000 and 1.20000—a hurdle unlikely to be crossed without a strong catalyst.
Additionally, the weekly chart reveals a bearish RSI divergence, signaling that underlying momentum is weakening despite the recent rally. Given this, a pullback toward the 1.13000 level is plausible, even as short-term momentum remains robust. This technical setup advises caution as the pair navigates these critical resistance levels.

EURUSD Q3 | D21 | W30 | Y25 📊EURUSD Q3 | D21 | W30 | Y25
Daily Forecast 🔍📅
Here’s a short diagnosis of the current chart setup 🧠📈
Higher time frame order blocks have been identified — these are our patient points of interest 🎯🧭.
It’s crucial to wait for a confirmed break of structure 🧱✅ before forming a directional bias.
This keeps us disciplined and aligned with what price action is truly telling us.
📈 Risk Management Protocols
🔑 Core principles:
Max 1% risk per trade
Only execute at pre-identified levels
Use alerts, not emotion
Stick to your RR plan — minimum 1:2
🧠 You’re not paid for how many trades you take, you’re paid for how well you manage risk.
🧠 Weekly FRGNT Insight
"Trade what the market gives, not what your ego wants."
Stay mechanical. Stay focused. Let the probabilities work.
FRGNT 📊

EURUSD SELL SETUPThis is my view on eurusd, kindly watch and share your opinion in the comment section

EURUSDThis is the EURUSD 1H chart showing a potential bullish setup. Here’s a breakdown of your market structure and what you can do:
Observations:
1. Trendline Support: Price is respecting a daily trendline, which shows potential for upward continuation.
2. Order Block: Price has tapped into a clear order block zone, indicating institutional interest and potential for a reversal.
3. BOS (Break of Structure) & CHoCH (Change of Character): Previous BOS confirms downward movement, but recent CHoCH suggests a possible shift to bullish momentum.
4. Bullish Projection: Your markup shows a forecasted bullish leg with a minor pullback before continuation.
What to do:
- Entry: Wait for a confirmation candle (bullish engulfing or strong rejection wick) within or just above the order block to go long.
- Stop Loss: Place it just below the order block or trendline for safety.
- Take Profit: You can scale out at recent highs or follow price using trailing stops. Consider targeting previous supply zones for partial exits.

eurusddrops, high posibilitys that it falls in yellow area, this idea is form from old paterns which indicates the same type of bears structure market, it should make a balance between the wars and the trump assumptions, its finishing the bull runs, be prepare for the sells. good luck.
