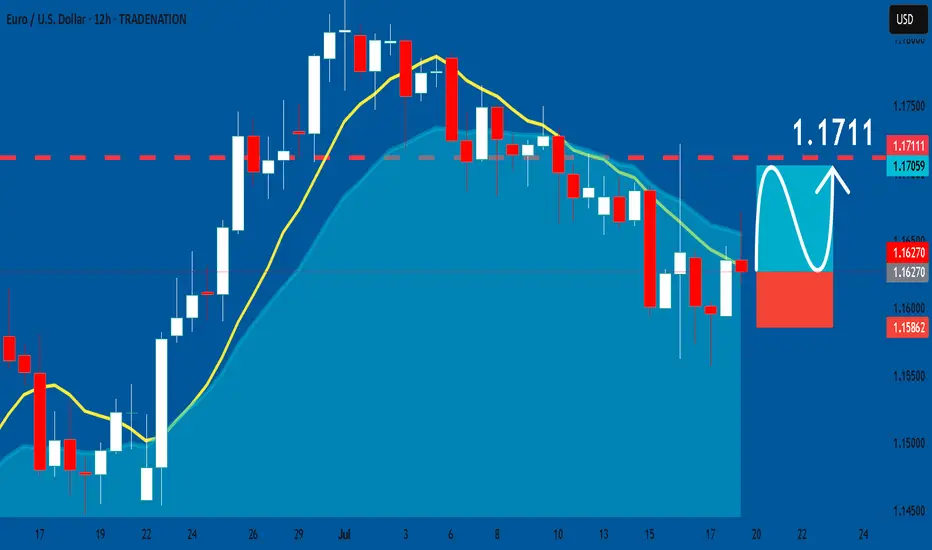
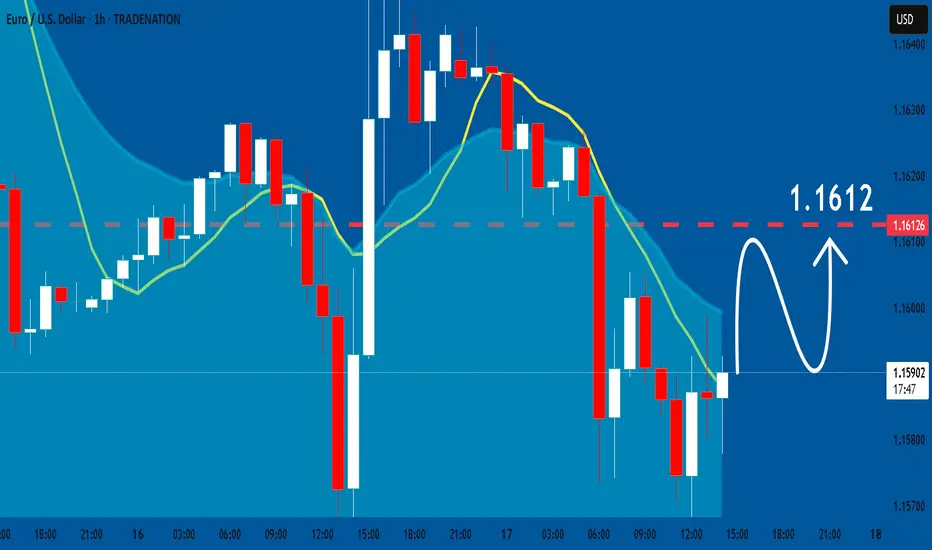
EURUSD: Long Trade with Entry/SL/TP
EURUSD
- Classic bullish setup
- Our team expects bullish continuation
SUGGESTED TRADE:
Swing Trade
Long EURUSD
Entry Point - 1.1627
Stop Loss - 1.1586
Take Profit - 1.1711
Our Risk - 1%
Start protection of your profits from lower levels
Disclosure: I am part of Trade Nation's Influencer program and receive a monthly fee for using their TradingView charts in my analysis.
❤️ Please, support our work with like & comment! ❤️
USDEUR trade ideas
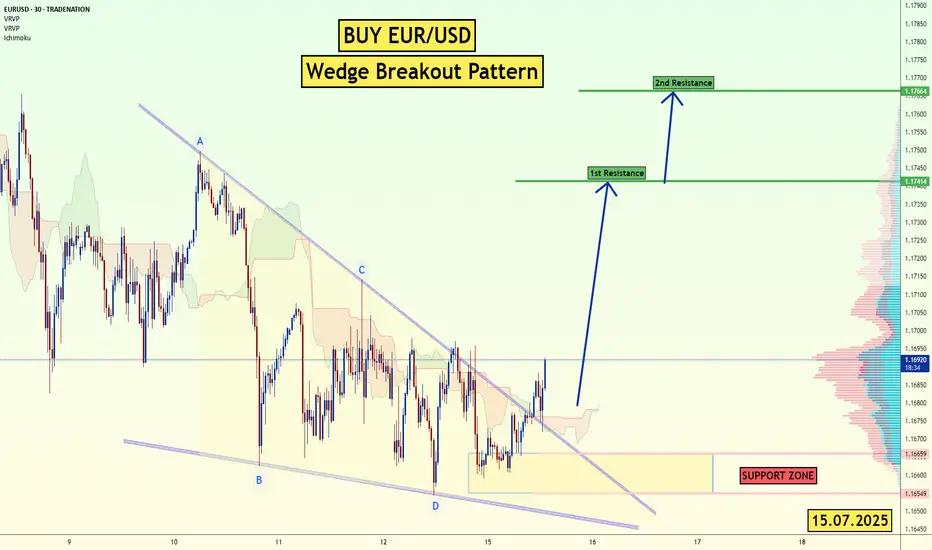
EUR/USD - Wedge Breakout (CPI- Today) 15.07.2025 The EUR/USD pair on the M30 timeframe presents a Potential Buying Opportunity due to a recent Formation of a Wedge Breakout Pattern. This suggests a shift in momentum towards the upside and a higher likelihood of further advances in the coming hours.
Possible Long Trade:
Entry: Consider Entering A Long Position around Trendline Of The Pattern.
Target Levels:
1st Resistance – 1.1741
2nd Resistance – 1.1766
🎁 Please hit the like button and
🎁 Leave a comment to support for My Post !
Your likes and comments are incredibly motivating and will encourage me to share more analysis with you.
Best Regards, KABHI_TA_TRADING
Thank you.
Disclosure: I am part of Trade Nation's Influencer program and receive a monthly fee for using their TradingView charts in my analysis.
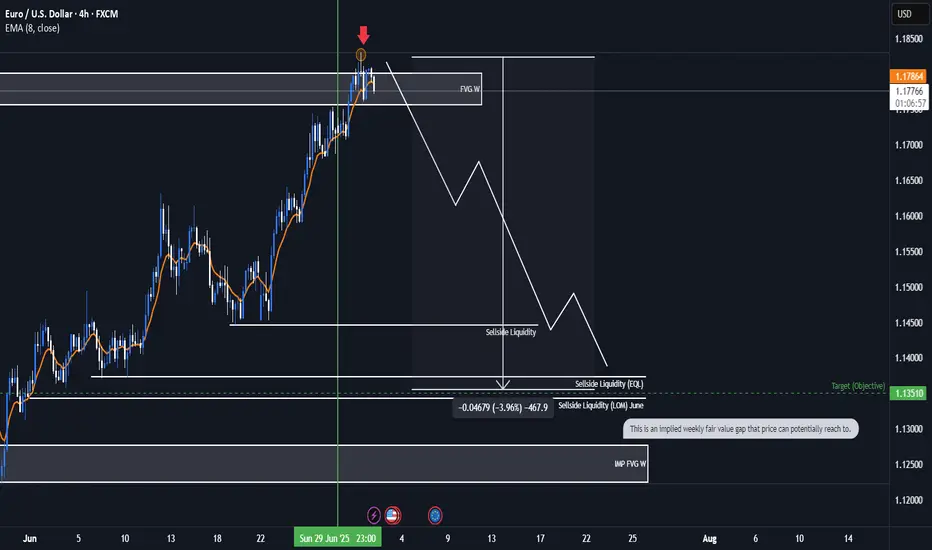
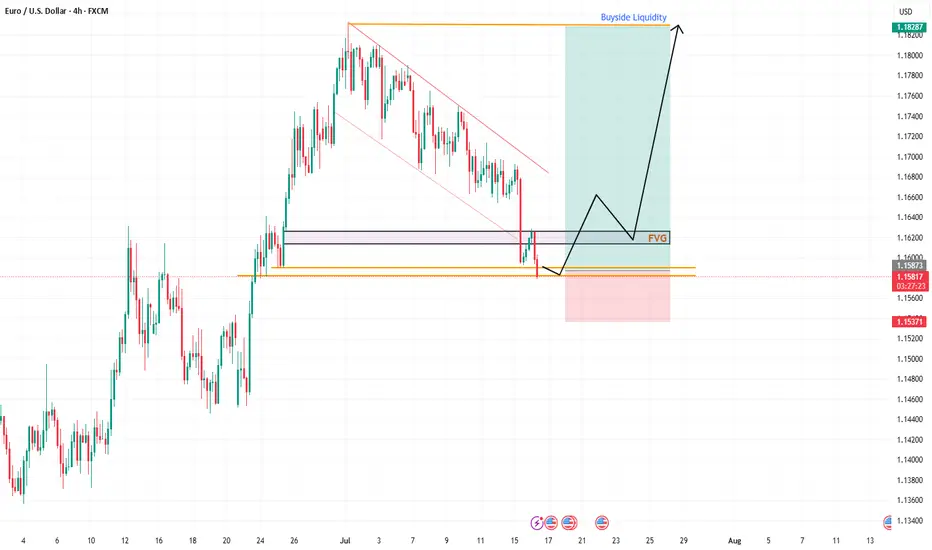
EURUSD Bearish ideaWe are in a weekly fair value gap that we have balance and potentially collected orders to prepare for a potential drop in price. We are anticipating a quarterly shift for the month of July were we could be targeting downside liquidity that is in open float.
* Fundamentals:
-Interest rate differentials shows us that USD interest rate of 4.5 is higher than the interest rate EUR 2.15 which lead to the longer fundamental frame work of price correcting to the higher dollar rate to the euro.
-The COT report also indicates to us that there is huge buying of Dollar by the commercials and a huge amount of selling of the EUR by commercials which can lead us to assume potential weaker dollar.
*Targeting:
-We are looking for the low of last month (June) to be taken out as well as even potentially reaching to the implied weekly fair value gap.
EURUSD Under Pressure After Hot CPI – More Downside Ahead?Today, the US released key inflation figures :
Core CPI m/m: 0.2% (vs 0.3% forecast)
CPI m/m: 0.3% (as expected)
CPI y/y: 2.7% (vs 2.6% forecast, up from 2.4%)
Fundamental Analysis ( EURUSD ):
The slightly lower Core CPI suggests some easing in underlying inflation pressures. However, the headline CPI y/y came in hotter than expected at 2.7%, reinforcing the idea that the Fed is not yet ready to ease policy aggressively.
This combination supports the US dollar, as sticky inflation could delay rate cuts.
EURUSD is likely to remain under pressure in the short term unless the ECB signals a more hawkish stance or US data starts showing broader weakness.
Now let's move on to the technical analysis of EURUSD ( FX:EURUSD ) on the 4-hour timeframe .
EURUSD is trading in a Heavy Resistance zone($1.1802-$1.1602) , having simultaneously managed to break the Support lines and the lower line of the Descending Channel , and is also trying to break the Support zone($1.1642-$1.1578) .
I expect EURUSD to continue its downtrend and decline to the Support zone($1.1549-$1.1520) at the first target .
Second target : $1.15043
Third target : $1.1464
Note: Stop Loss(SL)= $1.1660
Please respect each other's ideas and express them politely if you agree or disagree.
Euro/U.S. Dollar Analyze (EURUSD), 1-hour time frame.
Be sure to follow the updated ideas.
Do not forget to put a Stop loss for your positions (For every position you want to open).
Please follow your strategy and updates; this is just my Idea, and I will gladly see your ideas in this post.
Please do not forget the ✅' like '✅ button 🙏😊 & Share it with your friends; thanks, and Trade safe.

EURUSD will continue to growIt is clear that EUR has broken through the support line, but I don't think the fall will continue. I expect growth to 1.19

EUR/USD Bearish Reversal Confirmed – Smart Money Distribution Ne📅 Posted July 18, 2025 | 🔍 VolanX Protocol Insight
📉 Market Outlook:
The EUR/USD pair has rejected the premium supply zone (1.17–1.18) after failing to maintain structure above the red trendline. Price is now breaking down with bearish pressure building toward equilibrium at 1.09544.
📊 VolanX DSS Breakdown:
🔴 Premium Rejection confirms distribution by institutional players.
📈 Trendline Violation + SMC BOS = Shift to markdown phase.
🧠 VolanX Signal Score: Neutral → Bearish
→ Favoring short plays targeting deeper liquidity blocks.
🌐 Macro Narrative (Q3 2025):
🇺🇸 USD Strength: Driven by sticky inflation and delayed Fed cuts (Q4 expected).
🇪🇺 Eurozone Softness: Germany's PMI fell below 50; ECB’s cautious tone continues.
🏦 Rate Divergence Play: US-EU real yield gap widening → capital flowing into USD.
🎯 Probabilistic Target Path (Yellow Line):
✅ 1.1500: First liquidity gap
✅ 1.1150: Midblock retrace
🎯 1.09544: Equilibrium & High-Confidence Institutional Re-entry Zone
🛡️ VolanX Protocol Note:
This forecast is part of the WaverVanir Smart Futures Playbook. All trades are structured with AI-defined probability zones, institutional positioning layers, and macro-event syncing. The VolanX engine will reassess upon retest of the 1.1500 mid-zone.
#EURUSD #Forex #SmartMoney #MacroFX #VolanX #WaverVanir #LiquidityZones #InstitutionalTrading #TechnicalAnalysis #ForexSignals #DXY #Eurozone #FED #ECB #OptionsFlow

#012: LONG Investment Opportunity on EUR/USD
In this scenario, I placed a passive long order on EUR/USD at a key zone that has shown signs of accumulation and institutional defense in recent days.
The price showed bearish manipulation followed by a sharp rebound with a V-shaped pattern, often indicative of stop-loss hunting. In these phases, a direct entry is less effective than a passive strategy aimed at intercepting a possible technical pullback in the zone where abnormal volumes and algorithmic defenses have manifested.
The order was designed to be activated only if the market were to temporarily return to the previously absorbed zone, thus avoiding chasing the price after a directional candlestick.
The stop-loss placement was carefully chosen to avoid both typical retail hunting zones and areas visible to algorithms. It is positioned to ensure operational invisibility, but also consistency with the logic of institutional defense: if reached, the trade will be automatically invalidated.
The target is aligned with the superior technical structure and the normal range of movement that develops when this dynamic is respected.
This operation is designed to be left to operate completely autonomously, without the need for adjustments or active management. Either in or out. The sole objective is to align with institutional flows, with controlled risk and a favorable management structure.

EU's Wild Drop: A Sneaky Trap or Reversal Time?Hey Fellow Traders! 😎
What a ride yesterday, right? The EUR/USD took a massive plunge, smashing through the descending channel like a wrecking ball and sweeping up all that liquidity. 💥 But hold up—was that just a clever market manipulation to shake out the bulls? I think so! 🧠
Right now, the price is chilling in a Daily Fair Value Gap (FVG), and I’m expecting some serious action here. This could be the perfect setup for a reversal! The market makers pulled a fast one—tricking bullish traders into flipping bearish after that dramatic drop. But guess what? That’s the trap! 🕸️ Don’t fall for it.
I’m eyeing a long entry right at this level. Here’s the plan:
Entry: Right now—let’s catch this wave! 🌊
Stop Loss: Set it tight around 1.15360 to keep risk in check.
Take Profit: Aiming for those juicy highs (check the chart I shared in my last post for the exact levels). 📈
This setup is screaming opportunity, so let’s talk about it! 💬 What’s your take—are we reversing or is the market still playing games? Drop your thoughts below, smash that Like button if you’re with me, and Follow for more trade ideas! 🚀 Let’s keep the community buzzing. 🐝
#Trading #EURUSD #MarketAnalysis #ReversalSetup
Bearish Breakdown on EUR/USD: Support Flip and Short SetupThis EUR/USD 1-hour chart shows a bearish setup after price breaks below a rising support trendline. A potential short trade is indicated, with a stop loss at 1.16453 and a target at 1.15779. The highlighted green zone marks a key support-turned-resistance area.

EURUSD H1 I Bullish Bounce Off Based on the H1 chart analysis, the price is falling toward our buy entry level at 1.1667 a pullback support that aligns with the 50% Fib retracement.
Our take profit is set at 1.1706, a swing high resistance.
The stop loss is placed at 1.1642, a pullback support.
High Risk Investment Warning
Trading Forex/CFDs on margin carries a high level of risk and may not be suitable for all investors. Leverage can work against you.
Stratos Markets Limited (tradu.com ):
CFDs are complex instruments and come with a high risk of losing money rapidly due to leverage. 66% of retail investor accounts lose money when trading CFDs with this provider. You should consider whether you understand how CFDs work and whether you can afford to take the high risk of losing your money.
Stratos Europe Ltd (tradu.com ):
CFDs are complex instruments and come with a high risk of losing money rapidly due to leverage. 66% of retail investor accounts lose money when trading CFDs with this provider. You should consider whether you understand how CFDs work and whether you can afford to take the high risk of losing your money.
Stratos Global LLC (tradu.com ):
Losses can exceed deposits.
Please be advised that the information presented on TradingView is provided to Tradu (‘Company’, ‘we’) by a third-party provider (‘TFA Global Pte Ltd’). Please be reminded that you are solely responsible for the trading decisions on your account. There is a very high degree of risk involved in trading. Any information and/or content is intended entirely for research, educational and informational purposes only and does not constitute investment or consultation advice or investment strategy. The information is not tailored to the investment needs of any specific person and therefore does not involve a consideration of any of the investment objectives, financial situation or needs of any viewer that may receive it. Kindly also note that past performance is not a reliable indicator of future results. Actual results may differ materially from those anticipated in forward-looking or past performance statements. We assume no liability as to the accuracy or completeness of any of the information and/or content provided herein and the Company cannot be held responsible for any omission, mistake nor for any loss or damage including without limitation to any loss of profit which may arise from reliance on any information supplied by TFA Global Pte Ltd.
The speaker(s) is neither an employee, agent nor representative of Tradu and is therefore acting independently. The opinions given are their own, constitute general market commentary, and do not constitute the opinion or advice of Tradu or any form of personal or investment advice. Tradu neither endorses nor guarantees offerings of third-party speakers, nor is Tradu responsible for the content, veracity or opinions of third-party speakers, presenters or participants.

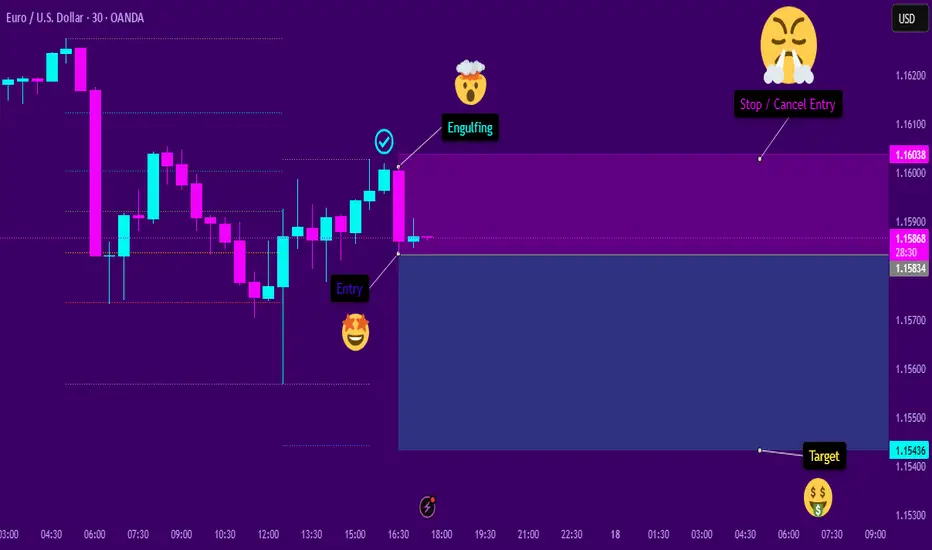
Engulfing SellThe asset shows signs of continuation in a downtrend. After a significant retracement at a favorable Fibonacci level, a bearish engulfing pattern appeared. This engulfing pattern resulted in a behavioral shift, causing the temporary pullback to resume its decline. I believe this will be the case, provided that the subsequent candlesticks confirm the entry signal.
ATM_GS : We are nearing...
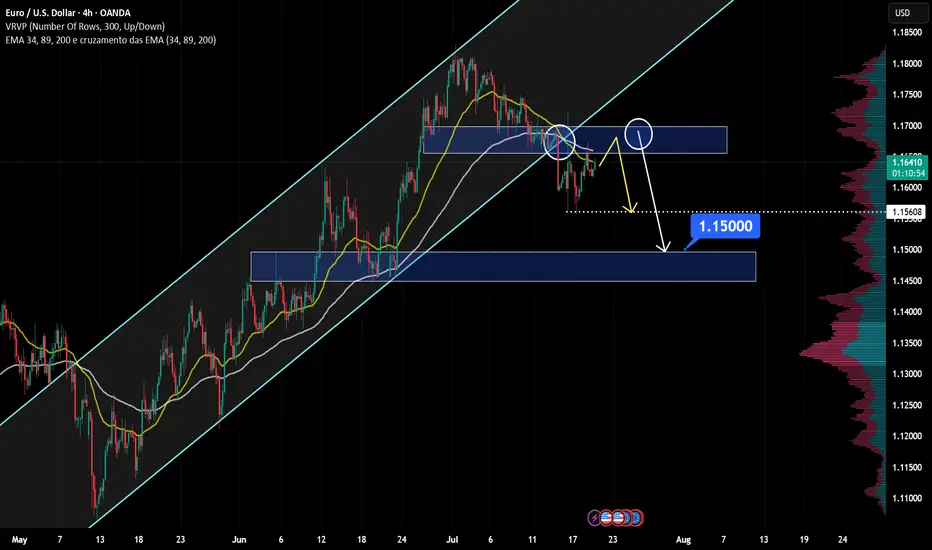
EUR/USD at Resistance – Will Sellers Push Price Down to 1.15000?Hello fellow traders! What’s your take on EUR/USD?
From Brian’s personal perspective:
This currency pair is approaching a key resistance zone, which previously acted as a strong support level. This area aligns with historical price reactions and could serve as a solid foundation for potential bearish movements.
If sellers confirm their presence through bearish price action, I anticipate the price could move toward 1.15000. However, a clear break above this resistance level may signal the possibility of further bullish continuation.
Let me know your thoughts or any additional insights you might have!
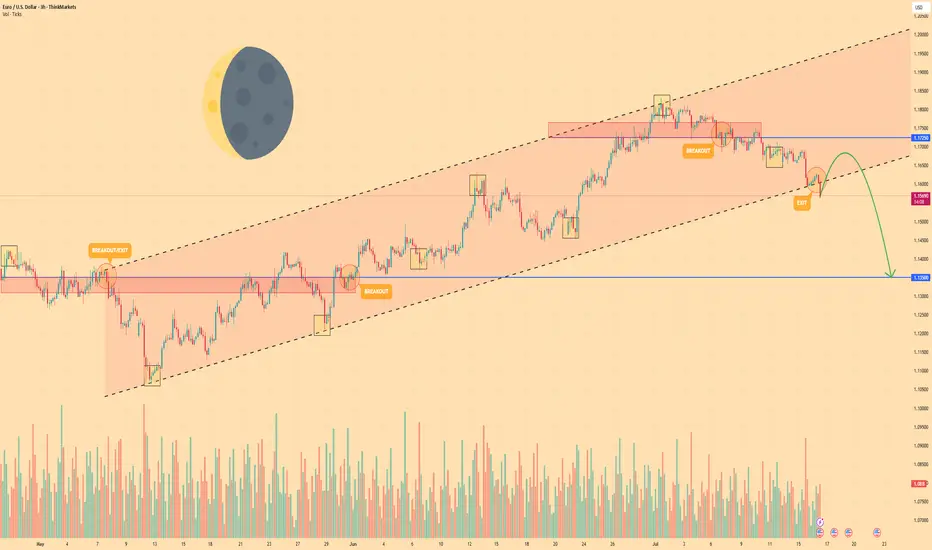
EURO - Price may drop to $1.1350 support level Hi guys, this is my overview for EURUSD, feel free to check it and write your feedback in comments👊
Euro began its journey by breaking into a rising channel off the swing low near $1.1080, establishing a clear uptrend.
Within this channel, price carved out steady support along the lower trendline, touching $1.1350 before buyers stepped.
Mid-channel, two breakout attempts at $1.1550 and $1.1725 highlighted bullish conviction, yet both retreated back below resistance.
Simultaneously, two exit signals appeared near the upper trendline around $1.1765, showing that upward momentum was losing steam at key inflection points.
Currently, EUR is holding just below the channel base after a minor bounce, consolidating as traders weigh the next move.
I foresee a brief climb toward near $1.1670 before a renewed bearish thrust drives price back down to test $1.1350 level.
If this post is useful to you, you can support me with like/boost and advice in comments❤️
Disclaimer: As part of ThinkMarkets’ Influencer Program, I am sponsored to share and publish their charts in my analysis.
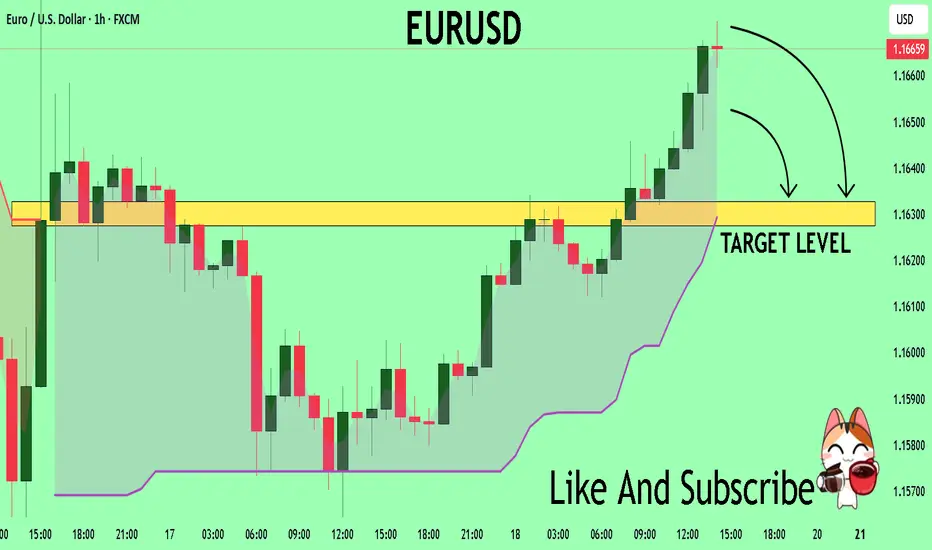
EURUSD: Bulls Will Push
Balance of buyers and sellers on the EURUSD pair, that is best felt when all the timeframes are analyzed properly is shifting in favor of the buyers, therefore is it only natural that we go long on the pair.
Disclosure: I am part of Trade Nation's Influencer program and receive a monthly fee for using their TradingView charts in my analysis.
❤️ Please, support our work with like & comment! ❤️
EURusd short position 18/07/2025English : According to our analysis, we anticipate a bearish scenario.
Morocan Darija : kanchofo d'apres l'analyse dyalna antsanaw hboot
ATENTION : I only share my ideas, not signals

Eurousd techinical analysis.Eurousd techinical analysis next move posibale at h1 time frame.not finchinal advice.

EURUSD Will Collapse! SELL!
My dear subscribers,
This is my opinion on the EURUSD next move:
The instrument tests an important psychological level 1.1663
Bias - Bearish
Technical Indicators: Supper Trend gives a precise Bearish signal, while Pivot Point HL predicts price changes and potential reversals in the market.
Target - 1.1632
About Used Indicators:
On the subsequent day, trading above the pivot point is thought to indicate ongoing bullish sentiment, while trading below the pivot point indicates bearish sentiment.
Disclosure: I am part of Trade Nation's Influencer program and receive a monthly fee for using their TradingView charts in my analysis.
———————————
WISH YOU ALL LUCK
CHECK EURUSD SIGNAL READ CAPTAIN📍 Trade Setup Overview
Trade Direction: Short (sell)
Entry Point: Around 1.16600 1.16530
Stop Loss: Around 1.16900
🎯 Target Levels
Take Profit 1:
1.16250
Take Profit 2:
1.15800
Last Target:
1.15500

Eurusd is bullishSince there is a clear retest at the daily support which was previously resistance now we will look for buys only on EU up to the next round number level
EURUSD TRADE IDEA EURUSD pulled back for a trade to the upside.
We got involved on the trade at our Fibonacci level and we seem to be powering to the upside.
Let's see how the market does it's thing.

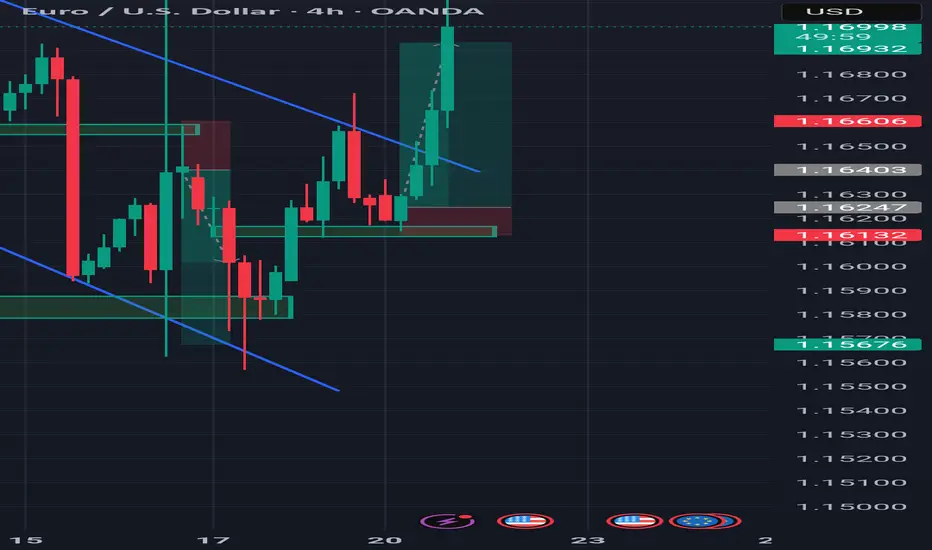
EURUSD Forecast – Smart Money Setup 21st July 2025Here’s the detailed breakdown of my current EURUSD setup based on internal/external liquidity and order block reaction:
🔹 Bias: Bullish (after deeper retracement)
🧠 Breakdown:
Liquidity Sweep ✅
A clear liquidity sweep took place below recent equal lows.
This sweep triggered a bullish displacement, confirming demand.
Market Structure Shift (MSS) 🔁
A valid MSS followed the sweep, confirming short-term reversal in structure.
4H Internal Liquidity 🫧
Price tapped into internal liquidity, setting the stage for a deeper retracement before continuation.
15 Min Order Block (OB) 🧱
Price is currently trading within a 15-minute OB zone, which aligns with minor resistance before a deeper retrace.
🔻 Anticipated Retracement:
Expecting a short-term rejection from the current OB zone.
Price may retrace into the 4H OB zone near 1.1590–1.1610, aligning with an upcoming 4H liquidity pool.
This zone also aligns with previous mitigation and accumulation areas.
🟢 Final Target:
If the 4H OB holds, I'm anticipating a bullish continuation targeting the external 4H liquidity near 1.1730+.
📌 Summary:
Waiting for retracement into demand zone → looking to long from 1.1590–1.1610 area → targeting 1.1730+.
✍️ Execution Plan:
Set alerts near 1.1610
Look for LTF CHoCH or BOS confirmation in demand
Enter with tight stop loss below 4H OB
Target external liquidity


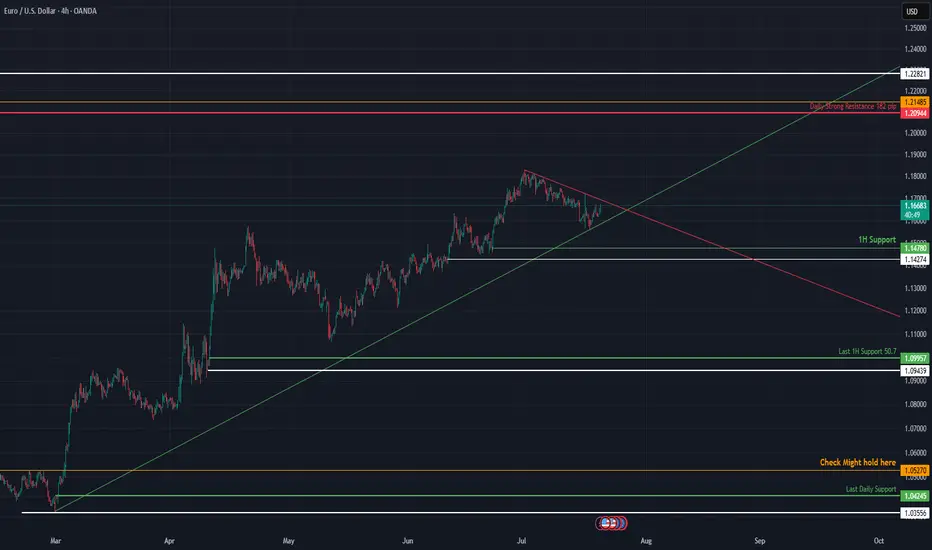
EURUSD Approaches Key Technical Breakout Point📈 EURUSD at a Critical Decision Point Between Two Trends
EURUSD is coiling between descending resistance and ascending support. A breakout from either direction will likely define the next leg of the move. This post breaks down the converging structure, high-probability levels, and what traders should watch to stay on the right side of the market.
🔍 Technical Analysis:
Price action is trapped between a downward sloping trendline (resistance) and a rising trendline (support), forming a symmetrical triangle. This compression indicates growing tension — and whichever trendline breaks first could dictate market direction in the coming weeks.
Currently, EURUSD is hovering near 1.1670, testing short-term structure while holding above prior swing supports.
🛡️ Support Zones (if downside breakout occurs):
🟢 1.1670 – 1H Support (High Risk)
First response zone on minor pullbacks.
Stop-loss: Below 1.1620
🟡 1.1470 – 1.1427 – Medium-Term Support (Medium Risk)
Confluence of diagonal and horizontal structure. Swing entry potential.
Stop-loss: Below 1.1380
🟠 1.0799 – Last 1H Support (Low Risk)
If the ascending trendline fails, this is the final zone to preserve a bullish structure.
Stop-loss: Below 1.0740
🔻 1.0242 – 1.0195 – Last Daily Support (Extreme Risk)
Loss of this zone marks a macro bearish shift.
🔼 Resistance Zones (if upside breakout occurs):
🔴 1.2094 – 1.2148: Daily Strong Resistance
Key breakout level. Strong historical supply. Clean close above here signals trend continuation.
Conclusion
EURUSD is at a technical fork — squeezed between opposing trendlines. The first decisive break will likely set the tone for Q3. Watch 1.2148 on the upside and 1.1427 on the downside for direction confirmation.
Not financial advice. Like & follow for more structured FX insights.