Strong sell eurusdWeekly and monthly overbought pair
Daily buy trend almost break
Straight selling expected till our weekly sell target , now no chances for buyers
USDEUR trade ideas

Buying opportunities on EURUSDYesterday, EURUSD saw a sharp spike after reports that Trump might fire the Federal Reserve Chair.
Although this wasn’t confirmed, the news triggered short-term volatility before the market settled down again.
At the moment, EURUSD is reacting to key support levels. Watch for the formation of a higher low and potential signs of a new bullish move.
The goal remains a breakout above the previous high and continuation of the main uptrend.

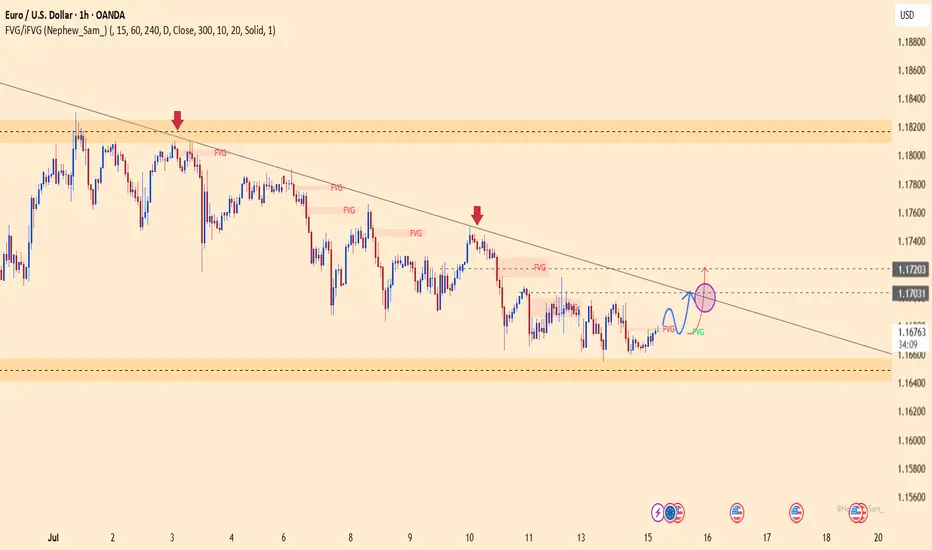
EURUSD – Weakness emerges at descending channel resistanceEURUSD remains within a well-defined descending channel and was recently rejected at the upper trendline – a key dynamic resistance zone. Price action shows the recovery is limited around 1.16600, with multiple FVG (Fair Value Gap) zones reinforcing the potential for further downside.
On the news front, the euro remains under pressure as Eurozone inflation data brought no surprises, while the US dollar is supported by June’s PPI rising exactly as expected at 0.2%. This combination leaves EURUSD with little momentum to break higher, making a move back toward the 1.15300 support area a scenario to watch.
If the price fails to break above 1.16600 and forms a lower high, the bearish trend will be further confirmed. Keep an eye on price behavior around the FVG zones to identify optimal entry points.

EURUSD TRADE IDEA UPDATE We had a pullback on EURUSD. Although we didn't get a full pullback to our Fibonacci level and the market seems to have taken off to the upside.
Let's see how the market unfolds
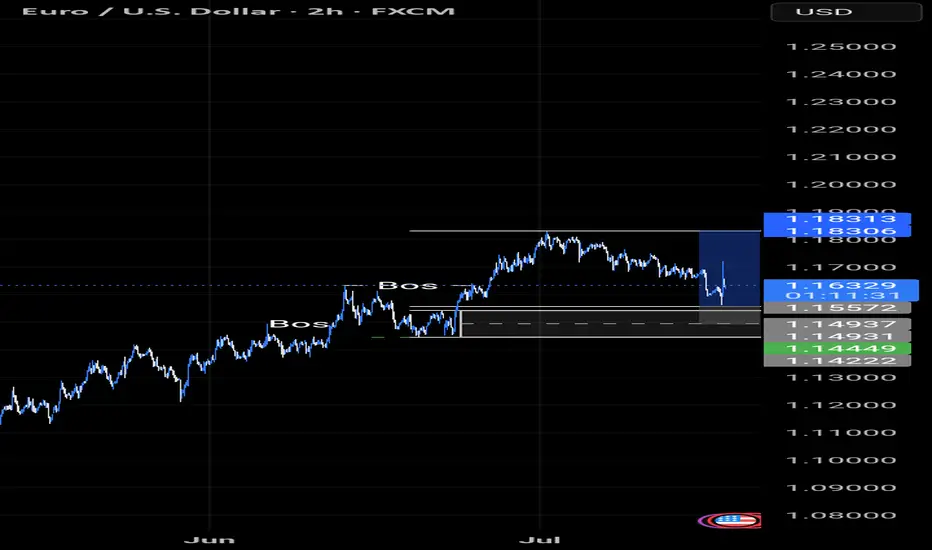
Bearish Momentum Builds Below Broken Support
Hello everybody!
Price is in a strong bearish trend and has broken a support area, which we now expect to act as resistance.
The break of the upward trendline adds a second confirmation to take a short position.
The target is around 1.14990.
The stop loss is placed beyond the downward trendline and will be trailed along with it.
If the downward trendline is broken, the short position will be invalidated.

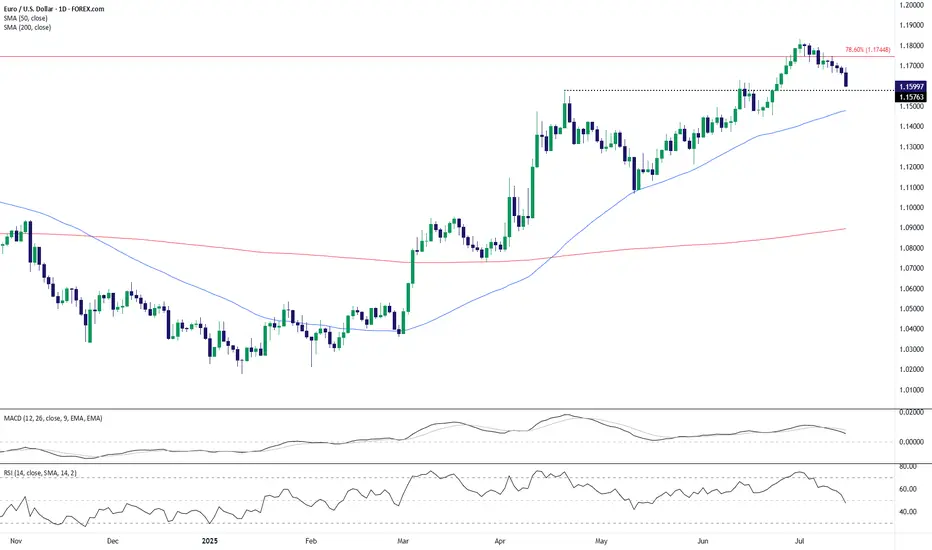
EUR/USD Technical Outlook: Bearish Momentum Builds Below Key ResEUR/USD has broken down from its recent highs near the 1.1750 resistance area, which coincides with the 78.6% Fibonacci retracement level. The pair is now trading around the 1.1600 handle, slipping below a short-term support zone near 1.1576. This breakdown signals potential continuation of bearish pressure in the coming sessions.
The 50-day SMA (1.1477) remains upward sloping, but the price action has now decisively turned lower, with a series of lower highs forming after the July peak. The MACD histogram is fading, indicating waning bullish momentum, and the RSI has dropped to 47.7—losing the bullish bias and heading toward bearish territory.
If EUR/USD cannot reclaim the 1.1576–1.1600 zone quickly, a deeper pullback toward the 50-day SMA or even the 1.1450–1.1500 range may unfold. On the upside, bulls would need to push back above the 1.1750 resistance to regain control, but given the loss of momentum and structure, the near-term bias favors the bears.
-MW
sell idea on EURUSDI LIKE THIS 4HR SETUP. eurusd is pushing in bearish mode as the dxy is correcting up.. I feel like we can reach these two targets if we can break below this next consolidation
two targets as the second target would be good place to exit hitting that next strong area of support
Price action Eurusd has made lower low now price gone back to sweep liquidity another chance to lower

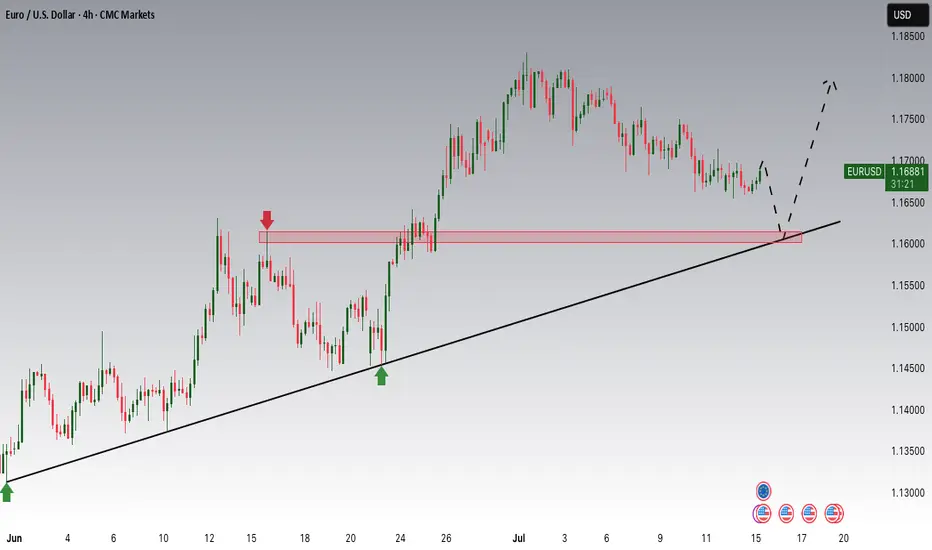
Euro/U.S. Dollar (EUR/USD) 4-Hour Chart - OANDA4-hour performance of the EUR/USD currency pair. The chart shows a recent upward trend peaking around 1.16241, followed by a sharp decline to approximately 1.15452. Key levels include a high of 1.17245 and a support level around 1.16478, with a highlighted area indicating a potential consolidation or reversal zone.

EURUSD ALERTPrice starts ranging
No clear breakout yet — we're staying patient and waiting for a cleaner entry signal.
#EURUSD #Forex #PriceAction #Trading

Sell eurusdStrong selling wave comes
Monthly weekly still overbought pair
Respecting our parallel channel and 1st selling area
Now daily strong buy trend breaks giving hints for sellers

EURusd short position 16/07/2025English : According to our analysis, we anticipate a bearish scenario.
Morocan Darija : kanchofo d'apres l'analyse dyalna antsanaw hboot
ATENTION : I only share my ideas, not signals

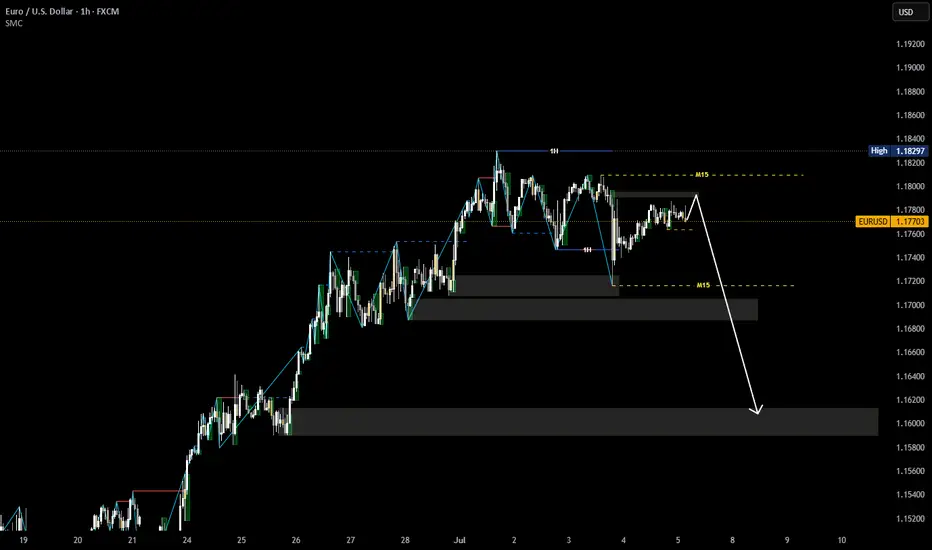
EURUSD structure analysis on M15 and H1- 4H swing is bullish, currently is pullback
- 1H, M15 swing is bearish, current is pullback.
- We can look for selling opportunities according to the wave configuration of H1 and M15 timeframes
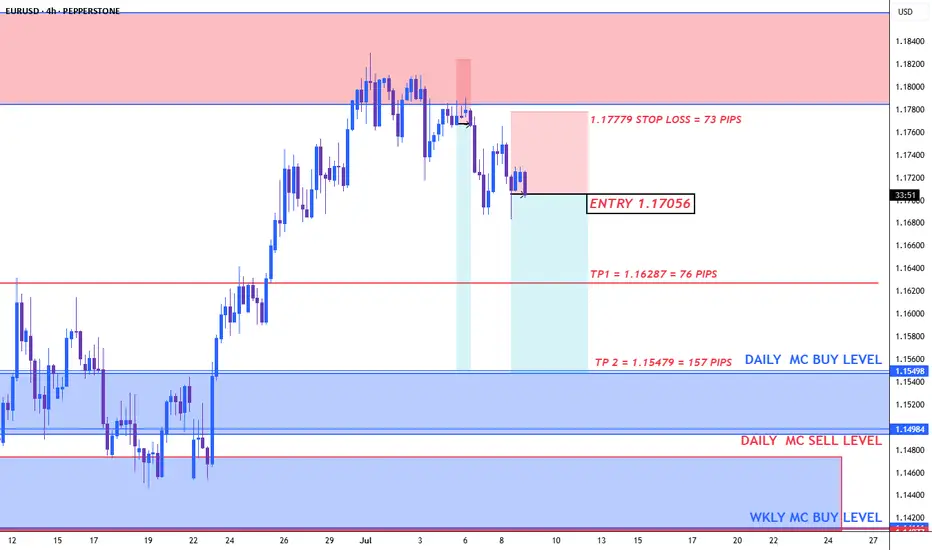
EURUSD could see further downside potentialFundamental:
The euro slipped as mixed ECB signals and political jitters pressured sentiment. ECB President Lagarde reiterated that borrowing costs will remain restrictive 'as long as needed,' even as inflation eases and economic activity stabilizes.
Renewed political tensions in France and soft German industrial data also weighed on the euro, though stronger services PMIs offered a modest offset. At the same time, the dollar held firm after a hotter US CPI print reduced the likelihood of near-term Fed rate cuts, keeping EURUSD near a three-week low.
Technical:
EURUSD retreated below the resistance at 1.1800 and within the ascending channel. If the price extends its decline, it could approach the support at 1.1450. Conversely, a break above the resistance at 1.1800 could prompt a further rise toward the resistance at 1.1920.
By Li Xing Gan, Financial Markets Strategist Consultant to Exness

EURUSD Will Go Down! Short!
Take a look at our analysis for EURUSD.
Time Frame: 15m
Current Trend: Bearish
Sentiment: Overbought (based on 7-period RSI)
Forecast: Bearish
The market is testing a major horizontal structure 1.161.
Taking into consideration the structure & trend analysis, I believe that the market will reach 1.159 level soon.
P.S
Please, note that an oversold/overbought condition can last for a long time, and therefore being oversold/overbought doesn't mean a price rally will come soon, or at all.
Disclosure: I am part of Trade Nation's Influencer program and receive a monthly fee for using their TradingView charts in my analysis.
Like and subscribe and comment my ideas if you enjoy them!

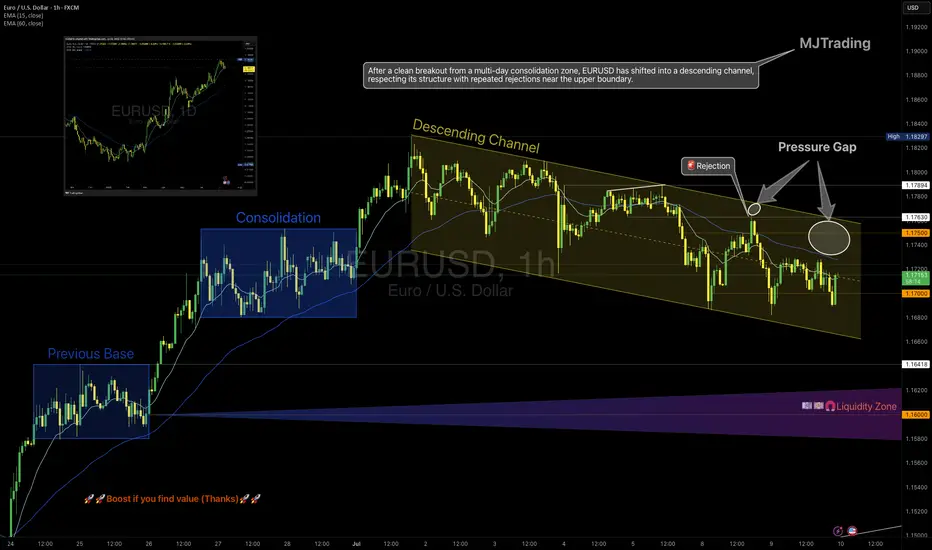
EURUSD – From Structure to Shift
1H Technical Outlook by MJTrading
EURUSD moved cleanly through a sequence of structural phases:
• Previous Base
• Multi-day Consolidation (potential quiet accumulation)
• Transition into a well-respected Descending Channel
Price has since shown repeated rejections from the upper boundary, including a decisive selloff from the 1.1750 zone, forming what we now label a "Pressure Gap" — a space where aggressive sellers overwhelmed price.
🧭 Key Scenarios Ahead:
🔻 Bearish Continuation:
Breakdown below 1.1700 opens room toward:
• 1.1640 (channel bottom)
• 1.1600 Liquidity Zone
Watch for impulsive sell candles + EMA rejection
🔁 Short-Term Bounce or Trap:
Holding above 1.1700 could spark a rebound toward 1.1750
This may serve as a final test before another leg lower
Only a clean break and hold above 1.1763 flips structure bullish
🔍 Bonus Confluence:
1D Chart shows broader bullish context (inset)
EMAs tightening = expect volatility burst
Well-defined structure gives clear invalidation and targets
Every trend tells a story — from base building to breakout, and now a possible breakdown. Trade the structure, not the prediction.
#EURUSD #Forex #TradingView #TechnicalAnalysis #PriceAction #DescendingChannel #LiquidityZone #SmartMoney #MJTrading
EURUSD: Consolidation Phase Nearing the Main Trend!!Hey Traders, in today's trading session we are monitoring EURUSD for a buying opportunity around 1.16100 zone, EURUSD is trading in an uptrend and currently is in a correction phase in which it is approaching the trend at 1.16100 support and resistance area.
Trade safe, Joe.
CONTINUATION OF BEARISH TREND EUR/USD continuaring bearish, just going up to the the imbalance created yesterday during CPI, we expect it to hit the horizontal line as shown in the image, we expect a redistribution then another short entry, a the US dollar index gains strength

EURUSD correction continuesYesterday, EURUSD reached 1,1590 following key news releases.
This doesn’t change the overall market direction or the type of setups we’re looking for.
The next key support level is at 1,1536.
Keep an eye out for a bounce and potential entry signals around that area.

EURUSD H1 I Bullish Rise Based on the H1 chart analysis, the price is approaching our buy entry level at 1.1603, a pullback support.
Our take profit is set at 1.1641, a pullback resistance that aligns with the 50% Fib retracement.
The stop loss is placed at 1.1579, an overlap support.
High Risk Investment Warning
Trading Forex/CFDs on margin carries a high level of risk and may not be suitable for all investors. Leverage can work against you.
Stratos Markets Limited (tradu.com ):
CFDs are complex instruments and come with a high risk of losing money rapidly due to leverage. 63% of retail investor accounts lose money when trading CFDs with this provider. You should consider whether you understand how CFDs work and whether you can afford to take the high risk of losing your money.
Stratos Europe Ltd (tradu.com ):
CFDs are complex instruments and come with a high risk of losing money rapidly due to leverage. 63% of retail investor accounts lose money when trading CFDs with this provider. You should consider whether you understand how CFDs work and whether you can afford to take the high risk of losing your money.
Stratos Global LLC (tradu.com ):
Losses can exceed deposits.
Please be advised that the information presented on TradingView is provided to Tradu (‘Company’, ‘we’) by a third-party provider (‘TFA Global Pte Ltd’). Please be reminded that you are solely responsible for the trading decisions on your account. There is a very high degree of risk involved in trading. Any information and/or content is intended entirely for research, educational and informational purposes only and does not constitute investment or consultation advice or investment strategy. The information is not tailored to the investment needs of any specific person and therefore does not involve a consideration of any of the investment objectives, financial situation or needs of any viewer that may receive it. Kindly also note that past performance is not a reliable indicator of future results. Actual results may differ materially from those anticipated in forward-looking or past performance statements. We assume no liability as to the accuracy or completeness of any of the information and/or content provided herein and the Company cannot be held responsible for any omission, mistake nor for any loss or damage including without limitation to any loss of profit which may arise from reliance on any information supplied by TFA Global Pte Ltd.
The speaker(s) is neither an employee, agent nor representative of Tradu and is therefore acting independently. The opinions given are their own, constitute general market commentary, and do not constitute the opinion or advice of Tradu or any form of personal or investment advice. Tradu neither endorses nor guarantees offerings of third-party speakers, nor is Tradu responsible for the content, veracity or opinions of third-party speakers, presenters or participants.

EURUSD – Bullish Momentum ReturnsEURUSD is gradually breaking free from downward pressure as it breaches the short-term accumulation structure, aiming for the resistance zone around 1.1720. On the chart, a clear bullish trend is emerging, supported by FVG signals reinforcing the recovery.
On the news front, expectations are rising that the European Central Bank will maintain a tighter policy stance for longer, as core inflation in the Eurozone remains elevated. Meanwhile, the USD is under corrective pressure following last week’s lower-than-expected U.S. CPI data. Upcoming statements from ECB and Fed officials today will be key in determining the next move for this currency pair.
Unless a surprise arises from the U.S. side, EURUSD is likely to sustain its short-term upward momentum and test the next technical resistance area.
EUR/USD long: Save the dateHello traders
I have entered into a long position at 1.1665.
The charts show a base being built right around that level.
DXY is ticking down but US 10Y yield is steady.
Bitcoin at an all time high is in my opinion not a sign of risk on but rather USD liquidation in favor of BTC.
Gold has just broken above the last daily high.
There are rumors making the rounds that FOMC Powell is considering resigning which will be negative for the USD. Keep in mind, Jerome Powell is the spokesperson for the FOMC, not the only voting member.
7/30/2025
FOMC rate decision
7/31/2025
The Federal Appeals Court starts hearing arguments for the use of IEEPA to impose sweeping tariffs that was declared unlawful by the Court of International Trade located in Manhattan, NY.
August 2025
More threatened tariffs may start.
Things are heating up.
Best of luck.

EURUSD Potentially BearishHi there,
EURUSD appears bearish at H1 and needs to break the dashed green trend line for a price target of 1.16511 for a bias of 1.16373.
Happy Trading
Not trading advice.
