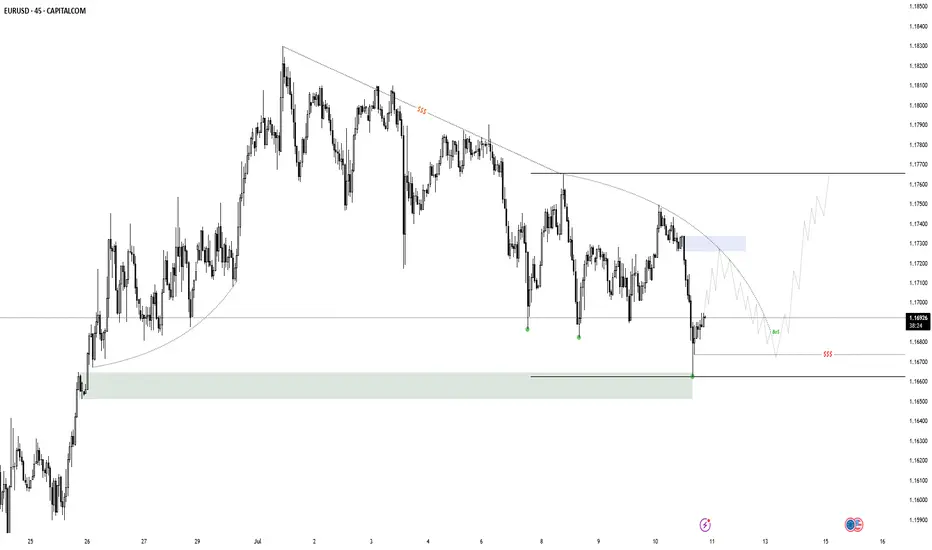
EURUSD TRADE IDEA Eurusd is pulling back, but we're yet to be tapped into the trade. We wait for a pullback into our fib level for a continuation to the upside
USDEUR trade ideas

EURUSD is Bearish After Breaking Regression ChannelHello Traders
In This Chart EURUSD HOURLY Forex Forecast By FOREX PLANET
today EURUSD analysis 👆
🟢This Chart includes_ (EURUSD market update)
🟢What is The Next Opportunity on EURUSD Market
🟢how to Enter to the Valid Entry With Assurance Profit
This CHART is For Trader's that Want to Improve Their Technical Analysis Skills and Their Trading By Understanding How To Analyze The Market Using Multiple Timeframes and Understanding The Bigger Picture on the Charts

EUR/USD Fibonacci Resistance - Rising Wedge BreakEUR/USD came into Q3 with a full head of steam, setting a fresh three-year high on the first day of the new quarter. But bulls couldn't make much progress after that and a key Fibonacci retracement continued to hold buyers at bay, until eventually sellers were able to take-over and make a more noticeable dent after this morning's CPI data.
The breakout in USD helped to prod a breakdown in EUR/USD, and bears now have an open door to run a short-term trend. There's now resistance potential at prior support of 1.1631 and 1.1663, and there's deeper support potential at 1.1543 and 1.1457. - js

EURUSD📉 EURUSD – 30min Short Plan
📊 Structure: LLs & LHs forming – bearish trend confirmed
🕯️ Pattern: Bearish Engulfing at Lower High
🎯 Entry: instant
📌 Trade 1
– 🎯 TP1: 1:1
– ⚠️ Risk: 1%
📌 Trade 2
– 🎯 TP2: larger reward
🛠️ Execution:
– Place both trades at same entry
– Trail SL after TP1 hit
📎 Bias: Bearish

EUR/USD Daily OB Analysis – ICT-Based SetupEUR/USD Daily OB Analysis – ICT-Based Setup
This is a clean ICT-style analysis of EUR/USD on the Daily timeframe.
A Daily Bullish Order Block (OB) has been identified in the Discount zone.
The OB ranges between two psychological levels:
1.15500 – Mid Figure
1.15000 – Big Figure (key liquidity level)
The market is currently approaching this OB, and the region is well aligned with the principles of PD Arrays (Premium/Discount Arrays) from ICT methodology.
The OB is considered valid as price action broke market structure (BOS) after the OB was formed, confirming institutional interest at that level.
We are now watching for potential bullish confirmation signals (MSS, SMT divergence, or bullish FVGs) on lower timeframes like H1 or M5 as price taps into the OB zone.
This setup offers a high-probability long opportunity, especially if price reacts from the 1.15000 big figure level with bullish price action.

EURUSD AccumulationI am looking for some accumulation here. The model can already be complete, but i would only take it if it extends into a model 2 from extreme liquidity to create more liquidity for a reversal. The supply above, followed by the strong sell off lowers the quality of this model. A supply mitigation with a slow pullback into the POI would change that.
EUR_USD BEARISH BREAKOUT|SHORT|
✅EUR_USD was trading along
The rising support line but
Now we are seeing a strong bearish
Breakout and the breakout is
Confirmed so we are bearish
Biased and we will be expecting
A further bearish move down
After the potential pullback
SHORT🔥
✅Like and subscribe to never miss a new idea!✅
Disclosure: I am part of Trade Nation's Influencer program and receive a monthly fee for using their TradingView charts in my analysis.

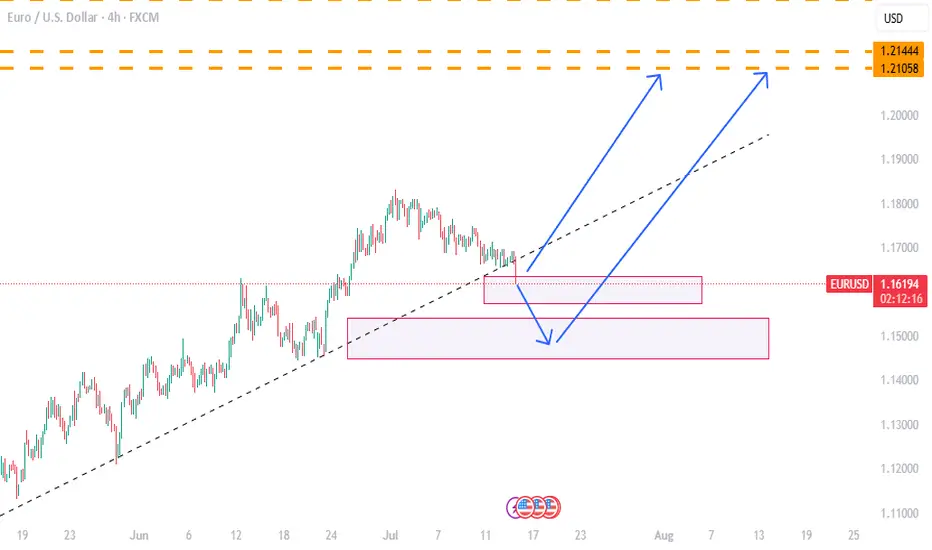
EURUSD Bullish Momentum EUR/USD is expected to resume its bullish trend after a brief consolidation. The market is likely to gain bullish momentum from the 1.17007 – 1.17507 support zone, potentially targeting the 1.20285 level in the next upward move

Lingrid | EURUSD Pulled Back to Key Support levelFX:EURUSD is approaching a major confluence zone at 1.16422 where the downward channel meets the upward trendline and horizontal support. The structure remains bullish with a sequence of higher highs and higher lows, and the current pullback fits within a healthy correction phase. A strong bounce from this triple-support region could trigger a reversal toward 1.18320, validating the continuation of the broader uptrend. All eyes are now on the 1.16450 reaction point for early momentum signs.
📉 Key Levels
Buy trigger: bullish reaction from 1.16422 support zone
Buy zone: 1.16200–1.16500 (channel base + trendline + demand)
Target: 1.18320
Invalidation: confirmed 4H close below 1.1600 breaks upward structure
💡 Risks
Deeper push below the trendline may trap early buyers
Low liquidity during the bounce can cause fakeouts
Unexpected USD strength could stall recovery momentum
If this idea resonates with you or you have your own opinion, traders, hit the comments. I’m excited to read your thoughts!

A case for a EURUSD ShortPrice got rejected at the U-MLH.
DXY shows some strenght too:
A close below yesterdays low is a short for me.

eur/usd 07.07The information and publications are not meant to be, and do not constitute, financial, investment, trading, or other types of advice or recommendations.
Have a nice evening ahead.


analyse eurusd *The content on this analysis is subject to change at any time without notice, and is provided for the sole purpose of assisting traders to make independent investment decisions.
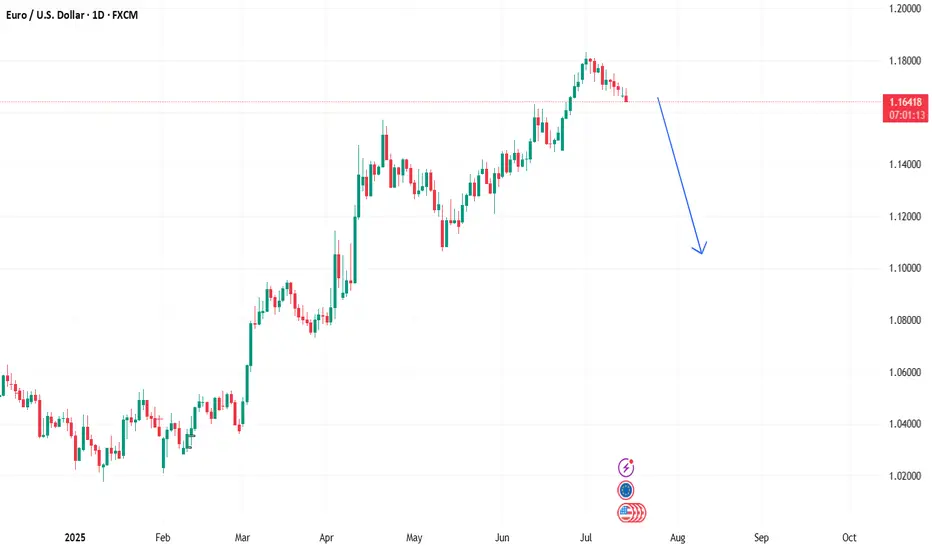
Bearsih EurUsd!The fibre has begun its downward spiral. You can look for sell set-ups from now on; every time it buys, wait and look for sells. Unless of course you can trade both sides of the market. Price is aiming for 1.1060 level.
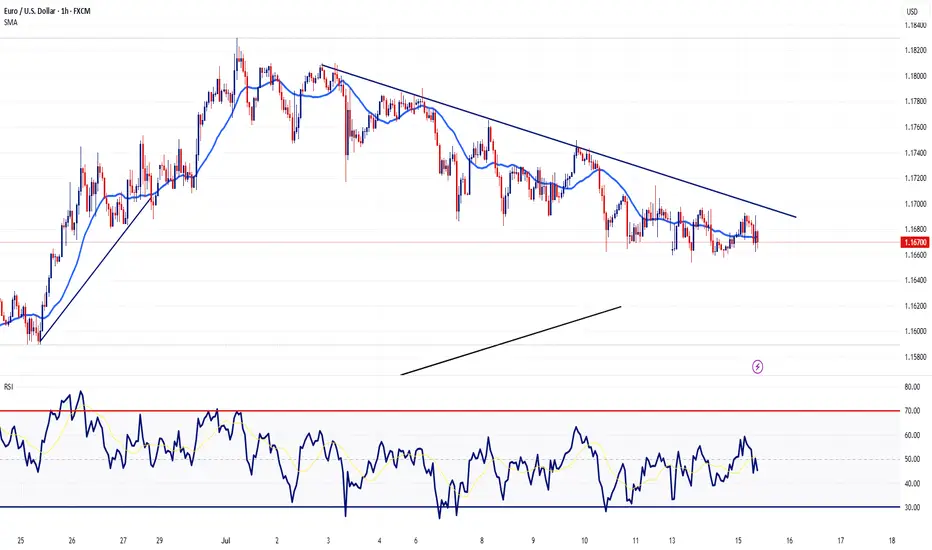
EURUSD Remains Under Pressure Following CPIThis morning, after the US CPI report was released at 8:30 AM EDT, EUR/USD surged briefly due to a slightly weaker-than-expected inflation reading. Despite this, signs of rising inflation persisted, leading EUR/USD to rise sharply before quickly retreating.
EUR/USD has seen an intermediate top at 1.1830 since early July. The euro is under pressure due to looming US tariffs (30% on EU imports, effective August 1) and mixed economic signals, like Eurozone industrial production rising 1.7% in May (vs. 0.9% expected). The pound (GBP) and other currencies are also reacting to tariff concerns.
Taking a look at the 1hour chart, you can see we are still trading below a descending trendline. Taking everything into consideration, I'm positioning short sells whenever we get bounce higher.
That's it - That's all - Trade Safe
EURUSD BUYEUR/USD retreats below 1.1550 ahead of US data
EUR/USD finds it difficult to stage a rebound following Monday's sharp decline and trades in negative territory below 1.1550 on Tuesday. The US Dollar (USD) preserves its strength ahead of consumer sentiment and employment-related data releases, weighing on the pair.
From a technical point of view, the EUR/USD pair is poised to extend its slump. It keeps falling below a mildly bearish 20 Simple Moving Average (SMA), which provides dynamic resistance at around 1.1690. The 100 SMA, in the meantime, maintains its bullish slope, albeit partially losing its upward strength at around 1.1340. Finally, technical indicators keep heading south well below their midlines, and at multi-week lows, in line with a bearish extension ahead.
The near-term picture shows EUR/USD is oversold and may bounce or consolidate before the next directional move. In the 4-hour chart, technical indicators turned flat at extreme levels, yet it keeps developing below all its moving averages, which skews the risk to the downside. A firmly bearish 20 SMA is crossing below the 100 SMA and aims to extend its slide below a directionless 200 SMA, usually a sign of prevalent selling interest.
SUPPORT 1.15566
SUPPORT 1.15819
SUPPORT 1.15566
RESISTANCE 1.15114

long position sighted on EURUSDEUR/USD – Price Approaching Key Demand Zone | 4H SMC Analysis
Pair: EUR/USD
Timeframe: 4H (4Hour)
Bias: Bullish Reversal Watch at Demand
Strategy: Smart Money Concepts (SMC)
Status: Monitoring price action at demand for possible long setup.
Market Structure Overview
The EUR/USD pair recently showed a bearish shift in structure after failing to hold the bullish trend that began mid-June.
* Initial bullish structure is visible with a clear Break of Structure (BOS) to the upside.
* The rally created a Fair Value Gap (FVG) and left behind a well-defined Demand Zone.
* After the BOS, price retraced and respected the demand before making new highs.
* Eventually, price failed to make a new high and started forming lower highs and lower lows, shifting momentum bearish.
Current Price Action
* Price has aggressively dropped from the previous supply area (highlighted in red) and is now approaching a key demand zone around 1.1485–1.1447.
* This zone coincides with:
* A previous FVG fill area.
* The base of the last strong impulsive move up.
* Consolidation and accumulation structure before the bullish breakout.
Key Zones
* Demand Zone: 1.1485 – 1.1447
* This zone represents an institutional buying area.
* Looking for potential bullish reaction from here.
* Supply Zone: Around 1.1818 – 1.1834
* Last zone of distribution before price dropped.
Possible Scenarios
Bullish Reversal
* Price shows rejection candles, internal bullish BOS, or engulfing pattern within demand.
* A long entry could be considered with:
* Stop Loss just below demand zone.
* Targets: Previous highs at 1.1726 and 1.1818.
Bearish Continuation
* If price breaks and closes below the demand, it invalidates the bullish idea.
* Expect continued bearish pressure toward 1.1400 or lower.
* Look for a potential retest of broken demand as new supply.
SMC Concepts in Use
* BOS (Break of Structure): Used to identify market shifts.
* FVG (Fair Value Gap): Spotting inefficiencies to anticipate retracements.
* Demand Zone: Watching for institutional buying and smart money footprints.
Trade Plan Summary
| Element | Value |
| Entry | Upon bullish confirmation in demand |
| Stop Loss | Below 1.1447 (zone invalidation) |
| Target 1 | 1.17265 |
| Target 2 | 1.18182 |
| Invalidated if | Price closes below demand zone |
Conclusion
We’re at a make or break level for EUR/USD. Price is testing a major demand zone with confluence from structure, FVG, and past bullish movement. Watching for reaction before taking action. Risk managed entries only.

### *EUR/USD 4H – Bearish Breakdown Scenario* *Analysis:*- Price is respecting a *descending structure* with repeated lower highs.
- Strong support is highlighted around *1.15375* — if this breaks, it confirms a bearish continuation.
- The Ichimoku Cloud remains bearish; price is below the cloud, and the cloud ahead is thick and red.
- The blue arrow on your chart suggests *further downside movement* after support breaks.
### *Trade Setup:*
- *Sell Entry:* Below *1.15375* (on strong 4H candle close)
- *Take Profit 1 (TP1):* *1.14700* (previous demand zone)
- *Take Profit 2 (TP2):* *1.14000*

EURUSD Breaks Trendline: Bearish Momentum in PlayHello guys!
After months of climbing steadily along the ascending trendline, EURUSD has finally broken below support. The trendline breach, followed by a tight consolidation (yellow circle), hinted at a loss of bullish strength, and now the breakdown is in full motion.
Broken ascending trendline
Clear rejection after retest
Bearish continuation underway
Target area: 1.1400–1.1440 zone
If sellers maintain control, the price could descend toward the next major demand area.

EUR/USD Will Continue Melting Be Sure To Be Part Of That!Here is my thought of EURUSD chart today. I think that this pair can go down further more specially after breaking this strong area of support and old resistance. as shown on the chart we can wait for the price to come back again and retest this area once and then this will be the best place to enter a sell trade. I am targeting around 250n pips in this trade. as I said I will wait for a retest and a good bearish price action and from there I will enter a sell trade.

EUR/USD ADDED TO THE WATCHLISTPrice has fallen dramatically so we are on watch for a possible reversal (maybe short term) pattern to appear. Momentum is very low and looks prime to go up. We will need a hammer candle, with an engulfing confirmation candle, strong volume and in a best case scenario strong support to come off of. We will keep watching this one.

Head & Shoulders on EUR/USD daily!We're currently observing a significant Head & Shoulders pattern forming on the EUR/USD daily chart, with the price just breaking below the neckline on the right shoulder.
Applying standard Head & Shoulders trading principles, we measure the distance from the head's peak to the neckline and project that same range downward from the breakdown point. Based on this, the estimated target price (TP) for the trade lands around $1.135. The stop-loss will be positioned just above the right shoulder to manage risk effectively.
We'll be watching closely to see how this setup unfolds. 🍻
