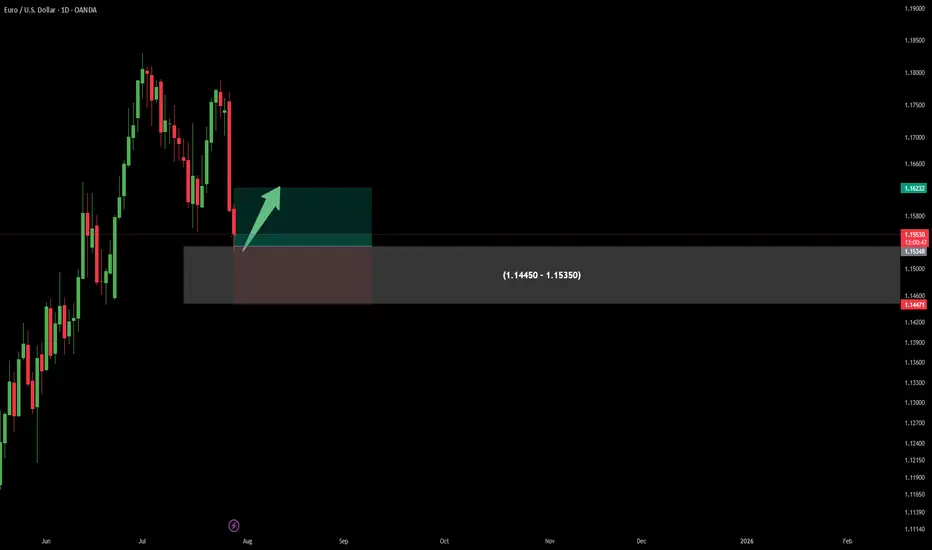
Head & Shoulders on EUR/USD daily!We're currently observing a significant Head & Shoulders pattern forming on the EUR/USD daily chart, with the price just breaking below the neckline on the right shoulder.
Applying standard Head & Shoulders trading principles, we measure the distance from the head's peak to the neckline and project that same range downward from the breakdown point. Based on this, the estimated target price (TP) for the trade lands around $1.135. The stop-loss will be positioned just above the right shoulder to manage risk effectively.
We'll be watching closely to see how this setup unfolds. 🍻
USDEUR trade ideas

EURUSDHello Traders! 👋
What are your thoughts on EURUSD?
EUR/USD kicked off the week with a sharp drop of nearly 200 pips, driven by renewed concerns over U.S. tariff policies. This strong bearish momentum signals intensified selling pressure across the board.
The pair is now approaching a support zone, which has previously triggered bullish reactions.
However, given the current strong bearish sentiment, there is a real risk this support may not hold.
Our bias remains bearish overall.
If the pair finds temporary support at this level, a short-term corrective bounce is possible.
But ultimately, we expect a continuation of the downtrend toward lower support levels after the correction completes.
Can this support zone stop the bleeding, or is more downside coming? Let us know your thoughts! 👇
Don’t forget to like and share your thoughts in the comments! ❤️

Should You Still Sell Your USD for EUR? A 2025 PerspectiveWith currency markets in constant flux, the decision to hold USD or convert to EUR carries major financial implications for investors, expatriates, businesses, and frequent travelers. As of July 29, 2025, the USD/EUR exchange rate is around 0.86–0.87, with $1 buying roughly €0.86. Is now the right time to sell your US dollars for euros? Here’s a balanced look at the latest data and forecasts.
Current Market Context: Dollar Weakness and Euro Stabilization
USD Slide in 2025: The US dollar has experienced its steepest decline in over three years, falling nearly 10% year-to-date. This sustained weakness is attributed to policy volatility, capital flowing out of the US, and narrowing interest rate differentials.
Key Exchange Rate: Recent rates hover between 0.85 and 0.87, representing moderate stability following a period of volatility.
Euro’s Resilience: While the euro has had its own struggles, from slower economic growth to political uncertainty in Germany and France, analysts forecast no major sustained fall for the euro through 2025.
2025 Forecasts: USD/EUR Direction—What Do the Experts Say?
Year-End 2025 Outlook: Major banks and forecasting firms expect the EUR/USD rate could climb even higher by year-end, meaning the euro could gain modestly versus the dollar if current trends continue.
Factors to Watch:
Fed Rate Cuts: Potential US rate cuts in Q3–Q4 remain a key driver for further USD weakness.
Trade & Tariff Uncertainty: Ongoing US tariff announcements and global trade tensions add volatility but also support safe haven flows to the dollar.
Eurozone Politics: Any resolution of political uncertainty in Europe could buoy the euro.
Most Important One: Fed's Money Printer...
Strategic Considerations: Should You Sell Now?
Locking in Current Rates: If you need euros to make payments, pay salaries, or make investments in the short term, converting a portion now could reduce your exposure to further USD downside.
If You Can Wait: Analysts see some chance for USD recovery in late Q3 or early 2026, but this is contingent on US policy stability and Fed decisions.
Averaging In: For larger transfers, consider splitting your transaction over time (also called dollar-cost averaging), which can help mitigate volatility.
Bottom Line
If you have an immediate need for euros, current rates present a reasonable opportunity. The dollar’s weakness throughout 2025 is well documented, but much of the pessimism may already be priced in. If you’re flexible with timing, monitor central bank policy signals throughout Q3/Q4, a more dovish Fed or unexpected eurozone stability could push rates further in your favor, but event risks remain elevated. Ultimately, a phased or hedged approach may offer both protection and potential upside
*not investment advice*
#forex #fx #dollar #usd #euro #eur #economy #trade #tariff #trading #indicator

Downtrend If the price can break through the support trend line, a continuation of the downtrend to the support levels is likely. Otherwise, an uptrend is possible with consolidation above the support level.

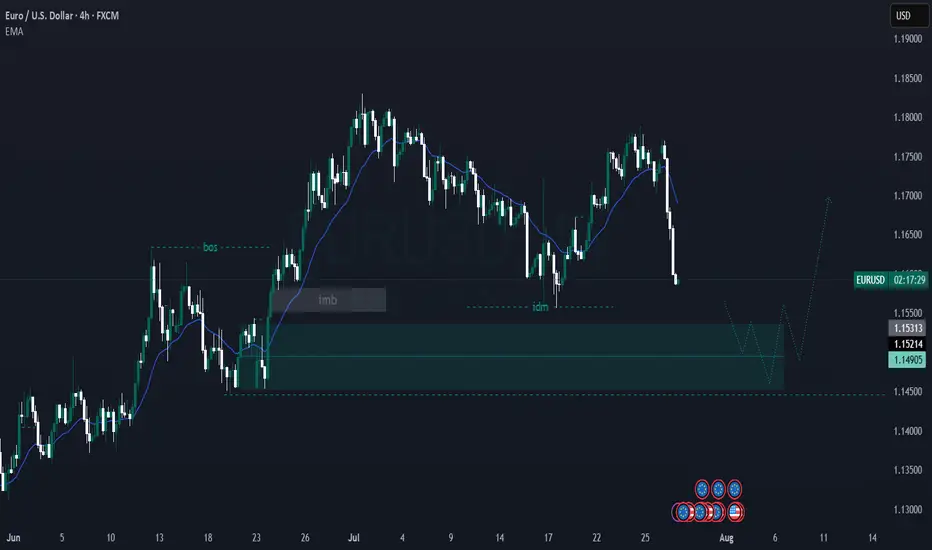
EUR/USD 30-MIN ANALYSISThis EURUSD setup showcases a clean bullish continuation scenario following a confirmed Break of Structure (BOS) and a sharp rally driven by momentum and liquidity imbalance.
After sweeping a key low (XXX), price impulsively broke structure to the upside, confirming a potential shift in market intent. A retracement is now expected to mitigate the Buy-Side Imbalance (BISI) zone.
BOS & SSS (Short-Term Structural Shift): Confirmed bullish intent.
Imbalance (BISI): Price left behind an unfilled imbalance zone a likely magnet for a pullback.
Re-Entry Zone: (BISI) provides a high probability area for long re-entry.
Upside Targets:
Target 1: 1.15483 – intermediate structural level.
Target 2: 1.16158 – premium supply / liquidity target.
#EURUSD 30M Technical Analysis Expected Move.

EURUSD – DAILY FORECAST Q3 | W31 | D29 | Y25📊 EURUSD – DAILY FORECAST
Q3 | W31 | D29 | Y25
Daily Forecast 🔍📅
Here’s a short diagnosis of the current chart setup 🧠📈
Higher time frame order blocks have been identified — these are our patient points of interest 🎯🧭.
It’s crucial to wait for a confirmed break of structure 🧱✅ before forming a directional bias.
This keeps us disciplined and aligned with what price action is truly telling us.
📈 Risk Management Protocols
🔑 Core principles:
Max 1% risk per trade
Only execute at pre-identified levels
Use alerts, not emotion
Stick to your RR plan — minimum 1:2
🧠 You’re not paid for how many trades you take, you’re paid for how well you manage risk.
🧠 Weekly FRGNT Insight
"Trade what the market gives, not what your ego wants."
Stay mechanical. Stay focused. Let the probabilities work.
FX:EURUSD

The Day AheadKey Data Releases
US:
JOLTS (June): Provides insight into labor market slack; a tighter reading could delay Fed rate cuts.
Advance Goods Trade Balance & Wholesale Inventories: Important for Q2 GDP revisions.
Consumer Confidence (July): A strong print would reflect continued consumer resilience, a weak one could pressure cyclicals.
Dallas Fed Services Activity (July): Regional business sentiment.
FHFA House Price Index (May): Monitors housing market health.
UK:
Consumer Credit & M4 (June): Key for BoE rate path.
France: Q2 total jobseekers – labor market stress indicator.
Sweden: June GDP indicator – recession risk watch.
Central Bank Focus
ECB Consumer Expectations (June): Watch for shifts in inflation expectations that could impact eurozone policy outlook.
Corporate Earnings
A major earnings deluge with over 25 high-profile companies, highlighting:
Tech/Payments: Visa, PayPal, Spotify, Electronic Arts
Consumer/Healthcare: Procter & Gamble, UnitedHealth, Starbucks, Mondelez, AstraZeneca, Merck & Co
Industrials/Travel: Boeing, UPS, Royal Caribbean, Stellantis
Luxury/Retail: Kering, L’Oreal
Financials: Barclays, Corning, Keyence
Sentiment hinges on guidance outlooks and margin commentary, particularly as investors watch for signs of consumer fatigue or pricing power erosion.
Auctions
US 2-year FRN & 7-year Notes: Will test demand amid shifting Fed expectations; weak uptake could push yields higher.
Conclusion for Today's Trading
Today is data- and earnings-heavy, setting up for potentially elevated volatility. The US JOLTS and consumer confidence data will be pivotal for shaping Fed expectations. Meanwhile, a massive cross-sector earnings lineup could lead to stock-specific dispersion, especially in tech, healthcare, and consumer sectors. Treasury auctions may steer yield curves and weigh on equity sentiment if demand is weak.
Trading Bias: Expect range-bound to choppy action in broader indices, with stock rotation driven by earnings surprises. Stay alert to macro data prints, particularly if they shift views on a September Fed move.
This communication is for informational purposes only and should not be viewed as any form of recommendation as to a particular course of action or as investment advice. It is not intended as an offer or solicitation for the purchase or sale of any financial instrument or as an official confirmation of any transaction. Opinions, estimates and assumptions expressed herein are made as of the date of this communication and are subject to change without notice. This communication has been prepared based upon information, including market prices, data and other information, believed to be reliable; however, Trade Nation does not warrant its completeness or accuracy. All market prices and market data contained in or attached to this communication are indicative and subject to change without notice.
EURUSD Buy OfferThere is a Demand area in Daily time frame which I've specified on the chart.
Can enter right now ...
Has the Bleeding STOPPED?Yesterday witnessed a great deal of unidirectional push on major USD crosses. The EURUSD was not an exception. With the DXY strengthening for the most yesterday, the ripple effect on all USD crosses was bound to happen.
We were looking at the market for the most yesterday, trying to find a potential reversal point. While it seemed unclear, we were still able to narrow our probability into a rather slim perspective and spectrum.
Looking at the market right now, i will say that our reverssal should begin to show up any time soon.
I can already see reversals on some other USD crosses.
Price on the EURUSD is currently at a critical zone. Even though not an anticipated zone, price can see some reversal in that zone.
We still wait to see clear sign and confirmation of the reversal on the EURUSD, but for now, we still keep fingers crossed
EURUSD BuyPrice did a ‘LG’ off the ‘POI’(looking left). Daily cycle not fully complete. Price should take out asia high.

EURUSD 3:1 Intraday SnipeThe H4 Doji on resistance
The downtrend on H4 H1 and M15
We are just shorting to next support
With a stop above m15 / h1 resistance nearest one - pretty solid also
3:1 Risk Reward
75%-80% odds (my rank)

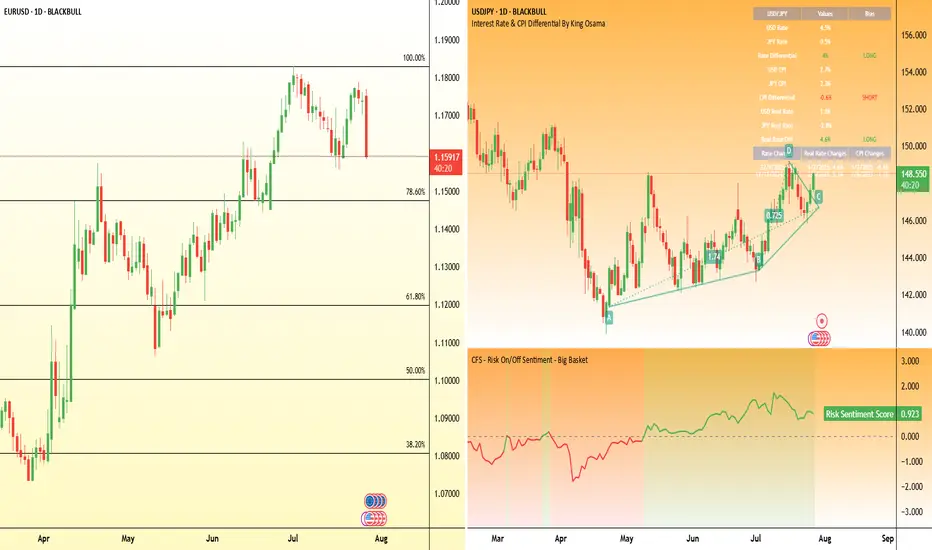
EURUSD POSSIBLE TRADE SETUP💶 Potential Trade Setup on EURUSD
Overview:
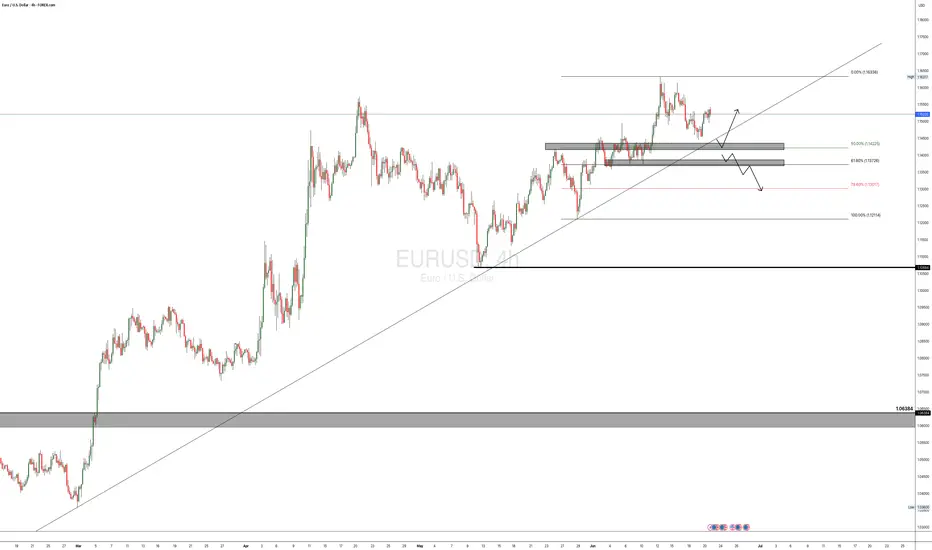
Since March, EURUSD has shown consistent bullish momentum, especially after breaking through the key 1.0600 supply zone.
The pair has maintained higher highs and higher lows, suggesting continued strength in the medium term.
That said, I am still quite anticipating for a possible continuation of the bullish momentum that started a long time ago, and moving forward, I will anticipate for a clear retest of the 50% fib at the 1.1425 region, then I go in for the kill.
Alternatively, there is a clear short opportunity, provided that, the bullish trendline is broken and the 1.1370 region is broken to the downside, this is a bit far a stretch, but it is in play. "IF" the DXY keeps the bullish momentum going.
🧭 Trading Plan:
✅ BUY Bias (Primary Plan):
Look for a retest of the 50% Fibonacci retracement zone around 1.1425. This aligns with the ongoing momentum on the 4H timeframe.
🔻 SELL Bias (Alternative Scenario):
If price breaks the bullish trendline and the 1.1370 support zone, a short opportunity opens up.
This is only valid if DXY continues to strengthen, shifting sentiment.
🎯 Targets & Risk Management: Targeting 1:2 R:R on both setups.
Ensure entries are backed by price action signals and confluences.
EUR/USD – 4H Technical Analysis AnticipatingPrice is currently in a bullish structure, printing consecutive Breaks of Structure (BOS) to the upside, confirming strong bullish momentum FX:EURUSD FX:EURUSD
On the 4H timeframe, price has:
Left behind an imbalance, signaling inefficiency in price delivery
Formed an unmitigated demand zone (internal OB) that aligns with bullish order flow
We now wait for price to return to this zone for a potential mitigation
📍 Plan of Action:
Monitor the mitigation area
Drop down to the 15-minute timeframe
Look for LTF (lower timeframe) confirmation: CHoCH, BOS, and internal structure shift before entering
Eurusd retraces1st target is low channel 1 line (1,1543).
Red line is magnet... (1,1684-92)
Oscilation between theese two lines....
Expect slow corrective pattern (>1.1610,1,16411,1692)

Countdown to Powell’s rate decision: What to watch WednesdayFederal Reserve Chair Jerome Powell is under mounting pressure from President Donald Trump to begin cutting interest rates.
Markets and analysts overwhelmingly expect the Fed to hold rates steady this Wednesday.
But what if the political heat is becoming too much to bear, and Powell and the Fed board advocate for a cut this week? Some Fed governors, Chris Waller and Michelle Bowman , have already signaled support for an early cut.
FX pairs to watch
USD/JPY:
This pair remains highly sensitive to yield differentials and broader risk sentiment. However, any hawkish resistance or emphasis on data dependency may keep the pair supported, especially if risk appetite holds.
EUR/USD:
The euro has shown relative strength in recent sessions, but the pair has been hit by the announcement of the trade deal struck between the EU and US. If the Fed clearly signals it's not ready to ease, the USD could regain even ground.
EUR-USD Support Ahead! Buy!
Hello,Traders!
EUR-USD is making a massive
Bearish correction and the pair
Is already locally oversold
So after it hits a horizontal
Support level below at 1.1568
We will be expecting a local
Bullish rebound
Buy!
Comment and subscribe to help us grow!
Check out other forecasts below too!
Disclosure: I am part of Trade Nation's Influencer program and receive a monthly fee for using their TradingView charts in my analysis.


EURUSD - Monday analysis - Tarifs EUR/USD Analysis – Market Response to US–EU Tariff Agreement
Following the agreement between the United States and the European Union to implement 15% tariffs, the DXY is strengthening, which is triggering a sharp decline on EUR/USD.
I’m focusing on a potential pullback to rejoin the move or the formation of a new structure.
Given that such strong moves often lack long-term sustainability, I’ll be watching the 1.16654 level closely — looking for a possible structure break and the beginning of a corrective phase.
Trade management will be based on the evolving price action throughout the session.
🔻 In summary: Today, I'm looking for opportunities to either join the ongoing move or enter a fresh structure that sets us up for the next leg — especially with a news-heavy week ahead.
👉 Follow me for more EUR/USD trade ideas, market updates. 💼
I share structured analysis every Monday and Wednesday to help you stay aligned with the market 🗓️📊

EURUSD TEMPORARY BUY THEN SELLBIG picture SELL
There is Temporary BUY since 15m SELL range swiped to BULL.
The BULLISH can start from 1.1736 (BUY ZONE) (I WONT BUY IF SELL ZONE TAPPED FIRST)
TP: 1.1762 (SELL ZONE)
SELL ZONE (1.1762/1.1770) After confirmation SELL.
TP: 1.1710

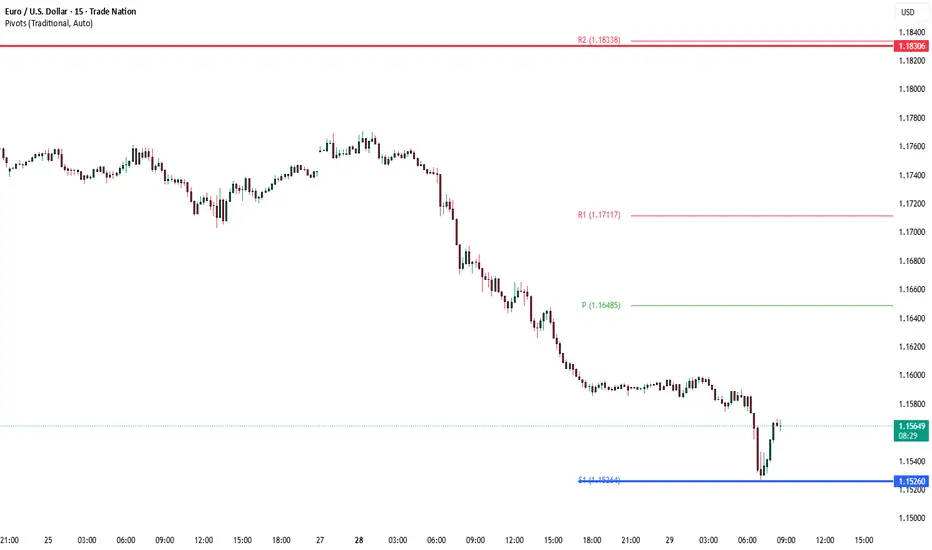
Euro takes a hit as trade deal with the US sparks a market rallyTrading this week kicked off with a trade agreement between the United States and the European Union, which pushed both the US and European indices to open in the green.
However, this development had a negative impact on the euro, which is experiencing a significant decline during today's session, Monday, July 28, 2025. Meanwhile, the US dollar is making a strong comeback, rising by 0.60% ahead of the US session open.
This recent decline has reversed the euro’s upward trend that it had maintained since the beginning of this month. The EUR/USD pair dropped again, hitting a new low below the 1.17110 level, which represents the last lower high of the bullish trend.
What is the likely upcoming scenario?
A price increase for the pair to the 1.17635 level would be considered a corrective move within the ongoing bearish trend. The negative outlook would not change unless the price records a higher high above the 1.17889 level on the 4-hour timeframe.
However, the EUR/USD is heading into an important week filled with key economic data and news, particularly from the US. This includes the US Non-Farm Payrolls set to be released on Friday, August 1, 2025, and the Federal Reserve meeting on Wednesday, July 30, 2025. The later will cover interest rate decisions and upcoming economic projections. The outcomes of these events are expected to have a direct impact on both the US dollar and the EUR/USD pair.

SHORT TRADE PLAN (LIVE REVERSAL SETUP)🔻SHORT TRADE PLAN (LIVE REVERSAL SETUP)
🔹 Entry: 1.1665
🔹 Stop Loss: 1.1800 (Brick 18 reclaim = hard invalidation)
🔹 Risk: 135 pips
🔹 Style: Macro Renko reversal — Brick 17 collapse, now short inside Brick 16
🔹 Bias: Downtrend targeting full structure rotation and fib reversion
⸻
🧠 WHY THIS SHORT?
• ❌ Bullish structure invalidated: H4 candle closed beneath 1.1700, violating Brick 17
• 🧱 Renko breakdown confirmed: Price now actively trading inside Brick 16 (1.1600–1.1700)
• 🧬 Momentum flipped: Largest bearish candle in weeks signals shift in institutional control
• 📉 No support until 1.1500–1.1400 → multiple clean Renko bricks below = high velocity window
• 🧲 Macro magnet pull: 1.1000 is full cycle reversion zone — untouched since last major fib reset
• 🔐 Longs are trapped under Fib 100 → sentiment rotated hard → fade is now the high-probability play
⸻
🎯 SHORT TARGET LADDER (100 PIP BRICKS)
TP1 — 1.1500 📉
〰️ Brick 14 confirm — early exit zone
+165 pips | R:R 1.22:1
TP2 — 1.1400 🔻
〰️ Brick 13 confirmation — structural break builds
+265 pips | R:R 1.96:1
TP3 — 1.1300 📉
〰️ D1 structural pivot — macro memory zone
+365 pips | R:R 2.70:1
TP4 — 1.1200 📉
〰️ Fib 0.0 / round number test
+465 pips | R:R 3.44:1
TP5 — 1.1100 📉
〰️ Trend extension base
+565 pips | R:R 4.18:1
TP6 — 1.1000 🧲
〰️ Full macro cycle alignment
+665 pips | R:R 4.92:1
TP7 — 1.0900 🪤
〰️ Trap zone for blowout shorts
+765 pips | R:R 5.66:1
TP8 — 1.0800 🧠
〰️ Max extension pressure
+865 pips | R:R 6.40:1
TP9 — 1.0700 🏁
〰️ Renko structure finality zone
+965 pips | R:R 7.14:1
TP10 — 1.0600 🌀
〰️ Overshoot runner — hold only 10–15%
+1065 pips | R:R 7.89:1
⸻
⚙️ EXECUTION RULES
• SL → locked at 1.1800 (only full Brick 18 reclaim = exit)
• Move SL to BE after TP2 hits
• Begin 1-brick trailing after TP3
• Book 70–80% of size by TP6
• Only hold runners beyond TP7–TP10 if Renko bricks remain unbroken
📛 Long bias is off — no reentry until Brick 17 is reclaimed on Renko
🟠 Optional new short entries on bounce into 1.1685–1.1700

EURUSD: A New Possibility On The Horizon!!Following my previous post just a few minutes ago, I’ve observed that price may retrace deeper into the 4H supply zone, which could invalidate our earlier bearish setup. This shift is due to visible signs of uncollected liquidity still resting above the current price.
If price continues its rally to the upside, we’ll shift bias and look for potential opportunities to ride the bullish move instead. Losses are part of the game, guys—but no worries, my sell entries are already secured✌️😂.
Stay sharp and stay active, traders. Let’s see how price unfolds from here. Follow for more updates. See you on the next one. ⚔️📊

EUR/USD | Moving bullish Why Is EUR/USD Always Moving?
Ever asked yourself, "Why does the Euro rise or fall against the Dollar?" 💡
It’s not magic – it’s all about money flow, news, and market mood.
📉 When traders feel unsure, they might sell the Euro.
📈 When Europe’s economy looks strong, the Euro can fly!
Right now, we’re watching some key price zones 👀:
Breakout above 1.17485 could push us to 1.18792 🚀
Drop below 1.17038 might take us lower 📉
