EUR/USD | Moving bullish Why Is EUR/USD Always Moving?
Ever asked yourself, "Why does the Euro rise or fall against the Dollar?" 💡
It’s not magic – it’s all about money flow, news, and market mood.
📉 When traders feel unsure, they might sell the Euro.
📈 When Europe’s economy looks strong, the Euro can fly!
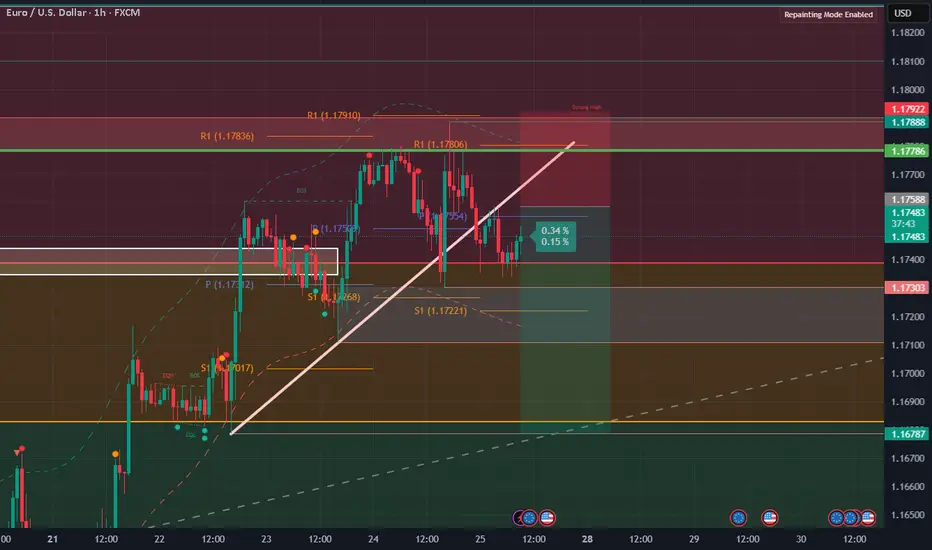
Right now, we’re watching some key price zones 👀:
Breakout above 1.17485 could push us to 1.18792 🚀
Drop below 1.17038 might take us lower 📉
USDEUR trade ideas

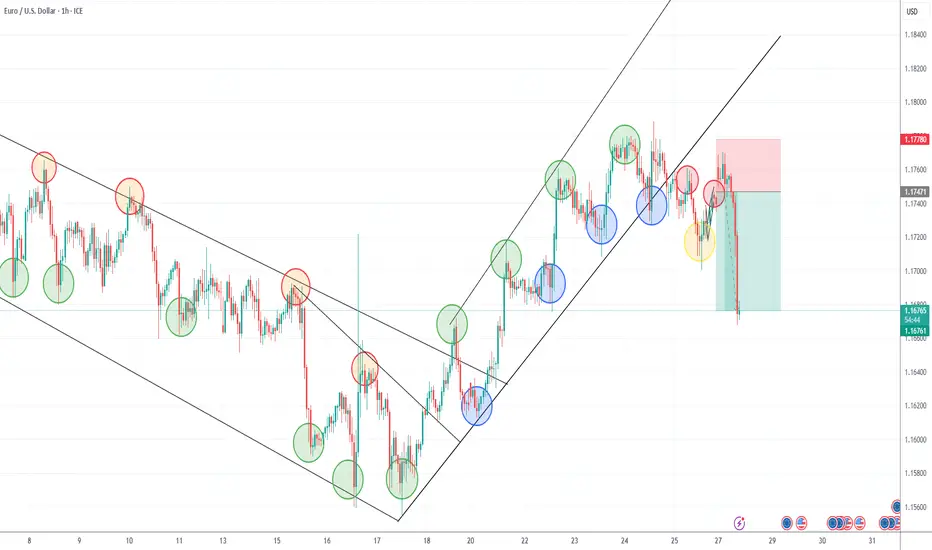
EUR/USD Channel Breakout to Trend Reversal – Clean RR SetupPrice was moving in a descending channel with clear lower highs and lower lows. After a breakout and retest, I entered long during the bullish structure shift. The uptrend held until resistance, where reversal signs appeared. I took a short position based on lower high confirmation. Trade hit TP successfully with clean price action respecting structure.
EUR USD LONG RESULT Price had formed a minor flag pattern after holding the Major Support Trendline and expected price to bounce higher at the resistance Trendline and support zone confluence, which it did.
But I extended TP higher than the supply zone, so price reversed and closed at BE.
Better Setups To Come 💪
_THE_KLASSIC_TRADER_.🔥

Not looking good for the dollarRising wedge broken on the long term chart, EUR will probably keep strengthening

EUR/USD – Testing Premium Zone, ECB & USD Macro Drive Next MoveEUR/USD – Testing Premium Zone, ECB & USD Macro Drive Next Move
EUR/USD is consolidating near 1.1770–1.1780, right inside the premium liquidity zone (0.786–0.886 Fib) and just below the Weak High at 1.1830. This level is critical for the next directional move.
Macro Landscape
ECB paused at 2.0% after eight consecutive cuts but may ease again in late 2025 as inflation trends toward 1.4% (ECB, 2025).
USD remains under pressure on expectations of Fed cuts, high fiscal deficits, and tariff concerns, creating a medium-term bias toward EUR strength (Reuters, 2025).
EU–U.S. trade deal at 15% tariff base reduces downside risks but does not fully remove growth headwinds (OECD, 2025).
Technical Outlook
Key Resistance: 1.1780–1.1830 (premium zone).
Upside Targets: 1.1905 (N) and 1.2085 (V) on breakout.
Support: 1.1680–1.1630 (Cloud/Kijun) and 1.1500 pivot for mean reversion.
VolanX DSS Signal:
Score: 58/100 (Neutral-to-Bullish)
Trend remains constructive but premium levels suggest a possible pullback unless the pair clears 1.1835 with momentum.
Plan:
Watch for a fade setup at 1.178–1.183 with stops >1.184.
A confirmed breakout above 1.1835 opens a run toward 1.19–1.21.
#EURUSD #Forex #MacroStrategy #ECB #CurrencyMarkets #TradingView
For educational purposes only. Not financial advice.

EURUSD(20250728) Today's AnalysisMarket news:
Trump announced that the US and Europe reached a trade agreement: 15% tariffs on the EU, $600 billion in investment in the US, zero tariffs on the US by EU countries, the EU will purchase US military equipment, and will purchase US energy products worth $750 billion. However, the US and Europe have different opinions on whether the 15% tariff agreement covers medicines and steel and aluminum. Von der Leyen: 15% tariff rate is the best result that the European Commission can achieve.
US Secretary of Commerce: The deadline for tariff increase on August 1 will not be extended. The United States will determine the tariff policy on chips within two weeks.
Technical analysis:
Today's buying and selling boundaries:
1.1735
Support and resistance levels:
1.1792
1.1771
1.1757
1.1712
1.1698
1.1677
Trading strategy:
If the price breaks through 1.1757, consider buying, the first target price is 1.1771
If the price breaks through 1.1735, consider selling, the first target price is 1.1712

EURUSD – Channel Forming at Trend Top?EURUSD remains bullish but is showing signs of topping out, possibly forming a downward channel. We’re eyeing a mid-channel entry near a weekly gap, looking for one more push higher before a potential reversal. Key levels could form a double top – a breakout or rejection here will be telling.

EURUSD is Ready for a Bullish MoveHello Traders
In This Chart EURUSD HOURLY Forex Forecast By FOREX PLANET
today EURUSD analysis 👆
🟢This Chart includes_ (EURUSD market update)
🟢What is The Next Opportunity on EURUSD Market
🟢how to Enter to the Valid Entry With Assurance Profit
This CHART is For Trader's that Want to Improve Their Technical Analysis Skills and Their Trading By Understanding How To Analyze The Market Using Multiple Timeframes and Understanding The Bigger Picture on the Charts

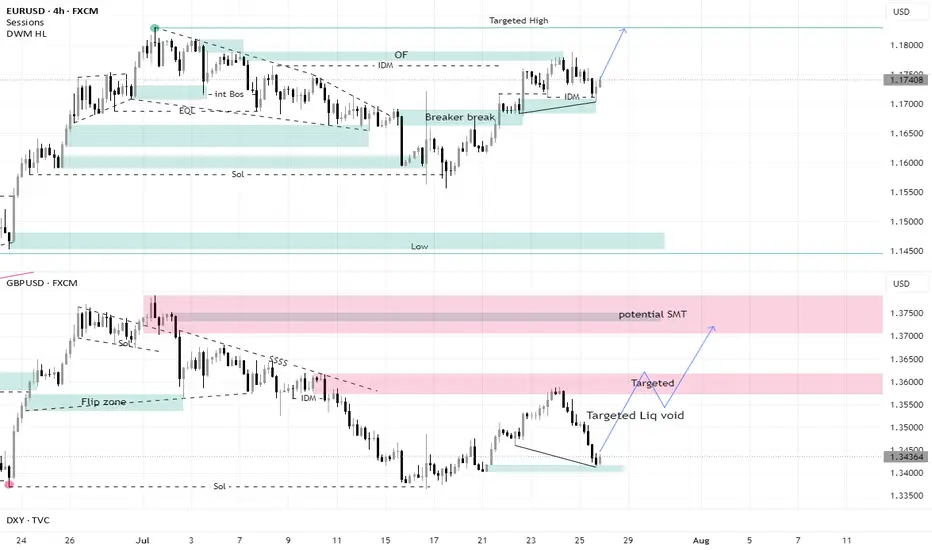
SMT in EU and GU + Targeting Liquidity voidI did not expect the GBPUSD to fall with all this force, but the EURUSD’s refusal to fall with it all these points indicates the strength of the current Low from which it rebounded, and it is expected that this bottom will hold
It is clear that GBPUSD was looking for more liquidity and that is why it dropped all these points. With this drop, it created a liquidity void that allowed it to rise and take all these pips back.
EURUSD Bullish Break of Structure after the liquidity sweepAs long as confirmation comes in the demand zone, this is a solid bullish setup.

EURUSD 1HConsidering that the one-hour timeframe trend for the EURUSD symbol has turned bullish and liquidity has been collected at the last low, after a price correction in lower timeframes and observing a suitable candlestick setup, one can enter a buy trade and follow the price at least up to 1.18310.

EURUSD BUYSEU is bullish. It has been consistently making HHs & HLs. I’d look for price to push towards the daily resistance @ 1.83000 then I’d look for price to push towards 1.19000.

Review on the 1st 3 Elite PairYou can follow us for more Analysis(Images and Videos) with Precise definition of the Financial Market.ENJOY!!!

There are more entries and ways….🧠 Smart Traders Don’t Chase… They Wait for Confluence.
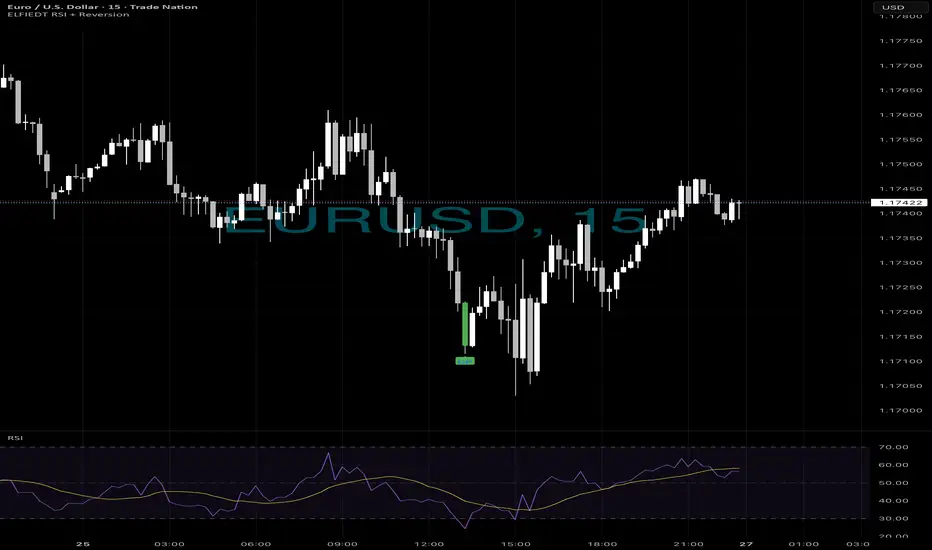
On EUR/USD, price dipped hard — but my system didn’t panic.
It waited — and when the conditions aligned, it fired the BUY.
✅ RSI + Reversion Signal printed right at the low
✅ RSI formed a classic bullish divergence
✅ Price reversed within 2 candles
✅ Textbook bounce — no guesswork
⸻
🔍 What Created the Signal?
1. Price made a lower low
2. RSI made a higher low (momentum shift)
3. Signal confirmed with an “UP” tag from ELFIEDT
4. Candle closed above reversion band = ENTRY
5. SL = just below the signal candle’s low
6. Target = 2R minimum (easily achieved)
⸻
This is what confluence looks like.
📉 Momentum shift +
📈 Reversion overshoot +
🟢 System confirmation = High-Conviction Trade
⸻
💬 DM “DIVERGENCE” if you want this tool
📲 Follow for more setups with real edge
Let the indicators do the thinking — you focus on execution.
EURUSD pullback short- 25/7/25Price failed to break through the supply zone above that was identified on the higher 4hr and 1hr TF.
The last unmitigated zone is highlighted in green and looking to take a short from there to the next low.
There is equal level liquidity below that will draw price there.
In addition the HH is just a wick giving me more confidence that there is weakness in the EUR.

NZDUSD - EURUSDHi TRADERS, while we are looking to trade NZDUSD mkt wave to the upside on the 4h chart let's not think that "it may" be the same as to EURUSD, because the DOUBLE TOP PATTERN that was formed from January 4th through May 21st 2021 and then breaks to the downside have just came to retest supply zone aera on JUNE 30th 2025, and sell off a little. And this week JULY 21st 2025, buyers push price to that same W/D supply zone that also can be called SOPPRT RESISTANCE PIVOT POINT AERAS after a long period of FOUR YEARS, for the first time . My humble opinion

EUROUSDShort Position of EuroUsd
Total 0.5% risk of my total Portfolio
All the things mention with Sl


EURUSD | Symmetrical Wedge Breakdown
TF: 15m |
🎯 Setup Insight:
The market doesn’t move in straight lines — it coils.
What you're seeing is an ABCDE corrective wedge, playing out its final phase.
Wave E completed, and liquidity is built right above.
We expect a trap in the purple premium zone (1.1740–1.1757) — then a drop toward 1.1695.
---
🧠 Strategy:
Sell Zone: 1.17410 – 1.17574
Target: 1.16958
Invalidation Above: 1.17600
Wedge ✅
Liquidity ✅
Confluence ✅
Only one move left — the snap.
---
🗝️ Notes:
The market may spike into the OB zone to trap late buyers before the real move unfolds.
The mini-diagram on the right explains it all: "Trap them high, exit them low.✓

EURUSD Is Bullish! Long!
Take a look at our analysis for EURUSD.
Time Frame: 9h
Current Trend: Bullish
Sentiment: Oversold (based on 7-period RSI)
Forecast: Bullish
The price is testing a key support 1.173.
Current market trend & oversold RSI makes me think that buyers will push the price. I will anticipate a bullish movement at least to 1.184 level.
P.S
Overbought describes a period of time where there has been a significant and consistent upward move in price over a period of time without much pullback.
Disclosure: I am part of Trade Nation's Influencer program and receive a monthly fee for using their TradingView charts in my analysis.
Like and subscribe and comment my ideas if you enjoy them!

ELLIOTT WAVE EURUSD H4 update
EW Trade Set Up H4
subminuette W4 seems finished
monitor the breakout of the descending channel that appears to contain wave IV
The bullish movement that started on July 17th must assume a 5-wave pattern
key levels (area)
1.1705
1.1684 POC
1.1654
note :
the breakout upwards of the leading span B (red line) by the lagging span (green line) will confirm the start of a bullish movement in the subminuette wave v.
Failure to break above price levels 1.1684 and 1.1705 will result in a recalculation of the waves count

EURUSD HOLDS BULLISH MOMENTUMEURUSD HOLDS BULLISH MOMENTUM📈
24 July I wrote about bearish divergence in EURUSD. Now we see that this resulted into decline towards sma200 on 30-m chart. Currently the price is rebounding from this moving average.
What is the sma200?
The sma200 is a technical indicator that calculates the average closing price of a forex pair or crypto over the past 200 trading periods. It’s used to identify long-term trends, smooth out short-term price fluctuations, and determine potential support or resistance levels.
There is high possibility that the price will continue its way towards local resistance of 1.18300.

Eurusd ShortFX:EURUSD
Yesterday there was a false breakdown of the level after which we saw a return to the range and a breakdown of the trend line, today I expect the removal of Asian hai and a trip for liquidity