EURUSD I Bullish Bounce Off Based on the H4 chart analysis, the price is falling toward our buy entry level at 1.1699, a pullback support that aligns with the 38.2% Fib retracement.
Our take profit is set at 1.1745, a pullback resistance.
The stop loss is placed at 1.1638, below the 61.8% Fib retracement.
High Risk Investment Warning
Trading Forex/CFDs on margin carries a high level of risk and may not be suitable for all investors. Leverage can work against you.
Stratos Markets Limited (tradu.com ):
CFDs are complex instruments and come with a high risk of losing money rapidly due to leverage. 63% of retail investor accounts lose money when trading CFDs with this provider. You should consider whether you understand how CFDs work and whether you can afford to take the high risk of losing your money.
Stratos Europe Ltd (tradu.com ):
CFDs are complex instruments and come with a high risk of losing money rapidly due to leverage. 63% of retail investor accounts lose money when trading CFDs with this provider. You should consider whether you understand how CFDs work and whether you can afford to take the high risk of losing your money.
Stratos Global LLC (tradu.com ):
Losses can exceed deposits.
Please be advised that the information presented on TradingView is provided to Tradu (‘Company’, ‘we’) by a third-party provider (‘TFA Global Pte Ltd’). Please be reminded that you are solely responsible for the trading decisions on your account. There is a very high degree of risk involved in trading. Any information and/or content is intended entirely for research, educational and informational purposes only and does not constitute investment or consultation advice or investment strategy. The information is not tailored to the investment needs of any specific person and therefore does not involve a consideration of any of the investment objectives, financial situation or needs of any viewer that may receive it. Kindly also note that past performance is not a reliable indicator of future results. Actual results may differ materially from those anticipated in forward-looking or past performance statements. We assume no liability as to the accuracy or completeness of any of the information and/or content provided herein and the Company cannot be held responsible for any omission, mistake nor for any loss or damage including without limitation to any loss of profit which may arise from reliance on any information supplied by TFA Global Pte Ltd.
The speaker(s) is neither an employee, agent nor representative of Tradu and is therefore acting independently. The opinions given are their own, constitute general market commentary, and do not constitute the opinion or advice of Tradu or any form of personal or investment advice. Tradu neither endorses nor guarantees offerings of third-party speakers, nor is Tradu responsible for the content, veracity or opinions of third-party speakers, presenters or participants.
USDEUR trade ideas

EURUSD Identified a more pronounced risk aversion bias Identified a more pronounced risk aversion bias in the current market after integrating news opinion, social media keyword distribution and institutional trading behavior. Recent economic data has deviated from expectations, raising concerns about global economic growth. Relevant currency pairs gradually lost the initiative in the market, and the price trend showed signs of weak oscillation or downward break.
From the viewpoint of sentiment index, investors generally turned to be cautious, and the attraction of safe-haven assets such as the dollar, yen, Swiss franc, etc. rose. This risk aversion is also confirmed on the flow side of the equation - the system recognizes that some funds have withdrawn from risky currency pairs and flowed to more liquid assets.
Combines these dynamic information to judge that the bearish trend may continue in the short term, and recommends that investors maintain a defensive mindset and lay out their strategies in a predominantly short direction.
Eurusd Tomorrow's forecastThe correction process is expected to continue tomorrow.
The yellow zone, as usual, is the separator.
I wish you success.

EUR/USDThe EUR/USD Is proving to show a weekly bearish reversal, but as you know within the weekly swing are smaller fractals that make the occasional (2H - 4H) hedge impulses. I have entered from the (1H - 2H) chart to the down side with a take profit of 1.01310 knowing that due to USA regulation I will not be able to hedge I will add lot size at the peak of every (4H) pull back

Eurusd long 6k profit live execution EUR/USD stays defensive below 1.1800 ahead of ECB decision
EUR/USD remains in a bullish consolidation mode below 1.1800 in European trading on Thursday. Traders refrain from placing fresh bets ahead of the European Central Bank policy announcements and the US preliminary PMI data. Mixed PMI data from Germany and the Eurozone failed to trigger a noticeable reaction.


EURUSD LIVE TRADE 65PIPS 5K PROFITEUR/USD stays defensive below 1.1800 ahead of ECB decision
EUR/USD remains in a bullish consolidation mode below 1.1800 in European trading on Thursday. Traders refrain from placing fresh bets ahead of the European Central Bank policy announcements and the US preliminary PMI data. Mixed PMI data from Germany and the Eurozone failed to trigger a noticeable reaction.

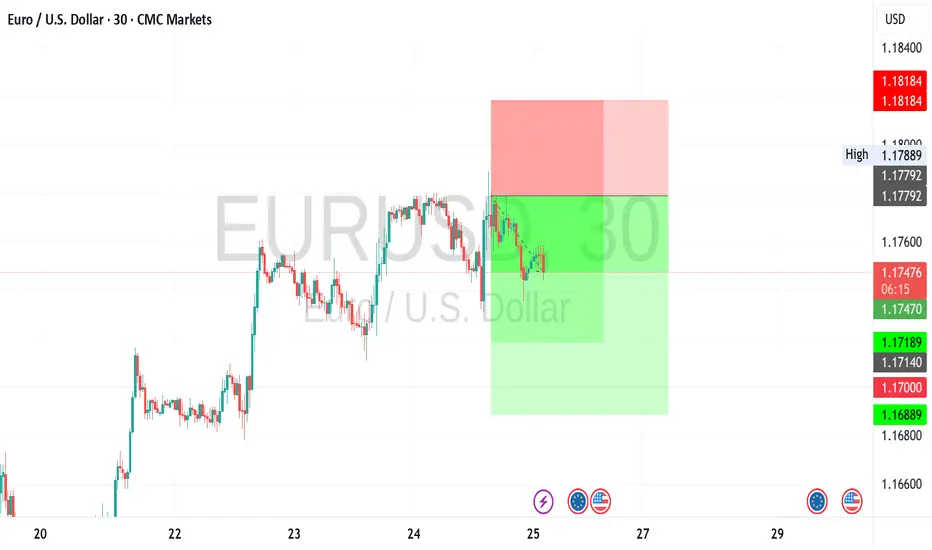
EUR/USD Analysis:🔹 Performance Overview:
The short-term trend is bullish, and price is likely to continue rising toward a key liquidity zone at 1.1829 USD.
1️⃣ Holding above 1.1780 could push the price toward testing the 1.1829 level.
2️⃣ However, a break below the 1.1715 support and stability beneath it may lead to a retest of 1.1680, followed by 1.1640.
⚠️ Disclaimer:
This analysis is not financial advice. It is recommended to monitor the markets and carefully analyze the data before making any investment decisions.

EURUSD – Trade Continuation Outlook: Technical BiasSequence Expectation:
If the current Ascend Sequence structure holds, I anticipate price extending toward or above the target zone, aligned with the directional flow.
Liquidity Magnet:
The OCZ remains a strong attraction point for buy-side flows, given its repeated gravitational pull on price.
Invalidation Criteria:
A structural breach of the Sequence Line would invalidate the bullish outlook, exposing price to the mid-range of the Ascend Sequence or potentially deeper pullbacks below.
Caution Note:
Upcoming U.S. data releases may inject volatility, likely acting as a directional driver.
Wait for clear confirmations before engaging. Trade setups must align with structure and show decisive intent.
Summary Tactical Lean:
Bullish bias stands as long as the Sequence remains intact. OCZ remains in sight. Trade cautiously, adapt to new data flow, and validate every trigger.
🔒 Disclaimer:
This content is for educational and strategic insights only. It is not financial advice. Always confirm with your personal trading plan and manage risk appropriately.

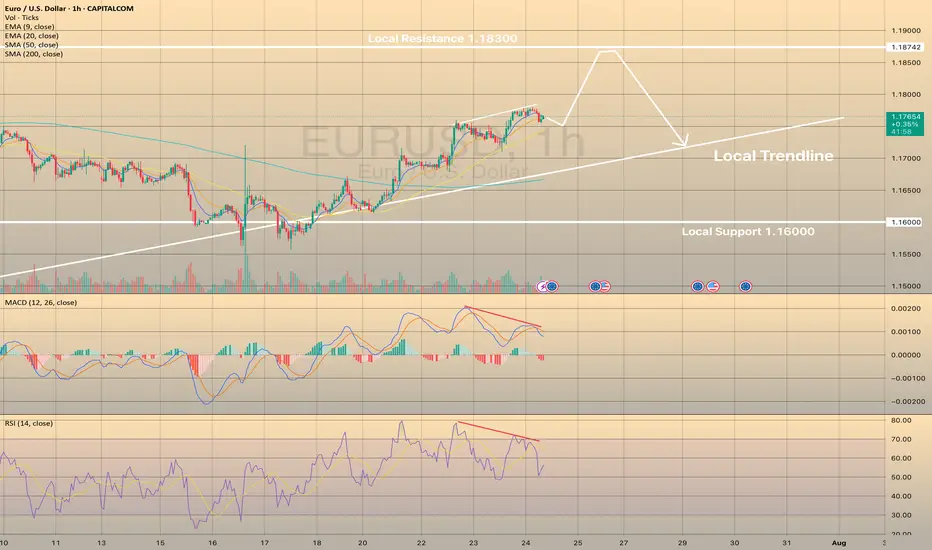
EURUSD IS ON ITS WAY TO LOCAL HIGHSEURUSD IS ON ITS WAY TO LOCAL HIGHS
EURUSD successfully rebounded from local support of 1.16000 and since then continues to rise towards local resistance of 1.18300. Recently the price has started to show the bearish divergence on RSI and Macd indicators. MACD went into the red zone.
What is the bearish divergence?
Bearish divergence is a technical analysis pattern where the price makes higher highs in an uptrend, but a momentum indicator (e.g., RSI, MACD) forms lower highs, signaling weakening bullish momentum and a potential downward reversal. To trade, identify the divergence in a clear uptrend with the indicator showing lower highs (e.g., RSI above 70). Sell or short when the price confirms a reversal (e.g., breaks below a support level or trendline) with increased volume. Set a stop-loss above the recent high. Target the next support level.
Generally speaking, it doesn't necessarily mean that EURUSD will drop immediately, the price may even grow a bit. However, it highlights some short opportunities.
$EURUSD – Thursday, July 24th OutlookYesterday: Retest of 1.17478 gave +20 pips.
Today: Watching for another retest entry.
Targets:
• TP1: 1.18002 (+80 pips)
• TP2: 1.18316 (+30 pips)
Bias remains bullish; entries focused on clean retests.

EURUSD LONG AND EDUCATIONAL BREAKDOWN ECB INTRESTRATE RELEASE The European Central Bank is expected to hold key rates for the first time in over a year on Thursday.
The Eurozone inflation rate has hit the ECB’s 2% target as the US-EU trade deal uncertainty lingers.
The EUR/USD pair could experience intense volatility following the ECB policy announcements.
The European Central Bank (ECB) is on track to leave its key interest rates unchanged after its July policy meeting, after having reduced rates at each of its last seven meetings. The decision will be announced on Thursday at 12:15 GMT.
The interest rate decision will be followed by ECB President Christine Lagarde’s press conference at 12:45 GMT.

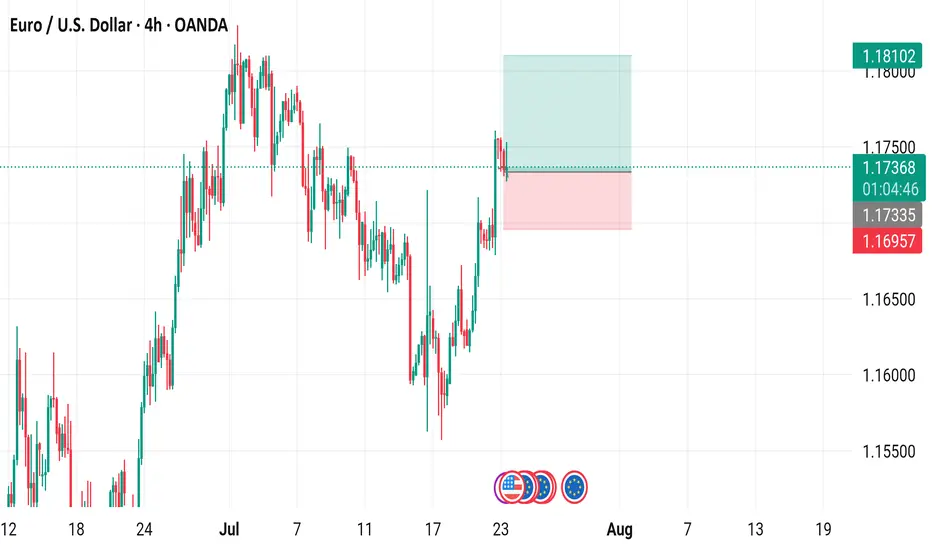
EUR/USD 4-Hour Candlestick Chart (OANDA)4-hour candlestick pattern for the Euro/US Dollar (EUR/USD) currency pair on the OANDA platform, covering the period from mid-July to mid-August 2025. The current price is 1.17358, reflecting a 0.16% decrease (-0.00186). Key levels include a sell signal at 1.17350 and a buy signal at 1.17366, with a highlighted resistance zone around 1.18102 and support near 1.16957. The chart includes technical indicators and price movements over the specified timeframe.
GOING SHORT ON EURUSD EURUSD has been in a bullish trend, forming higher highs. But now, price is sweeping a double top on the 1H timeframe, likely to clear out buy-side liquidity and unmitigated orders from the previous move. This could indicate a potential shift in market direction.

EUR/USD Lots of bull flags formed on the recent chart. Buy/Long Lots of bull flags on this chart which confirmed a move to the upside.
Waiting for a little pullback to the 20MA before considering a buy long order
Waiting to see if this small bear flag forms.
A very interesting instrument to watch at the moment. Full of various signals.

Top 3 Steps to Trading EUR/USD Long-Term✅ Top 3 Steps to Trading EUR/USD Long-Term – Rocket Booster Buy Setup 🚀
Pair: EUR/USD
Timeframe: Daily
Trade Type: Long-Term Swing / Investment
Direction: BUY
Looking for a high-confidence swing trade? EUR/USD has triggered all 3 key steps for a long-term bullish entry using the proven Rocket Booster Strategy.
Here’s the breakdown:
🔑 Step 1: Volume Oscillator – Buy Rating
Volume is trending above the zero line, showing signs of accumulation and increasing demand. This suggests smart money may be entering quietly.
🔑 Step 2: MACD – Bullish Momentum
A bullish MACD crossover above the zero line on the daily timeframe confirms that momentum has shifted in favor of the bulls. Histogram bars are expanding—classic trend continuation behavior.
🔑 Step 3: Rocket Booster Strategy – Fully Aligned
All three pillars of the strategy are locked in:
✅ Price is above the 50 EMA
✅ Price is above the 200 EMA
✅ Volume spike confirms momentum ignition
This setup shows strong potential for trend continuation on the higher timeframe.
🧠 Trade Perspective:
This is a long-term investment-grade signal, not a short-term scalp. Patience and disciplined trade management are key.
🛑 Disclaimer:
This post is for educational and informational purposes only. It does not constitute financial advice. Always do your own research and manage risk appropriately. Use a simulation trading account before you trade with real money
all in all 1.180-1.183 i think is before us.In my opinion we will be checking 3year up trend canal in few days . its only my opinion. If 1.18-1.19 broken then i think 1.2-1.25 will be open to reach. if not, then in that canal we can reach even 1.12 in the months

EUR/USD – Buy Setup Analysis (1H Chart)EUR/USD – Buy Setup Analysis (1H Chart)
📈 **Trend**: Uptrend
The pair is respecting the ascending trendline and is trading above both the EMA 7 and EMA 21, indicating bullish momentum.
**🔹 Long Setup**
* **Entry:** Around 1.1774 (current price)
* **Stop-Loss (SL):** 1.1731 (below trendline & EMAs)
* **Take-Profit (TP):** 1.1872 (based on recent swing high)
**🔎 Technical Signals**
* Price is forming higher highs and higher lows.
* Strong volume surge on bullish candles.
* EMA crossover (7 > 21) supports continuation.
**Conclusion**
As long as EUR/USD holds above the trendline and the EMAs, the bullish setup remains valid. A break below 1.1730 would invalidate this outlook.

EURUSD expected to continue the uptrend once it breaks the HHIf EURUSD pushes upwards and breaks that resistance line, we can look to enter into a LONG position.
EURUSD(20250724) Today's AnalysisMarket news:
U.S. President Trump continued to lash out at the Federal Reserve on Tuesday, but seemed to back off from the remaining plan to fire Chairman Powell. "I think he's doing a bad job, but he's going to be out of office soon anyway," Trump said in an exchange with reporters at the White House. "In eight months, he'll be out of office."
Technical analysis:
Today's buying and selling boundaries:
1.1751
Support and resistance levels:
1.1814
1.1791
1.1775
1.1726
1.1711
1.1687
Trading strategy:
If the price breaks through 1.1775, consider buying in, with the first target price at 1.1791
If the price breaks through 1.1751, consider selling in, with the first target price at 1.1726

EURUSD Solid LongH4 H1 M15 trends up
Target solid next resistance
Stop solid nearest support - behind it
1:1 RR
80% odds+


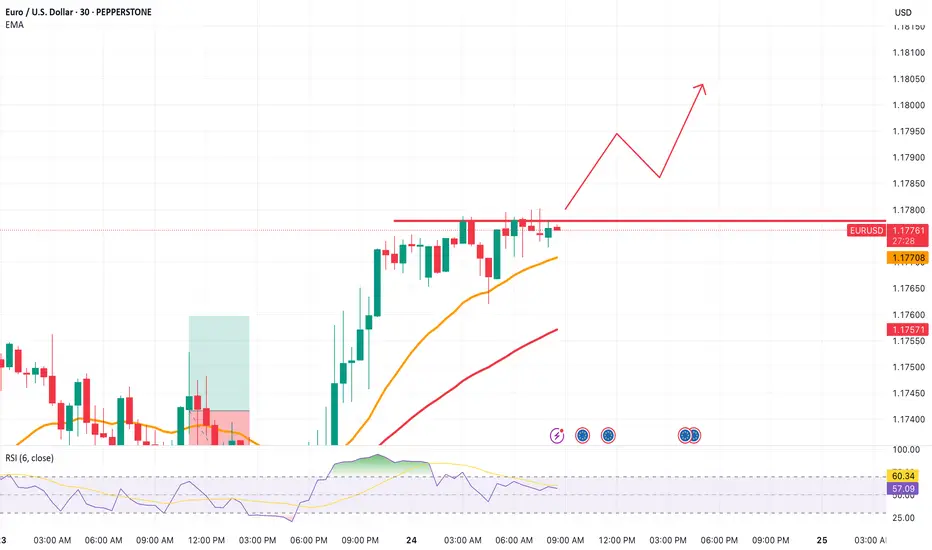
EURUSD: Strong Growth Ahead! Long!
My dear friends,
Today we will analyse EURUSD together☺️
The market is at an inflection zone and price has now reached an area around 1.17463 where previous reversals or breakouts have occurred.And a price reaction that we are seeing on multiple timeframes here could signal the next move up so we can enter on confirmation, and target the next key level of 1.17589.Stop-loss is recommended beyond the inflection zone.
❤️Sending you lots of Love and Hugs❤️
