EURUSD Selling from supply zone at 1.18000 readmore,,,,,📊EURUSD Forecast – 4H Timeframe
EURUSD has broken out of the descending channel, but now facing strong selling pressure from the 1.18000 supply zone
📍 Sell Setup in Play:
Price reacting from the supply zone — potential short opportunity unfolding
🎯 Target Support Levels / Demand Zones:
🔹 1.16700 – first demand zone
🔹 1.16000 – bullish OB
🔹 1.14600 – extended bearish target if momentum continues
🧠Clean rejection from resistance — now tracking price action for confirmation and continuation moves
What’s your next level on EURUSD? Share below
👍 Like | 🔔 Follow | 💭 Comment for more real-time forecasts
#eurusd
USDEUR trade ideas

Euro Steady at $1.17 as ECB Holds FireThe euro hovered near $1.17 as traders awaited Thursday’s European Central Bank decision. With rates expected to remain steady following eight consecutive cuts, policymakers tread cautiously amid strength in the euro and lingering U.S. tariff uncertainty. Meanwhile, EU officials are preparing contingency plans in case trade negotiations with President Trump collapse before the August 1 deadline.
Resistance for the pair is at 1.1830, while support is at 1.1660.
EURUSD - Price ActionYesterday’s accumulation phase pushed the market to new highs 📈, with a top forming at 1.17605. After the price pullback during the Asian session, it appears that London used the opportunity to enter short positions, potentially forming a distribution range.
As long as we remain above the vWAP from yesterday’s accumulation, I still see a possibility for a continued move to the upside 🚀
The next key level where I’ll be watching for long entries is the demand zone supported by vWAP around 1.16940 📊
👉 Follow me for more EUR/USD trade ideas, market updates. 💼
I share structured analysis every Monday and Wednesday to help you stay aligned with the market 🗓️📊

EU London Protocol, Bread & ButterOn this quick video I share my past trade I took using the London protocol. And the anticipation of the next day and how I will look to take my setup, if it will form.

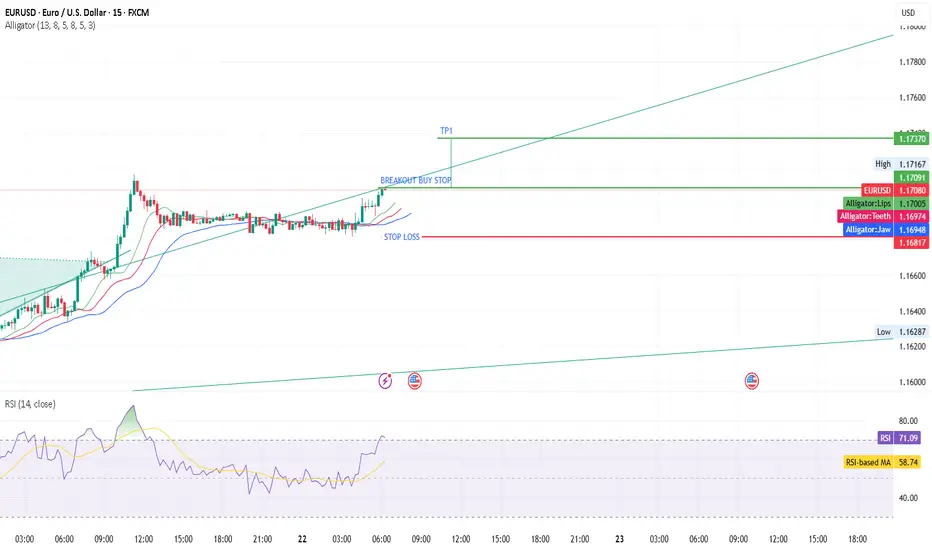
Already LONG EURUSD, come join the party !Come join the party and bring the USD down, haha.
This is the 4H chart and the day is still showing a bullish trend.
Please DYODD

EURUSD Long Swing FX:EURUSD price had stopped falling and I was waiting for bullish volume to kick inn, initial bullish volume started jumping inn, so taking long now.
With my back testing of this strategy, it hits multiple possible take profits, manage your position accordingly.
I manage trade on daily basis.
Use proper risk management
Looks like good trade.
Lets monitor.
Use proper risk management.
Disclaimer: only idea, not advice

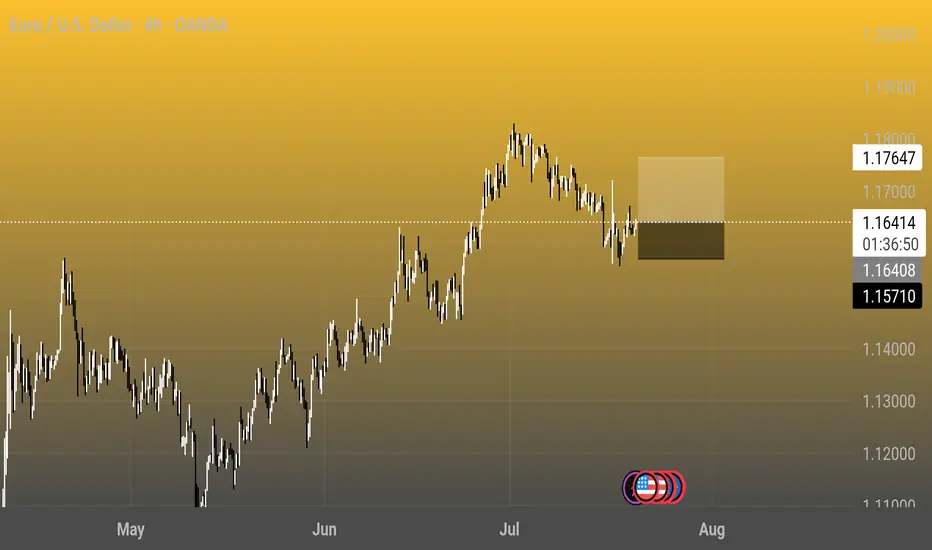
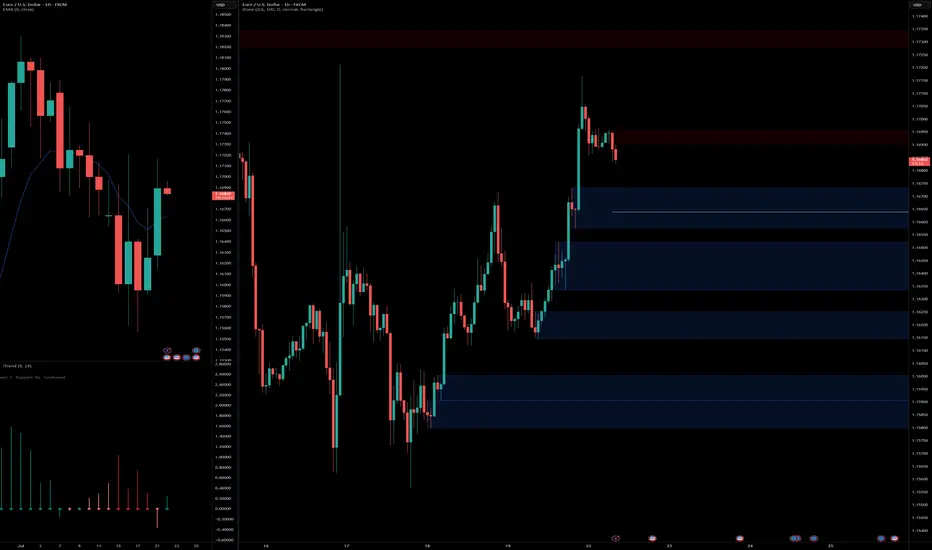
Euro / U.S. Dollar 4h Chart - OANDA4-hour candlestick chart showing the exchange rate between the Euro (EUR) and the U.S. Dollar (USD) from May to August 2025. The current rate is 1.16416, with a 0.14% increase (+0.00161). The chart highlights a peak around late June to early July, followed by a decline, with notable support and resistance levels marked at 1.17647 and 1.16416, respectively.
EURUSD| Back Aligned Bullish - Still in Analysis ModePair: EURUSD
Bias: Bullish
Following price closely and adapting to the market’s rhythm.
Recent structure showed that price is still respecting last week’s key zones — so I’ve realigned with the bullish bias accordingly.
No entries yet — still in analysis mode, which honestly is the best part 😉
Watching for clean LTF confirmations before engaging. No guessing. No forcing.
Price always tells the truth — you just gotta stay patient enough to listen.
#EURUSD #SMC #bullishbias #marketstructure #inducementking #smartmoneyflow
Bless Trading!

Trump did it again!Donald Trump did exactly what he did in his previous term: Dollar Devaluation .
Reason? Strengthening the US exports.
Will it work? We'll see.
What's your thoughts?
#dollar #forex #euro #devaluation #trump #exports #trading #algo


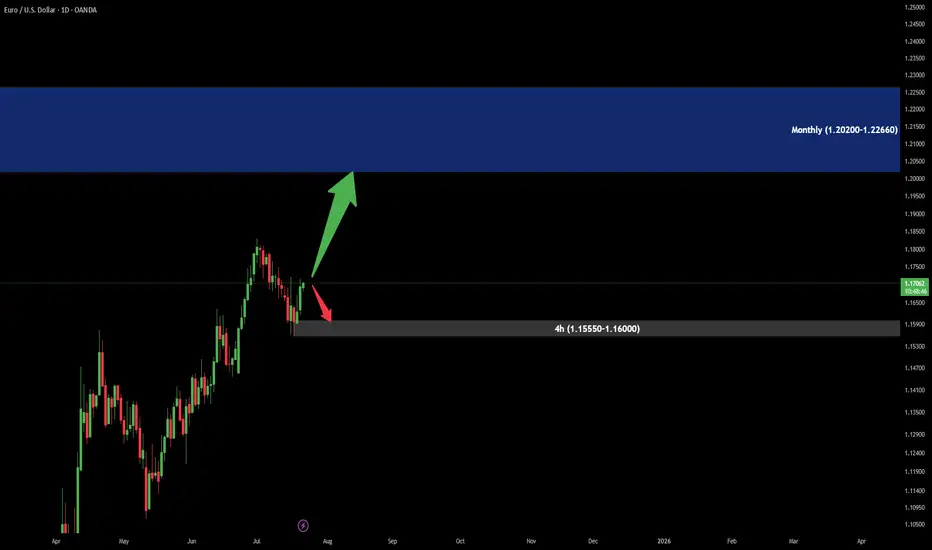
EuroUsd Analysis in MidtermTrend is UP!
As we can see there is a Supply area in monthly Time Frame around (1.20200-1.22660).
Price should have a good reaction there.
In lower Time Frame there is Demand area (in 4hour), which could be a good Buy position.
The EUR & the USD. Events that can affect the move this weekThis week we are monitoring EUR and USD carefully, as we could see some interesting moves, due to some events on the economic calendar. Let's dig in.
FX_IDC:EURUSD
MARKETSCOM:EURUSD
TVC:DXY
MARKETSCOM:DOLLARINDEX
Let us know what you think in the comments below.
Thank you.
75.2% of retail investor accounts lose money when trading CFDs with this provider. You should consider whether you understand how CFDs work and whether you can afford to take the high risk of losing your money. Past performance is not necessarily indicative of future results. The value of investments may fall as well as rise and the investor may not get back the amount initially invested. This content is not intended for nor applicable to residents of the UK. Cryptocurrency CFDs and spread bets are restricted in the UK for all retail clients.

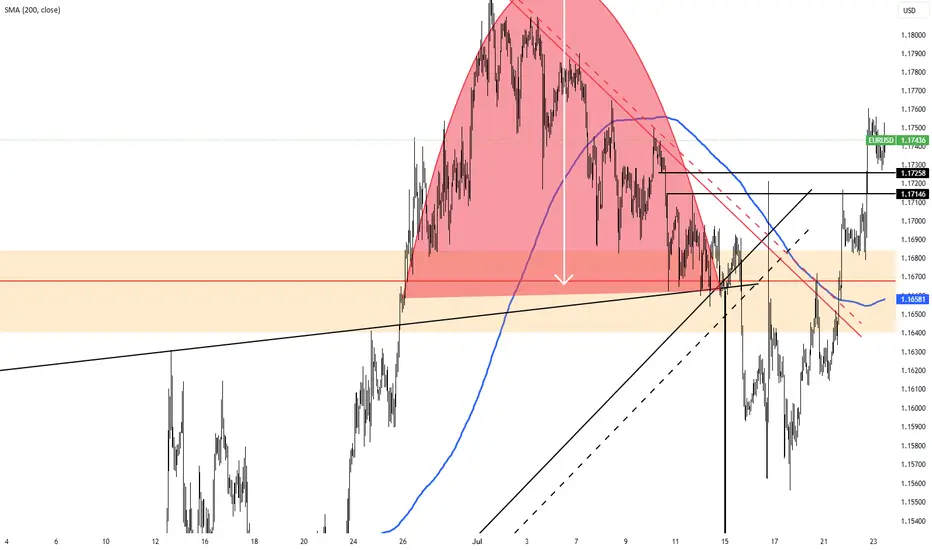
EURUSD Consolidating now, but soon may reveal a new trend!!!EURUSD is consolidating between the red box shown. Previously, it can be seen that, this whole area between 1.17050 and 1.16630 is very choppy, and not the best area to place any trades.
Look at the market structure latest HH. If price pushes above 1.17050, we will continue in an uptrend, and then we will look for BUYS.
Now, look at the red trendline drawn. It is interacting with the consolidation zone. We have a very small pullback at the red arrow drawn. It exactly sits at 1.16630.
The point is, if price goes below that level, we will know that price is respecting the trendline and would most likely continue moving down. Therefore, we look for SELLS.
Obviously, we dont want to get caught in any fakeouts. So we will further look at how the candles are being formed later and what story they tell.
Now we wait and watch.

Fundamental Market Analysis for July 22, 2025 EURUSDThe euro is trading near 1.1700, having retreated from an intraday high of 1.1720 after the release of the final June U.S. CPI figures, which confirmed a slowdown in inflation to 2.7% y/y and 0.1% m/m while keeping the core reading steady at 3.1%. The brief rise in risk appetite quickly gave way to stronger demand for the dollar as the probability of the Fed’s first rate cut in September fell from 65% to 55%.
Additional pressure on the euro comes from the yield differential: 10-year U.S. Treasuries hover around 4.45%, while German Bunds yield only 2.30%. The gap of more than 215 bp encourages capital to flow from the eurozone into dollar assets, supporting USD demand.
Fundamentally, risks for the euro remain tilted to the downside: after June’s rate cut the ECB said further moves depend on price dynamics, and the eurozone composite PMI dropped to 50.1 – the brink of stagnation. Against the backdrop of weak continental activity and moderate yet persistent U.S. inflation, the pair may test support at 1.1615 in the coming sessions, especially if U.S. durable-goods orders exceed forecasts.
Trading recommendation: SELL 1.1700, SL 1.1720, TP 1.1615

Bullish Setup Loading: Watching Structure & Confirmation ZonesHello Traders,
Price is currently in a counter-trend pullback phase, showing signs of temporary weakness within a larger bullish context. Patience is key as we wait for price to build structure and break the internal Lower High (LH), which would act as an early signal of bullish continuation.
The 4-hour internal structure remains strongly bullish, following a clean mitigation of the daily bullish continuation demand zone. A long setup from a 4H Point of Interest (POI), backed by Lower Timeframe (LTF) confirmation, offers a high-probability trade aligned with the higher timeframe trend. Confirmation through structural shifts will reduce risk and increase confidence in directional bias.

Eurousd techinical analysis.Eurousd techinical analysis next move posibale at h1 time frame.not finchinal advice.

EUR/USD Holds Firm Near 1.1700 Amid Trade TensionsFundamental analysis
The EUR/USD pair remains buoyant near 1.1700 in todays Asian session, extending monday’s gains as the US Dollar weakens sharply amid renewed US-EU trade tensions.
The US Dollar Index (DXY) is treading water around 97.88, down from its recent one month high of 99.00, as risk sentiment deteriorates following reports that President Trump is pushing for tariffs of 15%-20%, above the previously discussed 10%. Additionally, his unwillingness to ease the 25% auto levy has triggered a more aggressive EU stance, with Germany joining France in calling for retaliatory measures.
On the monetary policy front, markets are focused on the European Central Bank (ECB), which is widely expected to keep rates unchanged on Thursday. However, President Christine Lagarde’s guidance will be crucial for gauging the euro’s direction in the second half of the year.
Meanwhile, traders in the US remain confident that the Federal Reserve will leave its benchmark rate at 4.25%–4.50% in next week’s meeting, further limiting upside for the dollar.
Technical analysis
EUR/USD remains caught within a pivotal range, with directional conviction still lacking as momentum indicators remain subdued.
Upside Potential
The pair must vault above the 2025 high of 1.1830 (July 1) to open the path toward the June 2018 peak at 1.1852. A sustained break above this dual resistance zone would likely encourage a bullish continuation, targeting fresh multi-year highs.
Downside Risk
Conversely, a breach of July’s base at 1.1556 would weaken the current structure and potentially trigger a deeper pullback:
Initial support emerges at the 55-day moving average near 1.1485. Below that, the May 29 weekly low at 1.1210 offers the next significant floor. A failure to hold these levels could expose the psychologically critical 1.1000 handle, a key long-term support.
The forecasts provided herein are intended for informational purposes only and should not be construed as guarantees of future performance. This is an example only to enhance a consumer's understanding of the strategy being described above and is not to be taken as Blueberry Markets providing personal advice.

eurusd lopngBuying from fresh demand zone after bullish structure break.
Daily showing strong momentum, 1H confirms continuation with clean break and retest zone.
📍Entry: Demand zone
🎯 Target: 2R
🛑 SL: Below demand zone
Risk-Reward: Favorable setup aligning with higher timeframe bias.

EUR/USD AccumulationOn the 5-minute timeframe, buying activity initiates, signaling the potential end of the downtrend. The first indication of upward momentum appears following the formation of a range and a subsequent liquidity sweep. Price then retests the prior low with diminished volume but fails to break below it, suggesting that selling pressure is being absorbed by buyers. This behavior reflects accumulation by informed participants positioning for a move higher. As demand begins to outweigh supply, clear signs of strength emerge
Entry: 1.15765
Take Profit: 1.16279
Stop Loss: 1.15621

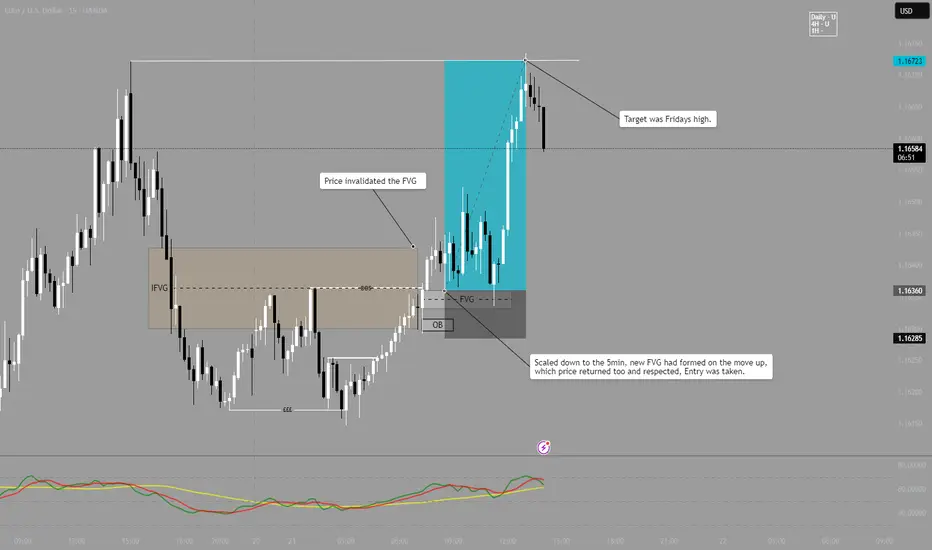
EUR/USD LONG - Follow upAs can be seen, Price invalidated the FVG, indicating a bullish momentum.
After price broke, I then look at the 5 minute for a precise entry.
On the 5m an FVG had been created on the initial move up, price then returned to this area and an entry long was taken.
Target was Fridays Highs.
Note - This is published on the 15m as it wont allow to post with 5m timeframe.
buy ideahi all. price return at 11 from middle of the know where and will react to a special level. be happy(wink)
