EURUSD: Bears Are Winning! Short!
My dear friends,
Today we will analyse EURUSD together☺️
The market is at an inflection zone and price has now reached an area around 1.16557 where previous reversals or breakouts have occurred.And a price reaction that we are seeing on multiple timeframes here could signal the next move down so we can enter on confirmation, and target the next key level of 1.16419..Stop-loss is recommended beyond the inflection zone.
❤️Sending you lots of Love and Hugs❤️
USDEUR trade ideas

EURUSD Breakout Trade EUR/USD – Breakout Confirmation
🔹 Multi-Timeframe Bullish Setup by PULSETRADESFX
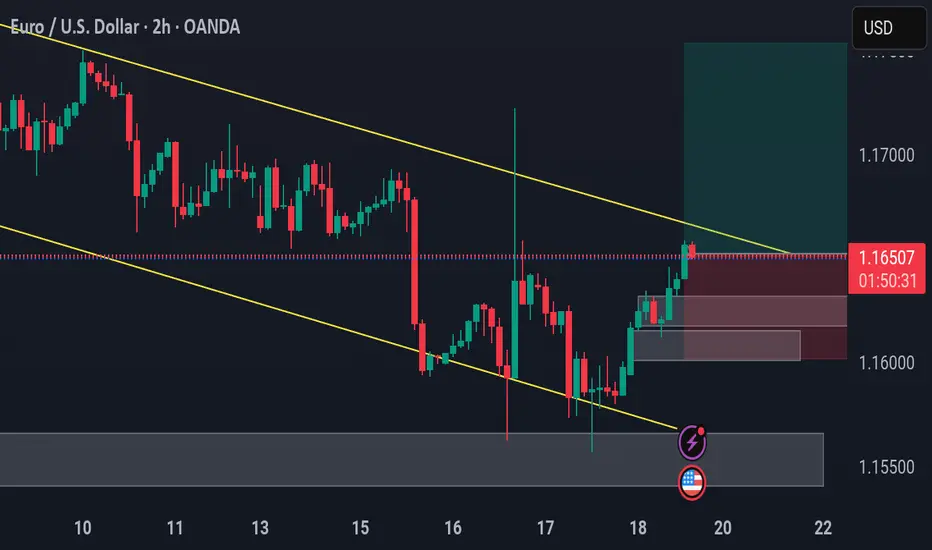
EUR/USD is showing a strong bullish shift after breaking out of a well-defined descending channel. Price reacted perfectly from the demand zone and is now pushing above descending trendline resistance across the 2H chart.
This signals early signs of trend reversal, backed by confluence across intraday and higher timeframes.
The structure is clean, the R:R is healthy, and momentum favors bulls after multiple rejections at key support.
---
✅ Confluences Supporting the Long:
Descending channel breakout (2H )
Triple demand zone rejection
Break and close above minor resistance
Clean bullish momentum candle
Economic catalysts ahead (watch USD data releases 📅)
📅 July 18, 2025
📊 FOREX.com | EUR/USD (2H)
#EURUSD #Forex #BreakoutTrade #BullishSetup #TechnicalAnalysis #TradingView #PULSETRADESFX
EURUSD 1st Sell EntryEntry: 1.16216
Stop Loss (R): 1.16516
Take Profit (4R): 1.15016
*Disclaimer: I will not accept liability for any loss or damage, including without limitation to any loss of profit, which may arise directly or indirectly from use of or reliance on such information.

EURUSD BULLISH MOMENTUMMarket Structure
Higher highs and higher lows forming on the H4 and Daily timeframe.
Price may have broken out of a previous consolidation range, confirming bullish momentum.
Key Levels
former resistance, now support, psychological and historical levelS.

EURUSDEUR/USD shows bullish COT (net longs), but USD’s individual COT is very strong (net longs), which usually means USD strength and EUR/USD bearish pressure.
COT on the pair can lag or reflect speculative flows, while USD’s strength often has bigger impact.

EUR/USD Drops to $1.16 Amid Strong U.S. DataThe euro declined to $1.16 on Thursday, reaching its lowest level in almost a month as the U.S. dollar regained strength. The dollar’s rise followed solid U.S. inflation data and President Trump’s comments suggesting he will keep Fed Chair Jerome Powell in place, reducing expectations for near-term Fed rate cuts. Meanwhile, markets continued to monitor U.S.-EU trade negotiations ahead of the August 1 deadline.
Resistance for the pair is at 1.1670, while support is at 1.1580.
EURUSD – Long Setup from 15M OB
Idea:
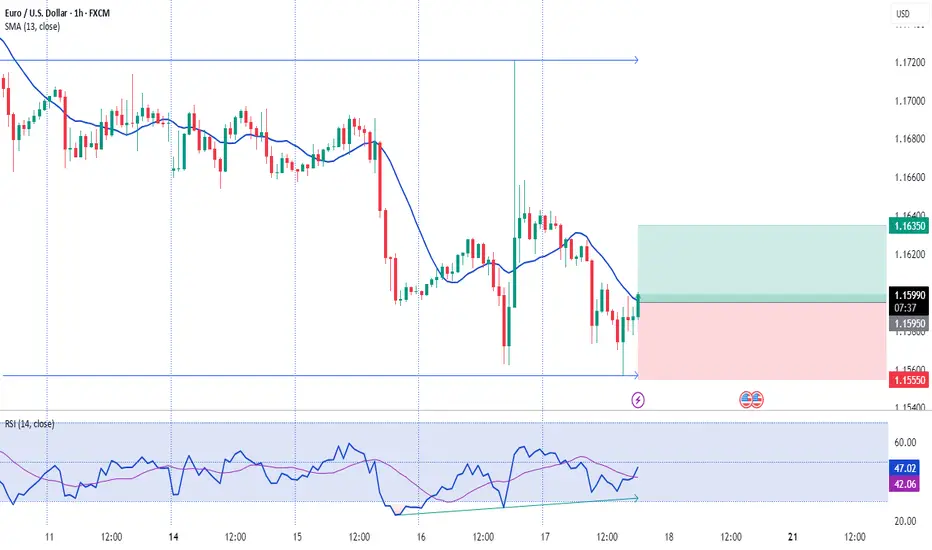
- Market structure is bullish on H1
- CHoCH + OB on 15M confirmed entry
TP: 3R | SL: Below 15M OB | Risk: 1%
#XAUUSD #ICT #OrderBlock #FundedTrader #TradingStrategy
Buy EUR USD from Pivoton higher charts like 1D price seems in an uptrend so I would look to open a Long position
price is now correction to Monthly pivot line which could be good RR

EURUSD(20250718) Today's AnalysisMarket news:
① Kugler: It is appropriate to keep the interest rate policy stable for "a while".
② Daly: Whether to cut interest rates in July or September is not the most critical.
③ Bostic: It may be difficult to cut interest rates in the short term.
Technical analysis:
Today's buying and selling boundaries:
1.1597
Support and resistance levels:
1.1683
1.1651
1.1630
1.1565
1.1544
1.1512
Trading strategy:
If the price breaks through 1.1630, consider buying in, the first target price is 1.1651
If the price breaks through 1.1597, consider selling in, the first target price is 1.1565

EURUSD | Bullish EURUSD has printed bullish divergence on one hour timeframe.It is already bullish on daily as well four hour timeframe bigger.Moreover,on candles chart it has formed a double bottom formation which also indicates a bullish reversal.

Eurousd techinical analysis.Eurousd techinical analysis next move posibale at h1 time frame.not finchinal advice.

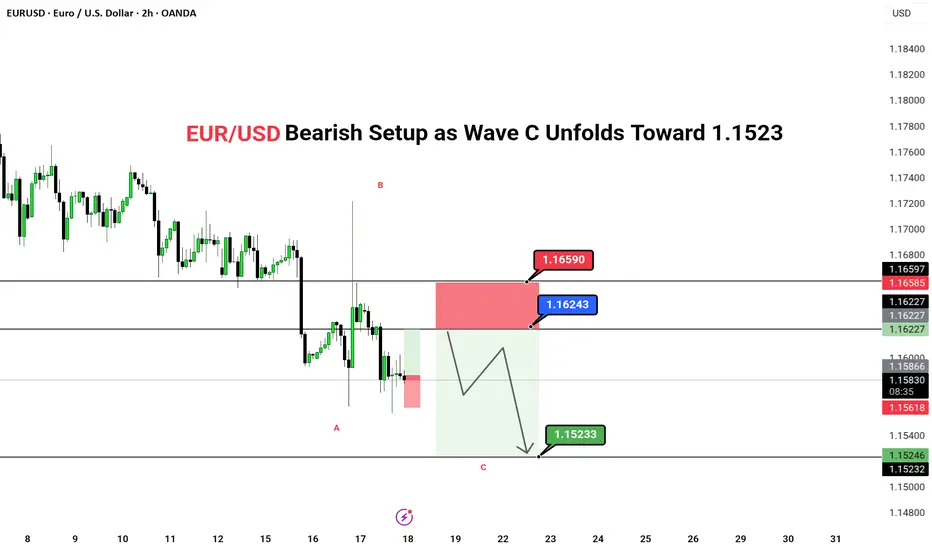
EUR/USD Bearish Setup as Wave C Unfolds Toward 1.1523EUR/USD Bearish Setup as Wave C Unfolds Toward 1.1523
🔴 SHORT BIAS
📅 Updated: July 18
---
🔍 Description
EUR/USD appears to be unfolding a classic ABC corrective structure, with Wave B now likely completed below the key 1.1624–1.1659 resistance zone. The price action has shown clear rejection in this supply area, opening room for Wave C to extend lower toward the 1.1523 target.
This setup aligns with a broader correction within a downtrend, with technicals and short-term flows pointing toward further downside pressure. The 2H timeframe offers swing traders a favorable risk-reward scenario, with invalidation clearly above 1.1659.
---
📊 Technical Structure (2H)
✅ Wave A completed
✅ Wave B rejected at resistance
✅ Wave C expected to unfold
📌 Downside Target
First & Final: 1.15233
🔻 Invalidation Zone
Above: 1.16590 (Break invalidates short bias)
MSFT longThis is a After a strong pullback and a clear rejection at key support levels, the EUR/USD pair is showing signs of a potential reversal. Technical indicators suggest oversold conditions, making this an attractive entry for bullish traders.
🎯 Entry: Around 1.15873
🛑 Stop Loss: Below 1.19700
💰 Take Profit: 1.0750 – 1.14385
Always trade with proper risk management and confirm with your own analysis!good trade

EURUSD under pressure despite Powell being on his way outEURUSD remains under pressure as US jobless claims improve and Powell appears to be on his way out. Still, the impact has been limited, and the broader trend remains upward. With growing speculation around Powell’s replacement, the market may look to form a bottom.
This content is not directed to residents of the EU or UK. Any opinions, news, research, analyses, prices or other information contained on this website is provided as general market commentary and does not constitute investment advice. ThinkMarkets will not accept liability for any loss or damage including, without limitation, to any loss of profit which may arise directly or indirectly from use of or reliance on such information.

EUR/USD 4-Hour Chart - OANDA4-hour performance of the Euro/US Dollar (EUR/USD) currency pair on the OANDA platform as of July 17, 2025. The current exchange rate is 1.16408, showing a slight decline of 0.01%. Key levels include a buy signal at 1.16417 and a sell signal at 1.16399, with recent price action ranging between 1.1452 and 1.17245. The chart includes candlestick patterns and shaded areas indicating potential resistance and support zones.

EURUSD: Support & Resistance Analysis 🇪🇺🇺🇸
Here is my fresh support & resistance analysis for EURUSD.
Vertical Structures
Vertical Support 1: Rising trend line
Vertical Support 2: Falling trend line
Vertical Resistance 1: Falling trend line
Horizontal Structures
Support 1: 1.1577 - 1.1600 area
Support 2: 1.1445 - 1.1458 area
Support 3: 1.1356 - 1.1373 area
Support 4: 1.1190 - 1.1280 area
Resistance 1: 1.1682 - 1.1766 area
Resistance 2: 1.1807 - 1.1830 area
Consider these structures for pullback/breakout trading.
❤️Please, support my work with like, thank you!❤️
I am part of Trade Nation's Influencer program and receive a monthly fee for using their TradingView charts in my analysis.

EUR/USD) bearish chochy Trend Read The captionSMC trading point update
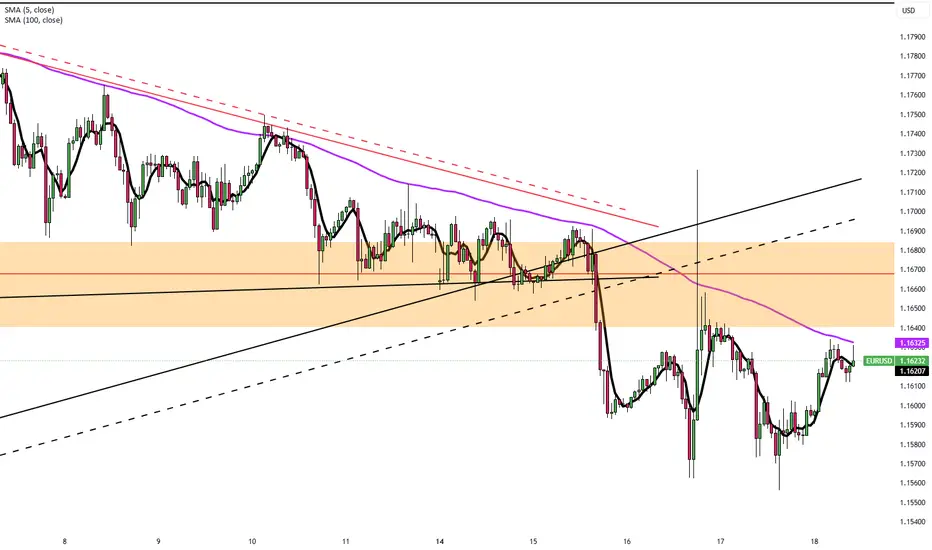
Technical analysis of EUR/USD (Euro vs. U.S. Dollar) on the 4-hour timeframe. Here’s the breakdown
---
Technical Breakdown:
1. Market Structure Shift (CHOCH):
The chart highlights a Change of Character (CHOCH), signaling a bearish reversal after a previous uptrend.
This is confirmed by lower highs and lower lows forming after the CHOCH point.
2. New Resistance Zone:
The previous support (yellow box) has now turned into a new resistance level around 1.16400–1.16700.
Price has rejected this area after the breakdown, validating the resistance flip.
3. 200 EMA Breakdown:
Price is now trading below the 200 EMA (1.15928), which reinforces bearish sentiment.
The EMA may act as dynamic resistance on any pullbacks.
4. Target Zone:
The projected target is the key support zone around 1.14582, where price consolidated before the last major bullish move.
This level has historical significance and aligns with a clean support demand zone.
5. RSI Indicator:
RSI is not yet oversold, sitting in a neutral-to-bearish range, indicating further downside potential.
Mr SMC Trading point
---
Trade Idea Summary:
Bias: Bearish
Entry Zone: On breakdown and rejection from the new resistance area (~1.16400–1.16700)
Target Zone: 1.14582 (key support)
Invalidation: A break and close above the resistance zone
Confluence: CHOCH confirmation + support-turned-resistance + 200 EMA breakdown
---
Please support boost 🚀 this analysis)

EUR/USD Bearish Outlook: Short-Term Opportunity Ahead!Hello Fellow Traders! 👋
In my last post on Monday, I pointed out a key zone where EUR/USD showed bullish momentum, hitting nearly 60% of our target! 🎯 I booked profits yesterday, and now the market is giving us fresh clues. Let’s dive into the latest setup! 🚀
Market Update
Over the past two days, the price has swept both buyers and sellers, clearing the way for a new move. The 4H trendline has been broken, signaling bearish momentum. As we head into the NY session, I’m watching for further confluence to confirm this move. 📊
Trade Idea
Direction: Bearish 📉
Target: 1.14500 ( Long-Term First Target)
Strategy: I’m focusing on short-term entries with confluence from lower timeframes (e.g., 1H or 15M). Long-term positions? Not yet—let’s stay nimble!
Why This Setup?
Trendline Break: Clear bearish signal on the 4H chart.
Confluence: Awaiting confirmation from lower timeframes for precise entries.
Risk Management: Short-term focus to capitalize on the move without overexposure.
What do you think of this setup? Drop a comment below with your thoughts! 💬 If you found this idea helpful, smash that Like button 👍 and Follow for more updates. Let’s keep the trading community thriving! 🚀
Happy Trading! 💰
#EURUSD #Forex #TradingView #TechnicalAnalysis

LONG for EURUSD?LONG EURUSD
What is going on with EURUSD
We see how beautiful the market went up from the beginning of the trend line constatly with pullbacks that means a steady uptrend not really the urge that the market want to go back.
We used the fib as always to indicate 61.8% perfect pullback on that and as we see on the resistance that has to be tested.
There will be a fake break out of 100-150 pips.
If we go back on the RSI we see divergence momentum is back to average.
We call this hidden divergence price goes up and indicator goes down.
What indicates us that we also have new space for a higher high.
Targets we have in mind 1.19035 with high momentum what I expect it will hit the 1.20274 , important to have in mind 1.20000 is a key level price wants to go there as a magnet.
Reverse of the analyses:
If it breaks the 61.8% it will retest the market structure and goes to the 1.13544 with high momentum just to test price and set us offside because that is what the market want hit as many stop losses because that’s where the liquidity is build up, takes out and will continue the uptrend.
Follow my journey I try to post daily.
Markets I analyse XAUUSD, EURUSD, USDMXN, XTIUSD, XRPUSD, BTCUSD.
Will start more forex and Crypto soon.

EURUSD Bullish Continuation Patterns and Consistent Demand The bullish continuation patterns and the consistent daily demand zones indicate that the trend is still bullish despite last week's bearish correction.
Price is currently reacting to a daily support zone. To confirm going long, especially long term, I recommend waiting for the current falling wedge to breakout and retest and then ride the bullish momentum to daily and weekly supply zones.

Euro Slips, Brussels Stalls RetaliationEUR/USD is pulling back toward 1.1620 in Thursday’s Asian session as markets await Eurozone HICP data, with eyes on US June retail sales later in the day. The dollar stays firm on expectations that the Fed will hold rates at 4.25%-4.50% in July amid tariff-driven uncertainty.
President Trump announced plans to notify over 150 countries of a 10% tariff, possibly rising to 15-20%, targeting those with minimal U.S. trade ties. He criticized Fed Chair Powell but admitted removing him might destabilize markets, while floating possible trade deals with Europe and India.
Strong June CPI has reignited concerns about prolonged high rates. Dallas Fed’s Lorie Logan and New York Fed’s John Williams both warned that tariffs may keep inflation elevated, reinforcing the case for keeping rates steady.
Resistance for the pair is at 1.1670, while support is at 1.1580.

Trade Setup: EUR/USD 15min | OB Mitigation Play⚙️ Type: Countertrend (Risk-managed Buy)
Direction: Long
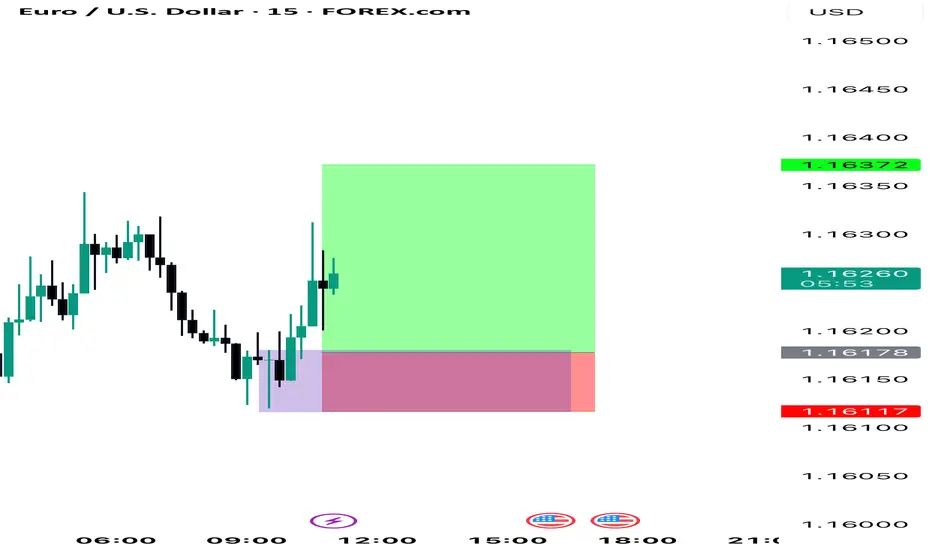
Entry Zone: 1.15850–1.15886 (Refined OB)
Entry Type: Buy Limit
Stop Loss: Below the OB low → 1.15790
Take Profit Targets:
TP1: 1.16043 (minor imbalance fill)
TP2: 1.16140 (supply zone re-test / 50% fib)
Risk to Reward: ~1:3 minimum (depending on fill and management)
🎯 Why This Setup Works
Price swept sell-side liquidity into a refined OB from the CPI move.
Confluence with 0.786 retracement, suggesting algo entry interest.
Strong momentum imbalance above gives room for retracement pullback.
DXY showing signs of short-term exhaustion at intraday highs.
🔒 Invalidation Criteria
15m candle close below 1.15790
Clean break and hold of OB low → Flip bias bearish
