DeGRAM | EURUSD reached the lower boundary of the channel📊 Technical Analysis
● Price sliced through the channel mid-support and the inner trend-fan, closing below 1.1573; the break was retested (grey circle) and rejected, confirming a bear continuation from the sequence of lower-highs.
● The move unlocks the descending channel’s lower rail near 1.1450, while interim demand sits at the May pivot / 0.618 swing 1.1520.
💡 Fundamental Analysis
● EZ data underwhelmed (German Ifo, EZ consumer-confidence) just as Fed officials warned rates may stay “restrictive for longer,” widening the short-rate gap and refreshing USD bids.
✨ Summary
Short 1.1590-1.1615; hold below 1.1573 targets 1.1520 ➜ 1.1450. Bias void on an H1 close above 1.1660.
-------------------
Share your opinion in the comments and support the idea with a like. Thanks for your support!
USDEUR trade ideas

EUR/USD About to Trap the Bears? Final Push Before the Drop! EUR/USD is showing a solid short-term bullish structure, with a move initiated from the demand base around 1.1560, fueling a strong rally toward the current level near 1.1770. Price is now approaching a significant supply zone between 1.1790 and 1.1875, previously responsible for the last major bearish swing. This area also aligns with projected Fibonacci levels (25%-100%), reinforcing its relevance as a possible inflection point.
This movement suggests there’s still room for price to push higher, likely completing the final leg of this bullish cycle before a more convincing short setup develops. At this stage, Fibonacci levels are not acting as firm supports, but rather as hypothetical pullback projections: once price enters the 1.1800–1.1875 area, it will be key to monitor for signs of exhaustion. A rejection here may initiate a bearish retracement toward 1.1670–1.1650, in line with the 62–70.5% fib levels.
Retail sentiment remains highly contrarian: 76% of traders are short, positioning themselves too early against the trend. This imbalance adds fuel for a potential continuation higher, as the market may seek to "squeeze" these premature shorts. Additionally, the COT report confirms growing institutional interest in the euro, with non-commercials increasing their net longs, while USD net long exposure continues to shrink.
Seasonality adds further confluence: late July is historically bullish for EUR/USD, suggesting one final leg up could materialize before a typically weaker August.
✅ Trading Outlook
EUR/USD is technically aligned for a final push toward the 1.1800–1.1875 premium zone, where a potential short opportunity may arise. The rally is currently driven by overextended retail shorts and supportive institutional flows. Only after price interacts with the upper supply zone should reversal signs be evaluated, with correction targets around 1.1670–1.1650. The ideal play: wait for confirmation of bearish intent in August, when seasonal weakness typically kicks in.

EURUSD | Time For A Pullback?The week kicked off with strong impulsive moves to the upside, leaving no room for deeper correction. Then slowly from Wednesday, we started to see a decline in strength in the bullish run.
Now, with price edging toward the next swing low for a possible bearish change of character, is this a good way to ride the stream to the downside?
Keep your A-game on as we watch price unfold, and trade reactively to price movement.
Do not forget to guard your capitals with risk management.
Good luck traders. 👍
Follow me for more and more of these analyses.
See you on the next one. 🫡

EUR USD longas the trend sugest we would yet trade longs but the pair may have a correction ...
Please note: This is for educational purposes only and not a trading signal. These ideas are shared purely for back testing and to exchange views. The goal is to inspire ideas and encourage discussion. If you notice anything wrong, feel free to share your thoughts. In the end, to learn is to share !

"EUR/USD Bearish Reversal Setup from Key Resistance Zone"This EUR/USD 1-hour chart suggests a potential bearish reversal from the 1.17730 resistance level. The price has reached a key supply zone, with a marked fair value gap (FVG) and previous break of structure (BOS). The chart anticipates a drop toward the 1.16500–1.16788 support zone, supported by a highlighted short setup.

EURUSD may fall, but it's all about the FOMC DecisionEURUSD may fall, but it's all about the FOMC Decision
During the first 2 weeks of July, EURUSD fell from 1.18000 to 1.1550 and then the price rose again due to renewed tariffs.
Trump's comments regarding Powell and tariffs, according to which the EU and the US may reach an agreement soon, renewed the strength of EURUSD.
However, this time it is more related to the FOMC. If the FED cuts rates, EURUSD can drop further. When they didn't cut rates, the USD was weak or didn't move at all.
Let's see.
If Powell makes any surprises this time, EURUSD could fall, as shown in the chart, from 1.1800 to 1.1550, which is almost 250 pips lower.
Key support zones: 1.1660 and 1.1580
You may find more details in the chart!
Thank you and Good Luck!
PS: Please support with a like or comment if you find this analysis useful for your trading day
Disclosure: I am part of Trade Nation's Influencer program and receive a monthly fee for using their TradingView charts in my analysis.

HTF EURUSD PA REVIEWFeel free to provide any feedback.
It is important to note the dynamics between bearish and bullish range-initiation-mitigation-continuation.
Where one phase might be the initiation leg out of a bearish range, it can also be the point of mitigation of a previous bullish range.

Euro is pumping up Officially the market is targeting the buy side liquidity on the 1.8 , next week we will see if the market confirm the up trend in lower time frame

Precision Inc. Eur/Usd has had a brilliant start to the week monday to wednesday reaching my objectives. Thursday is known to initiate a reversal therefore I am done for the week

EURUSD RetestEURUSD is currently going for a retest since its in a uptrend , its going to test zone 1.16648 before it continues to go up plus there some FED news that will be coming this will also shift the markets . lets keep a kin eye

EURUSD Quality ShortH4 H1 Dropping hard
Stoploss behind solid resistance
Take profit on next nearest support which is solid
80%-90% odds, and positive Risk Reward

DeGRAM | EURUSD is correcting from the channel boundary📊 Technical Analysis
● A second rejection at the upper channel/1.1780 supply (red arrows) signals overextension; price is retracing toward the mid-July demand cluster where the rising-channel floor and prior swing base intersect near 1.1600.
● Momentum remains positive on higher-time-frame: each pull-back since May has held the channel support, and the current decline is unfolding as a corrective ABC that projects into 1.1585-1.1620 — a historically bid zone.
💡 Fundamental Analysis
● Softer US Q2-GDP deflator cooled 2-yr yields, while July Euro-area CPI flash is expected to stay sticky, trimming the Fed–ECB policy gap and limiting EUR downside.
✨ Summary
Buy 1.1585-1.1620; hold above 1.1594 targets 1.1687 → 1.1780. Long view invalidated on an H4 close below 1.1530.
-------------------
Share your opinion in the comments and support the idea with a like. Thanks for your support!

EURUSD: Support & Resistance Analysis For Next Week 🇪🇺🇺🇸
Here is my latest structure analysis and important supports/resistances
for EURUSD for next week.
Consider these structures for pullback/breakout trading.
❤️Please, support my work with like, thank you!❤️
I am part of Trade Nation's Influencer program and receive a monthly fee for using their TradingView charts in my analysis.

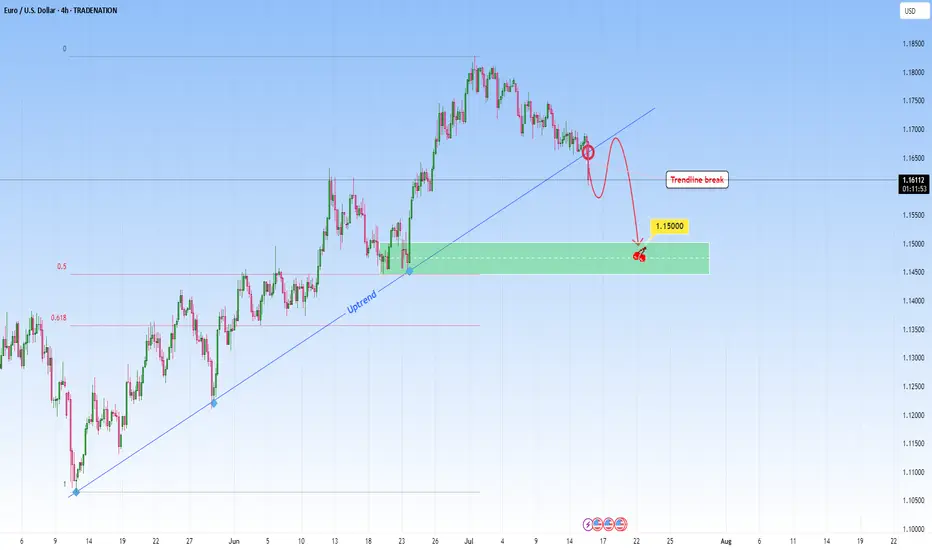
EURUSD: Sell Opportunity after Trendline breakEURUSD was in a steep uptrend but it might stop with this recent break through the uptrend. A break like this one on a strong trendline that had multiple touches, indicates either a potential reversal or major pause in the trend. This candle that broke the trendline signals the first hint of structural change.
I will be waiting for a retest and look to get involved in a short setup.
Ideally, what I look for in retests is to be met with a confirming candle. This would confirm the sellers have taken over and validate the change from uptrend to potential downtrend or consolidation phase.
My target would be around 1.1500.
Just sharing my thoughts for the charts, this isn’t financial advice. Always confirm your setups and manage your risk properly.
Disclosure: I am part of Trade Nation's Influencer program and receive a monthly fee for using their TradingView charts in my analysis .
Closed Longs, Now Selling Rallies on EURUSD ReversalAs mentioned in my previous posts, I’m been bullish on EURUSD in the medium term, targeting 1.20 and even beyond.
But no pair—especially not EURUSD, which tends to move more steadily and rationally—goes up in a straight line.
________________________________________
🔹 Last week, the pair stalled just below 1.18, and I decided to close my long trade with a +150 pip gain. That proved to be a wise call, as price dropped hard shortly after.
________________________________________
📉 What’s happening now?
• EURUSD has broken below the rising trendline
• More importantly, it’s broken below the neckline of a double top pattern
• Now trading around 1.1535
This opens the door for a deeper correction, and I expect we could see a test of the 1.1150–1.1100 zone by the end of summer.
________________________________________
📌 Trading Plan:
• I’m now in sell-the-rally mode
• Ideal short entry: around 1.1650, where we also get a favorable 1:3+ risk-reward
• Watch also for interim support around 1.1400
________________________________________
Conclusion:
The bigger picture remains bullish— but this correction looks healthy and isn’t done yet.
Selling rallies makes more sense now, until the structure tells us otherwise.
Disclosure: I am part of TradeNation's Influencer program and receive a monthly fee for using their TradingView charts in my analyses and educational articles.

Europe and the US Sign Trade Agreement, EUR/USD DeclinesEurope and the US Sign Trade Agreement, EUR/USD Declines
The past weekend was marked by the official signing of a trade agreement between the United States and Europe, as announced by US President Donald Trump and President of the European Commission Ursula von der Leyen following their meeting in Scotland.
According to reports, the agreement is based on a 15% baseline tariff on goods exported from Europe to the United States, with certain exemptions. As previously reported, a trade agreement with a 15% baseline tariff had earlier been concluded between the US and Japan.
According to President Trump:
→ under no circumstances did he allow the baseline tariff for Europe to fall below 15%;
→ the European Union committed to investing in the US economy, purchasing weapons, and importing energy resources.
The financial markets’ reaction to this news is noteworthy:
→ European stock indices opened the week with a bullish gap, reflecting relief that previously feared tariffs of up to 30% did not materialise;
→ the EUR/USD pair is exhibiting bearish momentum this morning.
Technical Analysis of the EUR/USD Chart
As indicated by the black arrow, bearish sentiment intensified on Monday morning, pushing the pair towards the 1.1700 level, which had previously acted as resistance in mid-July.
From the perspective of the ascending channel (shown in blue), its median line is currently acting as a resistance level – following contact with it, a short-term rally was broken (highlighted in purple). This reinforces the notion that bears are currently in control.
Given the above, we could suggest that, should bearish sentiment persist on the EUR/USD chart, we may soon witness an attempt to break through the 1.1700 support level. A successful breach could open the path for further downside movement of the euro against the dollar, towards the lower boundary of the channel.
This article represents the opinion of the Companies operating under the FXOpen brand only. It is not to be construed as an offer, solicitation, or recommendation with respect to products and services provided by the Companies operating under the FXOpen brand, nor is it to be considered financial advice.

EUR/USD - Final Push Before Collapse?This EUR/USD daily chart highlights a bearish setup within a weakening rising wedge.
A Change of Character (CHoCH) confirms a potential shift in structure as price pushes toward buy-side liquidity above previous highs—where retail stops are likely resting.
Once this liquidity is swept, smart money is expected to reverse price sharply, breaking wedge support. The projected move targets the 1.03 zone, representing a 7% drop, aligning with internal liquidity and a return to the discount zone.
This setup illustrates classic SMC behavior: liquidity grabs, structural shifts, and institutional unloading before a major move.
EUR/USD – Final Push Before Collapse?

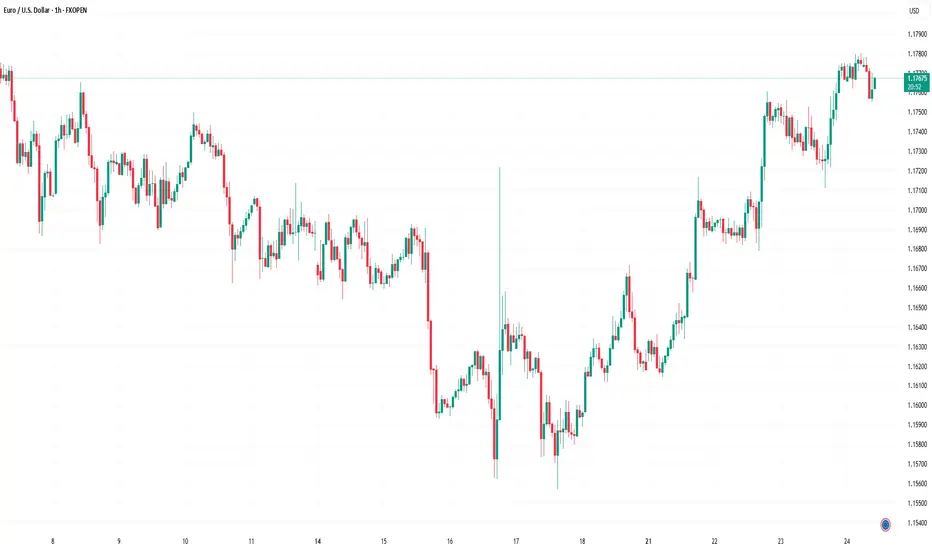
EUR/USD Rises to 2.5-Week High Ahead of ECB MeetingEUR/USD Rises to 2.5-Week High Ahead of ECB Meeting
Today at 15:15 GMT+3, the European Central Bank (ECB) will announce its interest rate decision, followed by a press conference at 15:45 GMT+3. According to Forex Factory, the main refinancing rate is expected to remain unchanged at 2.15% after seven consecutive cuts.
In anticipation of these events, the EUR/USD exchange rate has risen above the 1.1770 level for the first time since 7 July. Bullish sentiment is also being supported by expectations of a potential trade agreement between the United States and the European Union. According to Reuters, both sides are reportedly moving towards a deal that may include a 15% base tariff on EU goods entering the US, with certain exemptions.
Technical Analysis of the EUR/USD Chart
From a technical perspective, the EUR/USD pair has shown bullish momentum since June, resulting in the formation of an ascending channel (marked in blue).
Within this channel, the price has rebounded from the lower boundary (highlighted in purple), although the midline of the blue channel appears to be acting as resistance (as indicated by the arrow), slowing further upward movement.
It is reasonable to assume that EUR/USD may attempt to stabilise around the midline—where demand and supply typically reach equilibrium. However, today’s market is unlikely to remain calm. In addition to the ECB’s statements, volatility could be heightened by news surrounding Donald Trump’s unexpected visit to the Federal Reserve.
This article represents the opinion of the Companies operating under the FXOpen brand only. It is not to be construed as an offer, solicitation, or recommendation with respect to products and services provided by the Companies operating under the FXOpen brand, nor is it to be considered financial advice.
Hellena | EUR/USD (4H): LONG to the resistance area 1.18280.The previous idea was aimed at updating the maximum of 1.18280, but the correction turned out to be too deep.
Therefore, I am proposing a new idea. I believe that wave “3” has formed, and now we should see the completion of the correction in wave “4,” after which I expect to see an upward movement in wave “5.” My target is at least the high of wave “3” — the resistance area of 1.18280.
As for the correction, I think it could reach the 1.15459 area, but I recommend working with pending orders.
Manage your capital correctly and competently! Only enter trades based on reliable patterns!

EURUSD Bullish from key support at 1.17100 buyers area 📊EURUSD Bullish Forecast
1H Timeframe Analysis
EURUSD is currently respecting the ascending channel and showing bullish momentum from the key support zone at 1.17100 ✅
Buyers are stepping in strongly from this level
📌 Next Resistance Levels:
🔹1.17800 – First Resistance
🔹1.18200 – Key Resistance Zone
Outlook:
As long as price stays above 1.17100, the bullish trend remains intact.
Watching for continuation toward resistance levels inside the channel
#EURUSD

EURUSD will break the resistance ?EURUSD now facing a resistance level which was its support earlier and is now consolidating and soon may resume to higher price with target around 1.82.

EURUSD Is Bearish! Short!
Take a look at our analysis for EURUSD.
Time Frame: 2h
Current Trend: Bearish
Sentiment: Overbought (based on 7-period RSI)
Forecast: Bearish
The market is approaching a key horizontal level 1.166.
Considering the today's price action, probabilities will be high to see a movement to 1.159.
P.S
We determine oversold/overbought condition with RSI indicator.
When it drops below 30 - the market is considered to be oversold.
When it bounces above 70 - the market is considered to be overbought.
Disclosure: I am part of Trade Nation's Influencer program and receive a monthly fee for using their TradingView charts in my analysis.
Like and subscribe and comment my ideas if you enjoy them!

A POTENTIAL TREND REVERSAL Hello Traders 👋
What are your views about EURUSD
Looking at the daily timeframe we can see that price action didn't take out liquidity at the top which is indicated with a blue rectangle.
Am seeing price action retracing to that liquidity zone which is indicated with a blue rectangle and from there reversing to the downside.
Let's look at the fundamental analysis of EURUSD.
Trump announced the conclusion of a trade agreement with the EU:
The EU will invest $600 billion more in the US than before
15% tariff on EU goods, including cars
All EU countries will open their markets to the US
EU to purchase hundreds of billions of dollars worth of military equipment
EU to purchase $750 billion worth of energy from the US. Energy is a key part of the agreement.
PS:
It is worth monitoring the market reaction from the opening. Pay attention to the market reaction during different sessions.
Markets may react ambiguously, but against the general backdrop, the following reaction should be expected:
USD → sharp rise (dollar strengthening due to capital inflows and growth in energy exports).
EUR → down, as the EU will bear the costs of tariffs and rising imports from the US.
Gold → down (correction or decline due to the strengthening of the dollar and reduced demand for hedging).
BTC → neutral or slight decline (due to USD strength):
If the agreement stimulates the economy and liquidity, this could be a bullish factor for BTC.
………………………………………….
