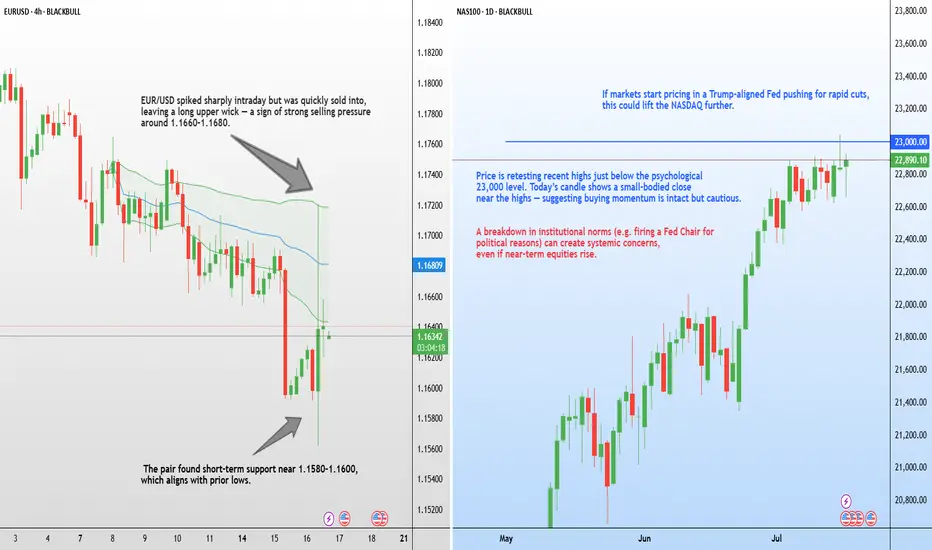
Fed warning: Rate cut rally or credibility crisis?JPMorgan and Goldman Sachs have both raised their concern about political interference at the Federal Reserve, amid reports that President Trump considered firing Fed Chair Jerome Powell earlier this week.
In a note titled “How Safe is Powell’s Job?”, JPMorgan analysts warned that even the perception of a politically motivated dismissal could undermine the Fed’s credibility and spark market volatility.
Goldman Sachs CEO David Solomon echoed the concern in a CNBC interview, describing central bank independence as “super important,” and warning that it remains a pillar of global economic stability that “we should fight to preserve.”
The warnings followed a volatile 24-hour period in markets, after reports emerged that Trump had drafted a letter to dismiss Powell and floated it among Republican leaders. This might prove the right distraction from the Epstein client list?
USDEUR trade ideas
EUR/USD Technical Outlook Daily chart frame**EUR/USD has bounced from the S1 zone (\~1.1595–1.1575)**, chart analysis
**EUR/USD Technical Outlook**
**Current Price:** \~1.1618
**Recent Action:** Rejection from S1 zone, forming a potential base.
**Bullish Scenario (Active)**
The pair has bounced from key **S1 support** (1.1595 area), suggesting demand is present.
**If momentum holds:**
* **Immediate Target 1:** 1.1645 (Fibonacci + 21 EMA)
* **Target 2:** 1.1665–1.1685 zone (7 EMA + minor resistance)
* **Target 3:** 1.1725 (R1 zone and mid-July resistance)
* Breakout above R1 would shift momentum firmly bullish.
*Watch for bullish continuation candles and rising volume.*
**Bearish Risk (Still Possible)**
* If the bounce stalls near **1.1645–1.1665**, and the pair reverses:
* A drop back toward **1.1595–1.1575** support could occur again.
* Break below that zone would expose:
* **S2 support at 1.1510**
* Possibly extend to **1.1475** in case of stronger USD demand
Summary:
* **Bounce from S1** shows initial bullish strength.
* **Key resistance to break:** 1.1645–1.1685 for bullish continuation.
* **Key support to hold:** 1.1595–1.1575 to avoid deeper correction.

trade idea fulfilledi expected EU to take out the eh above, get into the fvg and then sell off. it has done just that
EUR USD shortThis is not my original idea. I took some advice and looked at other ideas, so I decided to come up with a short one. Let's see what happens.
Please note: This is for educational purposes only and not a trading signal. These ideas are shared purely for back testing and to exchange views. The goal is to inspire ideas and encourage discussion. If you notice anything wrong, feel free to share your thoughts. In the end, to learn is to share !

EURUSD: The Market Is Looking Down! Short!
My dear friends,
Today we will analyse EURUSD together☺️
The in-trend continuation seems likely as the current long-term trend appears to be strong, and price is holding below a key level of 1.15850 So a bearish continuation seems plausible, targeting the next low. We should enter on confirmation, and place a stop-loss beyond the recent swing level.
❤️Sending you lots of Love and Hugs❤️

EURUSD My Opinion! BUY!
My dear friends,
Please, find my technical outlook for EURUSD below:
The price is coiling around a solid key level - 1.1584
Bias - Bullish
Technical Indicators: Pivot Points Low anticipates a potential price reversal.
Super trend shows a clear buy, giving a perfect indicators' convergence.
Goal - 1.1670
Safe Stop Loss - 1.1546
About Used Indicators:
The pivot point itself is simply the average of the high, low and closing prices from the previous trading day.
Disclosure: I am part of Trade Nation's Influencer program and receive a monthly fee for using their TradingView charts in my analysis.
———————————
WISH YOU ALL LUCK
Euro Steady, EU Prepares $84B RetaliationEUR/USD hovered near 1.1670 in Tuesday’s Asian session as markets awaited US-EU trade updates. Despite Trump’s 30% tariff announcement on EU imports, he confirmed that negotiations with Brussels are ongoing ahead of the August 1 deadline. According to Bloomberg, the EU is ready to respond with proportional tariffs targeting $84B (€72B) worth of US goods, including Boeing jets, bourbon, cars, and machinery.
Resistance for the pair is at 1.1715, while support is at 1.1645.
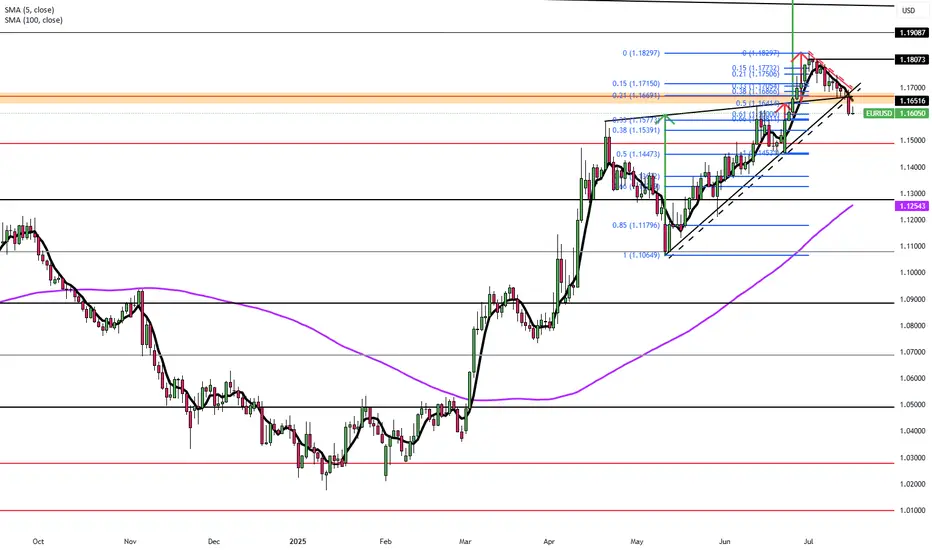
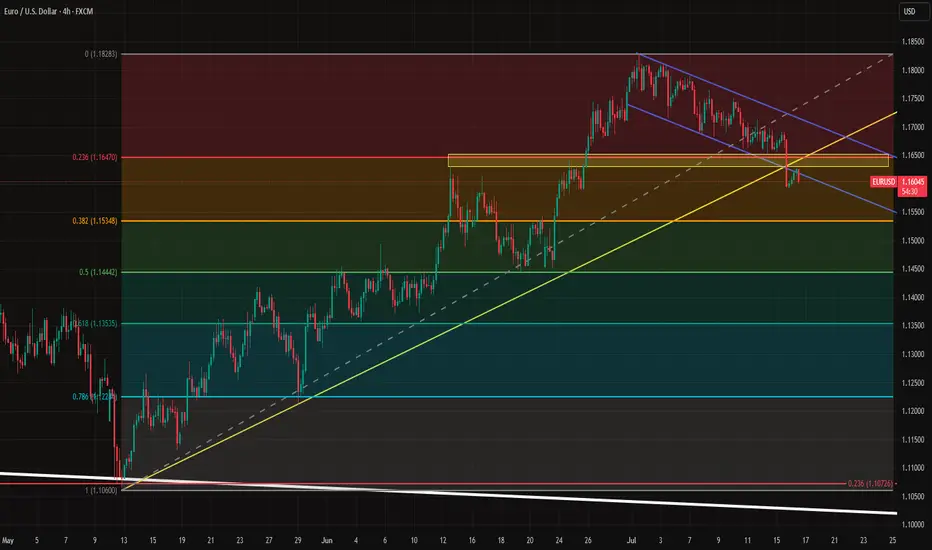
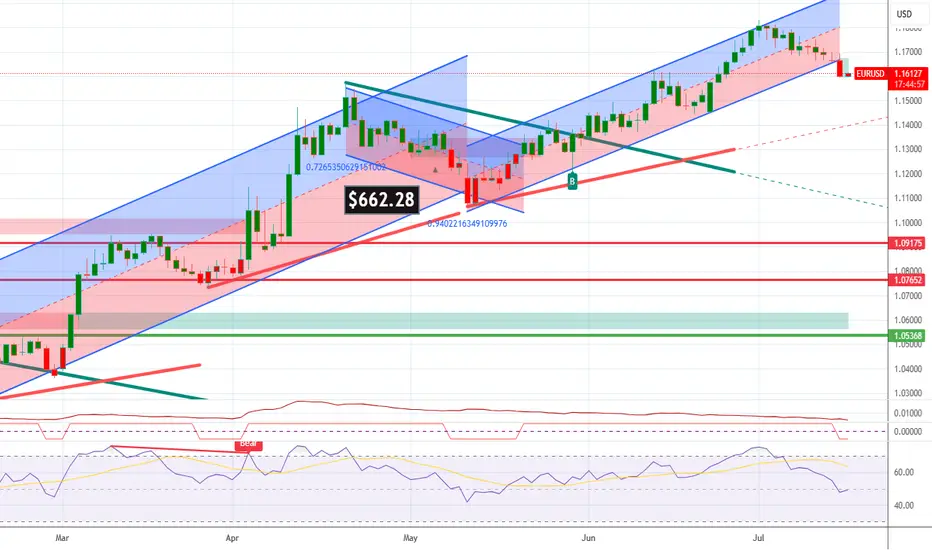
EURUSD Under Pressure as Macro Divergence WidensEURUSD is facing renewed downward pressure after rallying from 1.02 to 1.18 in a strong multi-month move. However, diverging inflation expectations between the EU and the U.S. are now weighing heavily on the pair.
One major signal comes from real yields. The Germany–U.S. 10-year real yield spread currently sits at -1.1182, the same level seen during the 2024 top near 1.11 and the 2023 top near 1.10. By that measure, EURUSD appears expensive. Over the past five years, 69% of EURUSD’s moves can be statistically explained by this real yield spread, making it a key macro indicator.
Inflation expectations are also diverging. The U.S. 5y5y inflation swap is trending upward, while the EU’s equivalent has remained flat. This suggests the Fed may keep rates elevated for longer than initially expected.
Beyond bond market dynamics, the August 1 tariff deadline is approaching with no deal in sight. In fact, tensions are rising, as the EU prepares possible countermeasures targeting $84 billion worth of U.S. goods. Adding to the pressure, political risk in France is building due to ongoing budget negotiations.
Technically, the recent break of both the uptrend (yellow) and the downtrend channel was significant. Euro bulls now need to reclaim and hold above 1.1660 to avoid deeper losses. If they fail, 1.1445 could become the next key support level, with further downside possible depending on how the news develops.
EURUSD SHORT SETUP4hour structure is extremely bearish creating series of lower lows and lower highs.
Couple with the fact that GBPUSD is also bearish, while DXY is bullish.
So, I expect price to move lower and break the major swing low below price.


EURUSD: Deeper Pullback Before Bullish MoveHello Traders,
On EURUSD, we opened the new week with a significant downside gap, which has already been filled during the Asian session. Price has reacted from that gap area, and heading into the London session, I’m expecting a deeper pullback into the daily demand zone before the bullish continuation.

check the trendConsidering the price behavior in the current support area, possible scenarios have been identified. It is expected that a trend change will form in the current support area and we will see the start of an upward trend.
If the price passes the support area, the continuation of the downward trend will be likely.

EURUSD TRIGGERED STOP LOSSTRADING IDEA UPDATE - EURUSD TRIGGERED STOP LOSS
The U.S. CPI report data came out right what the market expected (2.7% vs. 2.7% annually). After this report the pair went downwards on increased volume, triggering my stop loss and found the support only on 4-h sma200 and 1.16000 level.
What will be the possible scenario next?
I assume that the asset will go testing the trendline at 1.16650. If the test is successful, I will consider opening a
🔽 a pending sell stop order at 1.16651 with
❌a stop loss at 1.18180 and
🤑a take profit at 1.15122
Only if the retest is successful, not earlier! Let's observe first. Additionally, today is the U.S. PPI report coming out at 12:30 p.m. UTC, so got to be careful around this time
July 15 2025 -Sell Limit ActivatedGood day, folks!
Just sharing another learning from my ideas here:
EURUSD has been in a bearish structure since July 14, 2025 (1H Intraday). As you know, I always look for clear supply or demand validation before placing a sell or buy limit order. On the chart, you can see a valid supply zone that was generated on Monday. After that, I waited for a clear move during the Tuesday London and New York sessions, with the CPI news release acting as a catalyst for more volatility. The trade came to fruition during the New York session on Tuesday. (See chart for the complete breakdown of the movement and entry.)
RR: 1:3
Another Wyckoff schematics and structure analysis.

Expecting an upward move for EURUSD After the EURUSD decline, we expect EURUSD to move higher from this range and see an upward leg. Now there are two scenarios! The first scenario is that the price goes up without a direct correction, and the second scenario is that the price first makes a small correction and gives us more confirmation to enter BUY.

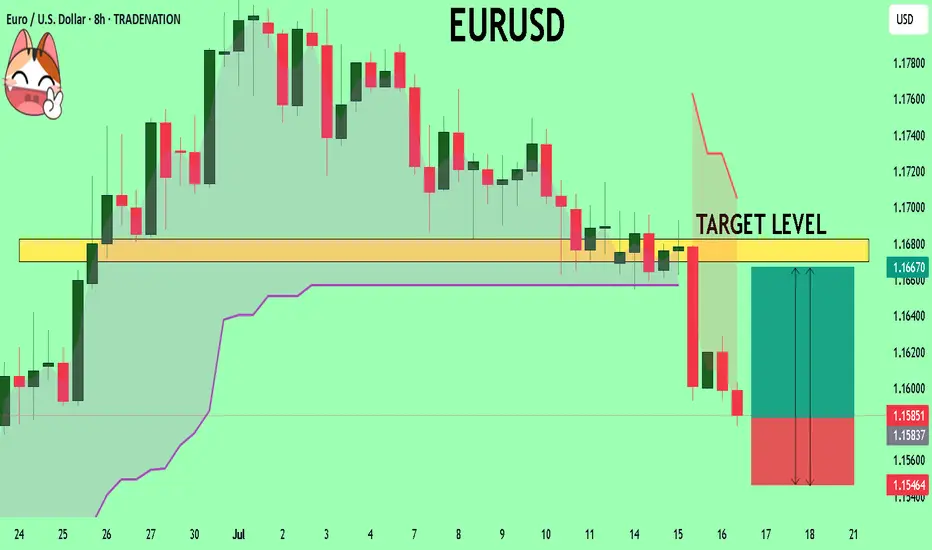
Eyes on 1.16300: EUR/USD Prepares for the Next Move.📉 EUR/USD Technical 📈
The pair has broken a strong support level and is now finding footing around 1.15970, forming a fresh bullish Fair Value Gap (FVG) at this zone.
At the moment, EUR/USD is moving within a bearish FVG. Here's what to watch next:
🔻 If the market dips from here, we could see a reversal from the lower edge of this FVG.
🔼 But if it holds and pushes higher, breaking above 1.16300 — the CE (Continuity Equation) level of the bearish FVG — that could unlock further bullish momentum.
🚨 Key Levels to Watch:
Support: 1.15970
Resistance/Breakout Zone: 1.16300
📊 Stay alert — price action at these levels could define the next move.
👉 DYOR – Do Your Own Research
📌 Not financial advice.

EURUSD at Daily Demand After CPI – Bullish Setup in PlayHello Traders,
I hope everyone is having a fantastic week!
Today on EURUSD, price is trading within the daily flip demand zone following yesterday’s USD CPI news release. While I usually avoid trading during CPI events due to the high volatility and unpredictable price spikes—often driven by algorithms and emotional retail reactions—yesterday did present a valid short opportunity.
Now that price is back in the daily demand zone, a bullish setup using lower time frame (LTF) confirmation offers a high-probability trade. We could see a decent push up toward the nearby daily supply zone.

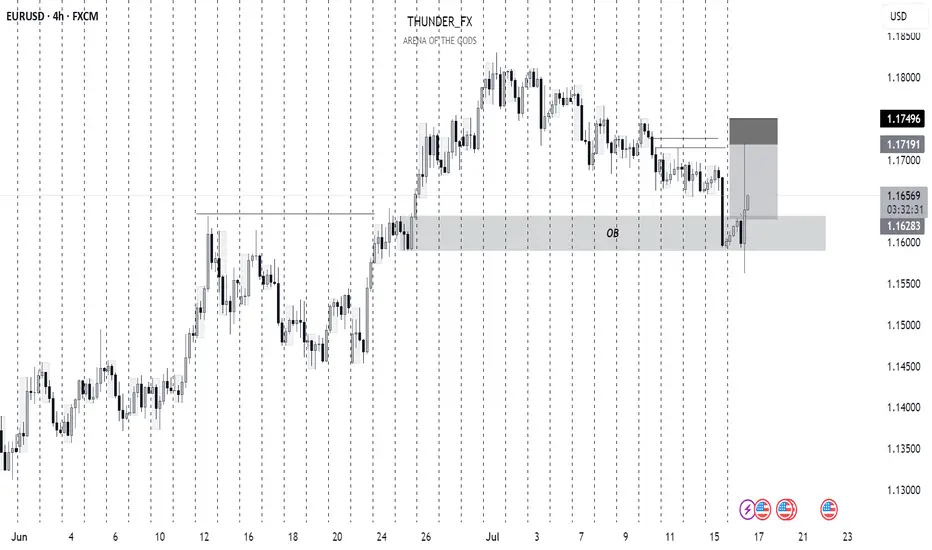
Eurousd techinical analysis.This chart of EUR/USD (Euro / U.S. Dollar) on the 3-hour timeframe includes several technical elements:
Key Elements Identified:
1. Descending Channel (Blue & Red Area):
Price was moving within a descending trend channel, indicating a bearish trend.
2. Breakout Above Trend Line:
The price has broken out of the descending trend line ("Trande line" — which is likely a typo for "Trend line"), suggesting potential bullish reversal.
3. FVG (Fair Value Gap):
This marks an imbalance in price action where the price moved too rapidly, often leading to a retracement or revisit. It could be used as a liquidity target for price to fill.
4. O.B (Order Block):
An order block represents a strong area of institutional buying/selling. Price appears to have reacted from this bullish order block, initiating the recent upward move.
5. Measurement Box (0.55% / 63.3 pips):
Indicates the expected or measured move from the O.B. to the FVG level.
6. Horizontal Support and Resistance Levels:
Marked in purple, showing recent consolidation or price reaction

EUR/USD 4-Hour Chart (OANDA)4-hour performance of the Euro/US Dollar (EUR/USD) currency pair on the OANDA platform as of July 10, 2025. The current exchange rate is 1.16920, reflecting a 0.25% decrease (-0.00298). The chart includes a candlestick representation with a highlighted resistance zone between 1.1692 and 1.17477, and a support zone around 1.16523. Buy and sell signals are marked at 1.16927 and 1.16912, respectively, with a spread of 1.5 pips.


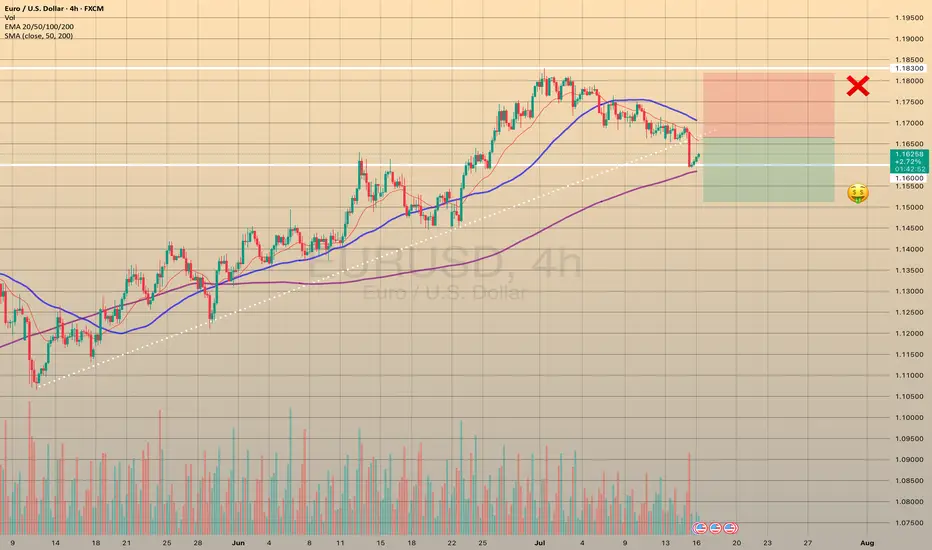
Potential Bearish Setup on EURUSDBearish Breakdown Setup
Summary
Analysing Price action from yesterday we have got a very nice distribution leg push that broke down below our accumulation zone a good indication of downside momentum, therefore the anticipation is that price will retest our BOS an ideal zone to look for bearish setups.
📉 EURUSD Daily Breakdown Potential setup
🔴 Distribution leg: 1.16921 - 1.15924
📉 Sell Below: 1.16540 (Confirmed Break)
🎯 Target 1: R:R 1:2
🎯 Target 2: R:R 1:3
🎯 Target 3: R:R 1:4
🛑 Stop Loss: Above Resistance Zone
🔍 Watch: Failure to break back in = Confirmation
LIKE or COMMENT if this idea sparks your interest, or share your thoughts below!
FOLLOW to keep up with fresh ideas.
Tidypips: "Keep It Clean, Trade Mean!"

EUR USD SHORT RESULT Eur Price reached and fake out of the Major resistance range and I predicted a Bearish reversal and price moved according to our precision and TP Done ✅
_THE_KLASSIC_TRADER_.🔥
