EURUSD Will Go Down! Short!
Please, check our technical outlook for EURUSD.
Time Frame: 3h
Current Trend: Bearish
Sentiment: Overbought (based on 7-period RSI)
Forecast: Bearish
The price is testing a key resistance 1.161.
Taking into consideration the current market trend & overbought RSI, chances will be high to see a bearish movement to the downside at least to 1.155 level.
P.S
Please, note that an oversold/overbought condition can last for a long time, and therefore being oversold/overbought doesn't mean a price rally will come soon, or at all.
Disclosure: I am part of Trade Nation's Influencer program and receive a monthly fee for using their TradingView charts in my analysis.
Like and subscribe and comment my ideas if you enjoy them!
USDEUR trade ideas

Buy EUR USD from Pivoton higher charts like 1D price seems in an uptrend so I would look to open a Long position
price is now correction to Monthly pivot line which could be good RR

EURUSD Will Go Lower! Sell!
Here is our detailed technical review for EURUSD.
Time Frame: 4h
Current Trend: Bearish
Sentiment: Overbought (based on 7-period RSI)
Forecast: Bearish
The market is approaching a significant resistance area 1.168.
Due to the fact that we see a positive bearish reaction from the underlined area, I strongly believe that sellers will manage to push the price all the way down to 1.159 level.
P.S
Please, note that an oversold/overbought condition can last for a long time, and therefore being oversold/overbought doesn't mean a price rally will come soon, or at all.
Disclosure: I am part of Trade Nation's Influencer program and receive a monthly fee for using their TradingView charts in my analysis.
Like and subscribe and comment my ideas if you enjoy them!

EURUSD(20250718) Today's AnalysisMarket news:
① Kugler: It is appropriate to keep the interest rate policy stable for "a while".
② Daly: Whether to cut interest rates in July or September is not the most critical.
③ Bostic: It may be difficult to cut interest rates in the short term.
Technical analysis:
Today's buying and selling boundaries:
1.1597
Support and resistance levels:
1.1683
1.1651
1.1630
1.1565
1.1544
1.1512
Trading strategy:
If the price breaks through 1.1630, consider buying in, the first target price is 1.1651
If the price breaks through 1.1597, consider selling in, the first target price is 1.1565

EURUSD- Bearish momentum expected at 15 minute Time frameEURUSD Bearish momentum Bearish momentum Expected based on market making perfect TBS and Model 1 at the strong PRZ level as indicated by RSI also. accordingly Expecting atleast 50% target hit as TP1 and then 100% :) cheers . have a blessed friday.

EURUSD on the riseAfter Wednesday’s volatile spike, the market calmed down yesterday, with EURUSD holding above the support zone.
We’re seeing signs of a potential bottom forming — confirmation of this could open the door for a fresh move higher.
The goal remains to follow the bullish trend, but keep an eye out for signs of exhaustion and a possible pullback.
Stay flexible and ready to adapt!

EUR/USD Weekly AMD Breakdown | VolanX Protocol Signal
🧠 EUR/USD Weekly AMD Breakdown | VolanX Protocol Signals Distribution Phase Active
📍 EUR/USD | 1W Chart
📅 July 17, 2025
🧭 Structured by: WaverVanir International LLC
🔗 Powered by VolanX Protocol + DSS Architecture
🧨 Strategic Context:
This isn’t a random retracement—it’s the completion of a full AMD cycle (Accumulation → Manipulation → Distribution), and EUR/USD just exited the manipulation high, confirming the start of a long-term markdown phase.
🧠 Pattern Alignment:
✅ Green Box = Accumulation Zone (Rangebound 2023–early 2025)
🔶 Orange Box = Manipulation Trap (Spring sweep + emotional lows)
⚠️ Grey Box = Distribution (Fast repricing into liquidity pockets)
🔻 Red Line = Markdown begins
Embedded schematic confirms the AMD logic.
This is how institutions engineer macro turns.
📉 VolanX Bearish Targets (2025–2026 Outlook):
🎯 First Target: 1.1022 – Fibonacci & OB confluence
🎯 Secondary Target: 1.0828 – Elliott Wave 3 full extension
🎯 Macro Target: 0.9500 – 2026 narrative climax zone
“Distribution is never announced; it’s only visible in hindsight. But VolanX sees it unfolding in real time.”
⚠️ Invalidations:
A weekly close back above 1.1850 would void this structure.
Momentum confirmation pending from macro catalysts (ECB dovish, Fed delay).
🎯 Trade Strategy:
Bias: Strong short
Entry Zone: Any rally into 1.1700–1.1800 = premium rejection zone
Execution: Build position in tranches, use volume spikes & SMC CHoCHs as confirmation
Risk: Tight stop above 1.1850 (structure invalidation)
🔐 VolanX Strategic Note:
📡 The model confirms that EUR/USD is entering a structurally engineered distribution phase, driven by smart money exit flows, macro policy divergence, and a resurgent USD.
Wave (3) compression is already under way. This is where conviction counts.
⚠️ Educational content only. Not financial advice.
#EURUSD #AMD #SmartMoney #MacroTrading #VolanX #WaverVanir #ForexStrategy #LiquidityTrap #DSS #DistributionPhase

EURUSD H1 I Bearish Reversal Based on the H1 chart, the price is approaching our sell entry level at 1.1641,an overlap resistance.
Our take profit is set at 1.1601, a pullback support.
The stop loss is set at 1.1670, a swing high resistance.
High Risk Investment Warning
Trading Forex/CFDs on margin carries a high level of risk and may not be suitable for all investors. Leverage can work against you.
Stratos Markets Limited (tradu.com ):
CFDs are complex instruments and come with a high risk of losing money rapidly due to leverage. 66% of retail investor accounts lose money when trading CFDs with this provider. You should consider whether you understand how CFDs work and whether you can afford to take the high risk of losing your money.
Stratos Europe Ltd (tradu.com ):
CFDs are complex instruments and come with a high risk of losing money rapidly due to leverage. 66% of retail investor accounts lose money when trading CFDs with this provider. You should consider whether you understand how CFDs work and whether you can afford to take the high risk of losing your money.
Stratos Global LLC (tradu.com ):
Losses can exceed deposits.
Please be advised that the information presented on TradingView is provided to Tradu (‘Company’, ‘we’) by a third-party provider (‘TFA Global Pte Ltd’). Please be reminded that you are solely responsible for the trading decisions on your account. There is a very high degree of risk involved in trading. Any information and/or content is intended entirely for research, educational and informational purposes only and does not constitute investment or consultation advice or investment strategy. The information is not tailored to the investment needs of any specific person and therefore does not involve a consideration of any of the investment objectives, financial situation or needs of any viewer that may receive it. Kindly also note that past performance is not a reliable indicator of future results. Actual results may differ materially from those anticipated in forward-looking or past performance statements. We assume no liability as to the accuracy or completeness of any of the information and/or content provided herein and the Company cannot be held responsible for any omission, mistake nor for any loss or damage including without limitation to any loss of profit which may arise from reliance on any information supplied by TFA Global Pte Ltd.
The speaker(s) is neither an employee, agent nor representative of Tradu and is therefore acting independently. The opinions given are their own, constitute general market commentary, and do not constitute the opinion or advice of Tradu or any form of personal or investment advice. Tradu neither endorses nor guarantees offerings of third-party speakers, nor is Tradu responsible for the content, veracity or opinions of third-party speakers, presenters or participants.

eurusd RBR EURUSD Daily Demand Zone Trade Idea
This is an educational analysis based on a daily timeframe structure using supply and demand principles.
Price recently made a strong bullish impulsive move, breaking above previous highs. We’re now seeing a retracement into a fresh Daily Demand Zone formed by a Rally-Base-Rally (RBR) structure. This zone also sits outside of fair value, indicating a potential area of institutional interest.
Marked Demand Zone: 1.16127 area
Stop Loss Level: Below the zone at ~1.15667
Target: Prior swing high near 1.17505
Risk-Reward Ratio: 1:3
Bias: Bullish continuation, assuming the zone holds

EURUSD BUY?Market is overall bullish on daily and weekly. Based on 4HR TF, the market seems to be forming a possible reversal pattern which could lead to a possible reversal.
We could see BUYERS coming in strong should the current level hold.
Disclaimer:
Please be advised that the information presented on TradingView is solely intended for educational and informational purposes only.The analysis provided is based on my own view of the market. Please be reminded that you are solely responsible for the trading decisions on your account.
High-Risk Warning
Trading in foreign exchange on margin entails high risk and is not suitable for all investors. Past performance does not guarantee future results. In this case, the high degree of leverage can act both against you and in your favor

EURUSD | Bullish EURUSD has printed bullish divergence on one hour timeframe.It is already bullish on daily as well four hour timeframe bigger.Moreover,on candles chart it has formed a double bottom formation which also indicates a bullish reversal.

EURUSD Bullish Continuation OutlookFX:EURUSD has been trading in a bullish trend. Currently price is retesting the previous resistance level, as well as 0.618 fib. Hidden bullish divergence can be observed on the chart, in addition to regular bullish divergence on lower timeframes (1 & 4 hour).
I am expecting bullish continuation from here to complete the price projections!

Eurousd techinical analysis.Eurousd techinical analysis next move posibale at h1 time frame.not finchinal advice.

EUR/USD Bearish Setup as Wave C Unfolds Toward 1.1523EUR/USD Bearish Setup as Wave C Unfolds Toward 1.1523
🔴 SHORT BIAS
📅 Updated: July 18
---
🔍 Description
EUR/USD appears to be unfolding a classic ABC corrective structure, with Wave B now likely completed below the key 1.1624–1.1659 resistance zone. The price action has shown clear rejection in this supply area, opening room for Wave C to extend lower toward the 1.1523 target.
This setup aligns with a broader correction within a downtrend, with technicals and short-term flows pointing toward further downside pressure. The 2H timeframe offers swing traders a favorable risk-reward scenario, with invalidation clearly above 1.1659.
---
📊 Technical Structure (2H)
✅ Wave A completed
✅ Wave B rejected at resistance
✅ Wave C expected to unfold
📌 Downside Target
First & Final: 1.15233
🔻 Invalidation Zone
Above: 1.16590 (Break invalidates short bias)
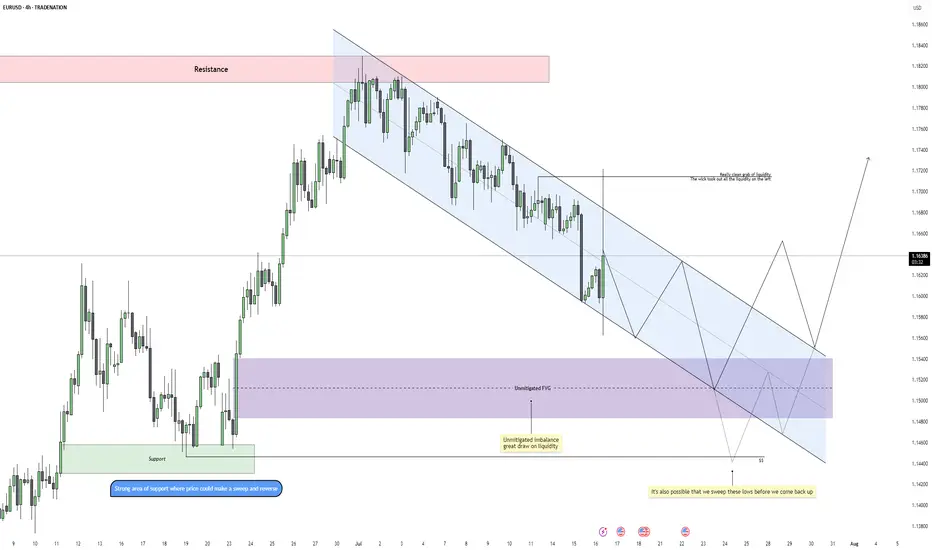
EURUSD – Bearish Rhythm ContinuesEURUSD is currently moving within a well-defined descending channel on the 4H timeframe, maintaining a consistent pattern of lower highs and lower lows. This confirms that bearish order flow remains intact, especially after the recent rejection from the upper boundary of the channel. The previous move up was largely a liquidity grab, taking out short-term highs before swiftly reversing, which adds confluence to a continuation lower.
Liquidity and Imbalance Zones
After sweeping some upside liquidity near 1.1670, price left behind a clean set of equal lows and an unmitigated fair value gap (FVG) sitting below, acting as a magnet. The purple zone marks this FVG, which is likely to be the next area of interest for price as it aligns with the midpoint of the channel and previous demand. Below that, there’s also a clear support region with resting liquidity, giving price a solid reason to reach deeper before reversing.
Projected Path and Channel Dynamics
As long as we remain inside the current bearish channel, we should expect price to respect the internal structure and continue pushing lower. The expectation is for price to trickle down through lower highs and lower lows, tapping into the FVG and potentially sweeping the lows beneath it. The projected internal path mimics this staircase-style movement down before any potential reversal can happen.
Reversal Zone and Bullish Scenario
If price does sweep the lows around 1.1450 and fills the imbalance cleanly, this would create ideal conditions for a bullish reversal. A reaction from this zone could lead to a break of the channel structure, initiating a shift in market sentiment. The upside target, in that case, would be the clean area around 1.1700 where previous liquidity was removed but not yet retested.
Short-Term Expectation
In the short term, the path of least resistance remains bearish. The most probable scenario is a continuation down into the FVG and potential liquidity sweep before we see any meaningful upside. Any premature breakout from the channel without first collecting this liquidity would be viewed as a weak move lacking proper fuel.
Conclusion
EURUSD remains technically bearish while inside the descending channel. Liquidity has been taken on the upside, and the path is now open to target unmitigated imbalances and resting lows. A full sweep into the FVG area could provide the setup for a clean reversal, but until then, trend continuation is favored.
Disclosure: I am part of Trade Nation's Influencer program and receive a monthly fee for using their TradingView charts in my analysis.
___________________________________
Thanks for your support!
If you found this idea helpful or learned something new, drop a like 👍 and leave a comment, I’d love to hear your thoughts! 🚀
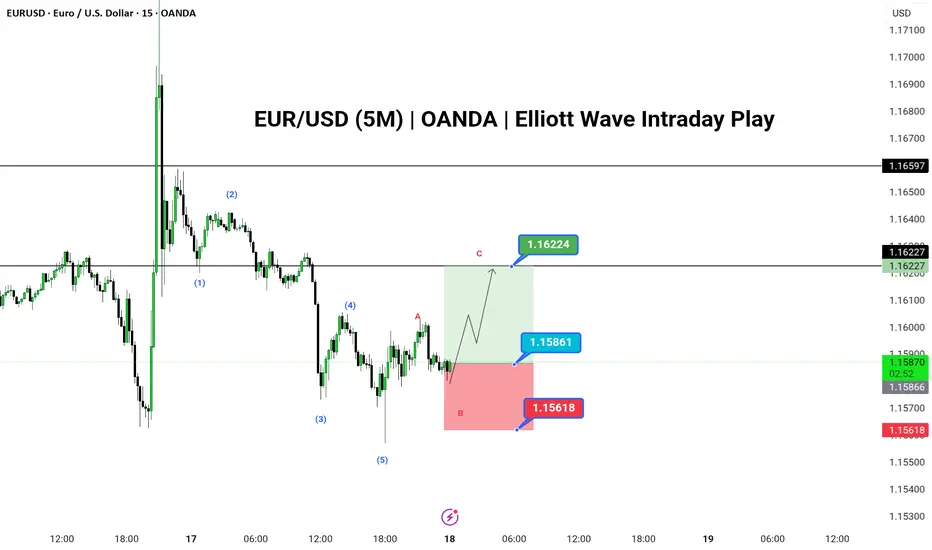
EUR/USD Bullish Setup in Progress as Wave C Targets 1.1622
🟢 LONG BIAS
📅 Updated: July 16
EUR/USD has completed a clean 5-wave impulse structure to the downside, followed by an unfolding ABC corrective pattern on the 5-minute chart. With Wave A and the ongoing B leg nearing completion, bulls may look to capitalize on a Wave C rally toward the 1.1622 resistance zone.
The structure suggests a temporary bullish move within a broader correction. Entry near the 1.1586 level offers a solid R:R setup, with invalidation below 1.1561. This setup is ideal for short-term intraday traders using Elliott Wave theory and expecting a 3-wave corrective rally.
---
📊 Technical Structure (5M)
✅ 5-wave bearish impulse labeled (1)-(5) complete
✅ ABC correction developing (currently in Wave B)
✅ Potential for bullish continuation via Wave C
📌 Upside Target
✅ Final: 1.16224
🔻 Risk Zone
❌ Invalidation: Below 1.15618
---
📈 Market Context
USD Consolidation: Dollar index pauses after strong rally, offering intraday relief to majors.
Euro Support: Mild bid across EUR crosses, offering stability in low-timeframe setups.
No High-Impact News: Ideal technical environment for short-term wave trading.
---
⚠️ Risks to Watch
Breakdown below 1.1561 would invalidate the structure.
Sudden volatility from unscheduled news.
Failure of Wave C to reach projected resistance.
---
🧭 Summary: Bias and Watchpoints
EUR/USD is setting up for a potential Wave C move toward 1.1622 as the ABC corrective structure plays out. Bullish bias holds above 1.1561 with a high-probability setup unfolding for short-term wave traders. Watch for price reaction near 1.1586 and use tight risk control.
EURUSD BUY SOONEUR/USD extends its daily slide and trades deep in the red below 1.1600 in the American session on Thursday. The US Dollar (USD) benefits from the better-than-expected Jobless Claims and Retail Sales data, not allowing the pair to hold its ground.

Bearish breakout off major support?EUR/USD is reacting off the support level which is an overlap support that lines up with the 61.8% Fibonacci retracement and a breakout of this level could lead the price to drop from this level to our take profit.
Entry: 1.1587
Why we like it:
There is an overlap support level that lines up with the 61.8% Fibonacci retracement.
Stop loss: 1.1666
Why we like it:
There is an overlap resistance.
Take profit: 1.1451
Why we like it:
There is an overlap support level that lines up with the 61.8% Fibonacci retracement.
Enjoying your TradingView experience? Review us!
Please be advised that the information presented on TradingView is provided to Vantage (‘Vantage Global Limited’, ‘we’) by a third-party provider (‘Everest Fortune Group’). Please be reminded that you are solely responsible for the trading decisions on your account. There is a very high degree of risk involved in trading. Any information and/or content is intended entirely for research, educational and informational purposes only and does not constitute investment or consultation advice or investment strategy. The information is not tailored to the investment needs of any specific person and therefore does not involve a consideration of any of the investment objectives, financial situation or needs of any viewer that may receive it. Kindly also note that past performance is not a reliable indicator of future results. Actual results may differ materially from those anticipated in forward-looking or past performance statements. We assume no liability as to the accuracy or completeness of any of the information and/or content provided herein and the Company cannot be held responsible for any omission, mistake nor for any loss or damage including without limitation to any loss of profit which may arise from reliance on any information supplied by Everest Fortune Group.

"EUR/USD Reversal Setup: Breakout Potential from Descending ChanThis EUR/USD 4-hour chart shows a potential bullish reversal from a descending channel. Price is approaching a key support area around 1.15621, with a projected breakout targeting the 1.16940–1.17199 resistance zone. The chart suggests a possible upward move if support holds.

EURUSD BUY IDEAWe can anticipate buy setup on EURUSD to close up those imbalance caused my yesterday's news.

MSFT longThis is a After a strong pullback and a clear rejection at key support levels, the EUR/USD pair is showing signs of a potential reversal. Technical indicators suggest oversold conditions, making this an attractive entry for bullish traders.
🎯 Entry: Around 1.15873
🛑 Stop Loss: Below 1.19700
💰 Take Profit: 1.0750 – 1.14385
Always trade with proper risk management and confirm with your own analysis!good trade

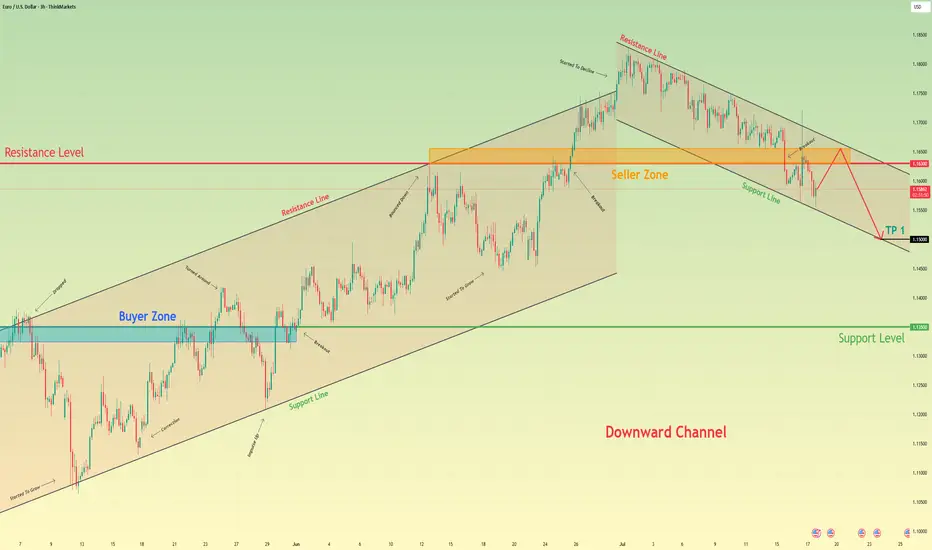
Euro may reach seller zone and then continue to fall in channelHello traders, I want share with you my opinion about Euro. The price pair has recently shifted its market structure, establishing a clear downward channel after breaking its previous uptrend. Before this breakdown, the price was consistently trading within an Upward Channel, repeatedly finding support in the buyer zone (1.1325–1.1350) and reversing upward. The bullish momentum eventually faded when the price failed to break the major horizontal resistance level at 1.1630. This failure triggered a strong bearish impulse, leading to a decisive breakout below the channel's support line and confirming a trend reversal. Currently, the price is making a corrective move up inside the newly formed downward channel, which appears to be a classic retest of the broken structure from below. I expect this upward move to stall as it approaches the heavy confluence of resistance formed by the channel's upper Resistance Line and the horizontal seller zone at 1.1630–1.1655. After testing this area, I anticipate a rejection and the beginning of a new bearish leg down. That's why I've set my TP at the 1.1500 level — it aligns perfectly with the support line of the current downward channel, making it a logical target for sellers. Please share this idea with your friends and click Boost 🚀
Disclaimer: As part of ThinkMarkets’ Influencer Program, I am sponsored to share and publish their charts in my analysis.
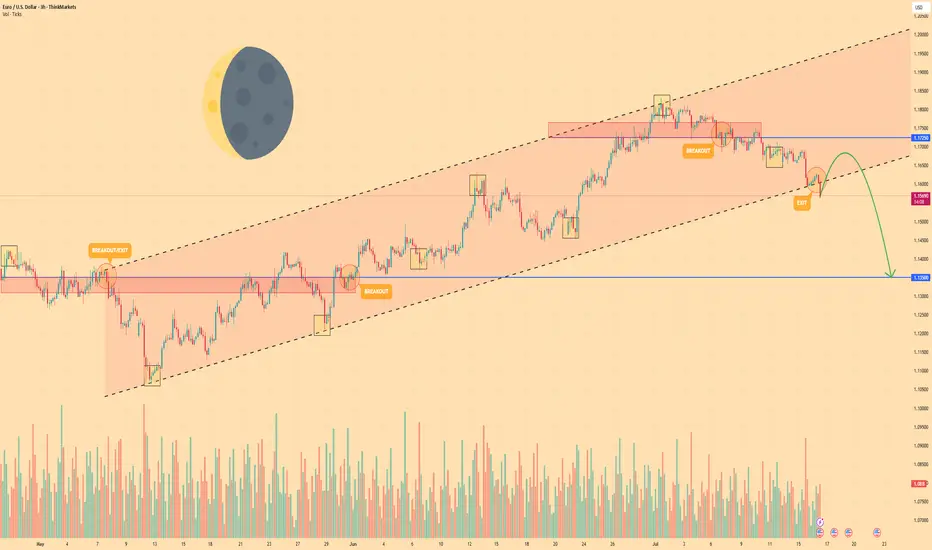
EURO - Price may drop to $1.1350 support level Hi guys, this is my overview for EURUSD, feel free to check it and write your feedback in comments👊
Euro began its journey by breaking into a rising channel off the swing low near $1.1080, establishing a clear uptrend.
Within this channel, price carved out steady support along the lower trendline, touching $1.1350 before buyers stepped.
Mid-channel, two breakout attempts at $1.1550 and $1.1725 highlighted bullish conviction, yet both retreated back below resistance.
Simultaneously, two exit signals appeared near the upper trendline around $1.1765, showing that upward momentum was losing steam at key inflection points.
Currently, EUR is holding just below the channel base after a minor bounce, consolidating as traders weigh the next move.
I foresee a brief climb toward near $1.1670 before a renewed bearish thrust drives price back down to test $1.1350 level.
If this post is useful to you, you can support me with like/boost and advice in comments❤️
Disclaimer: As part of ThinkMarkets’ Influencer Program, I am sponsored to share and publish their charts in my analysis.