German CPI flatlines, eurozone CPI nextThe euro is up for an eighth consecutive day and has gained 2.4% during that time. In the North American session, EUR/USD is trading at 1.1738, up 0.36% on the day.
German inflation data on Monday pointed to a weakening German economy. The CPI report indicated that the deflationary process slowly continues. The inflation rate for June came in at 0% m/m, down from 0.1% in May and below the consensus of 0.2%. Annually, inflation dropped to 2.0% from 2.1% and below the consensus of 2.1%. The eurozone releases its CPI report on Tuesday.
Inflation has been dropping in small increments and has now fallen to the European Central Bank's inflation target of 2%. The ECB cut the deposit rate to 2.0% earlier in June and meets next in July. Although eurozone inflation is largely contained, there are concerns about the impact that US tariffs and counter-tariffs by US trading partners could have on the inflation picture. The ECB is likely to maintain rates in July but could lower rates in September if disinflation continues.
The US continues to show signs that the economy is slowing down. Last week, GDP was revised downwards to -0.5% in the first quarter. This was followed by US consumer spending for May (PCE) which posted a 0.1% decline, following a 0.2% gain in April and shy of the consensus of 0.1%. This was the first contraction since January. If economic data continues to head lower, pressure will increase on the Federal Reserve to lower interest rates, which isn't expected before the September meeting.
EUR/USD is testing resistance at 1.1755. Above, there is resistance at 1.1791
1.1718 and 1.1682 are the next support levels
USDEUR trade ideas

eurusd outlook Eurusd overall bullish HTF, however I do identify alignments within wyckoff distribution. Keeping an eye on the 4hr sponsored candle, ltf fvg at 1.62 area for my next possible bullish swing into the weekly high. Until then let's see if the market can support short term bearish reversal into the area of interest.

EUR/USD BUY IDEA - SMT WITH GBPHere's my analysis , let me share my A+ set up with you :
1 - WAIT ON ASIA LOW SWEEP WITH EUR / USD
2 - WE WILL POTENTIALLY HAVE A SMT WITH GBP USD IF WE SWEEP ASIA LOW
3 - WAIT ON BOS + FVG IN 5 MIN TIME FRAME
4 - TARGET PREVIOUS WEEK HIGH AS DRAW ON LIQUIDITY
This is what I see happening . After full take profit, we will have our new Weekly Protected High I believe and from there we can start targeting Sellside Liquidity .
I hope you enjoyed the analysis , I will post updates during the day .
Talk to you guys soon ! =D

EURUSDased on the information from various financial news and analysis sources, EURUSD appears to be on an upward trend. Here's a summary of the key points:
Overall Sentiment:
Many analyses suggest a bullish outlook for EUR/USD, with the pair holding substantial gains and hinting at higher highs.
Euro will make correction to support line of channelHello traders, I want share with you my opinion about Euro. In this chart, we can see how the price entered to triangle, where it at once bounced from the support line and rose to the 1.1100 support level, which coincided with the buyer zone. Soon, price broke this level, after a small correction, and continued to move up to the 1.1575 current support level, which coincided with the support area. This area also coincided with the resistance line of the triangle, and the Euro rebounded from this line and started to decline. In a short time, it declined to the buyer zone, where it turned around and started to move up. Soon, Euro exited from triangle and continued to rise inside an upward channel, where it made a correction first and then continued to grow. Later, EUR rose to 1.1575 current support level, one more time and even almost broke it, but failed and corrected. But soon, it finally broke this level and rose to the resistance line of the channel, where at the moment it continues to trade near. In my mind, Euro will rebound from this line and go to the correction until to support line of the channel, breaking the support level. For this case, my TP is located near this line - at the 1.1490 points. Please share this idea with your friends and click Boost 🚀
Disclaimer: As part of ThinkMarkets’ Influencer Program, I am sponsored to share and publish their charts in my analysis.

EURUSD Under Pressure! SELL!
My dear subscribers,
My technical analysis for EURUSD is below:
The price is coiling around a solid key level - 1.1726
Bias - Bearish
Technical Indicators: Pivot Points High anticipates a potential price reversal.
Super trend shows a clear sell, giving a perfect indicators' convergence.
Goal - 1.1612
My Stop Loss - 1.1783
About Used Indicators:
By the very nature of the supertrend indicator, it offers firm support and resistance levels for traders to enter and exit trades. Additionally, it also provides signals for setting stop losses
Disclosure: I am part of Trade Nation's Influencer program and receive a monthly fee for using their TradingView charts in my analysis.
———————————
WISH YOU ALL LUCK

SHORT ON EUR/USDEUR/USD has a rising wedge within a consolidation zone.
The dollar looks like it will rise which will cause this pair to fall.
I will be selling EU looking to catch 150-300 pips this week.

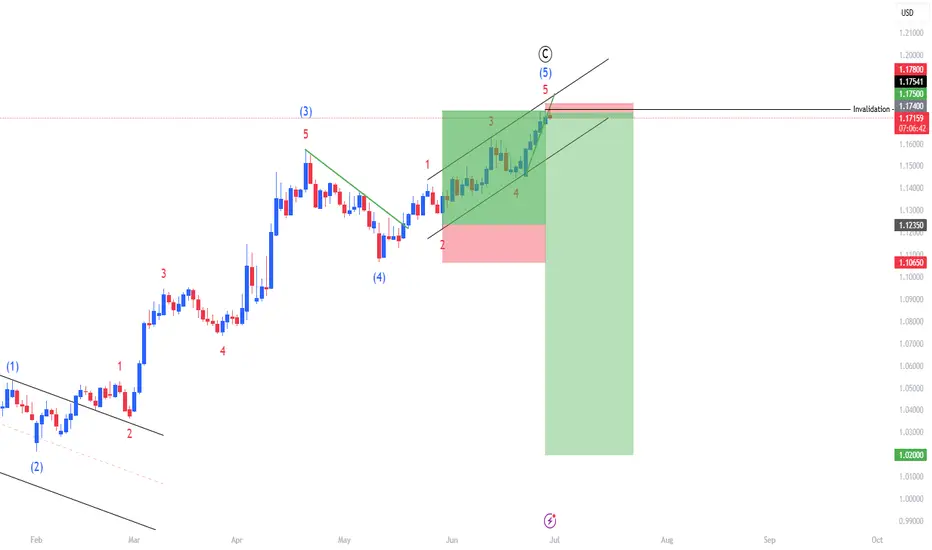
EURUSD - Eur bull run over??Completed Elliott Wave Structure:
• The chart displays a full 5-wave impulsive Elliott Wave count to the upside, labeled (1) through (5), completing a wave C.
• This suggests the end of a corrective ABC pattern, which often marks the end of a bullish retracement or rally within a larger downtrend.
Price Reaches Resistance Zone:
• The price reaches a previous high/resistance area marked by the top of the wedge and completes the fifth wave.
• This is typically where institutional traders may look to take profits or enter short positions.
Risk-Reward Set Up Suggests Short Bias:
• The chart includes a bearish risk-reward trade setup, indicating the trader expects a decline.
• The stop loss is placed slightly above the peak of wave 5, and the take profit is much lower, giving a favorable risk-to-reward ratio in anticipation of a significant move down.
Structure Confluence:
• The top of wave (5) aligns with the trendline resistance from the rising wedge formation, adding technical confluence to the bearish outlook.
⸻
Conclusion
With a completed Elliott Wave count, bearish chart pattern (rising wedge), technical resistance, and a well-defined short setup, the chart strongly suggests that a major top may be in place for EUR/USD, and a downside move is likely to follow.
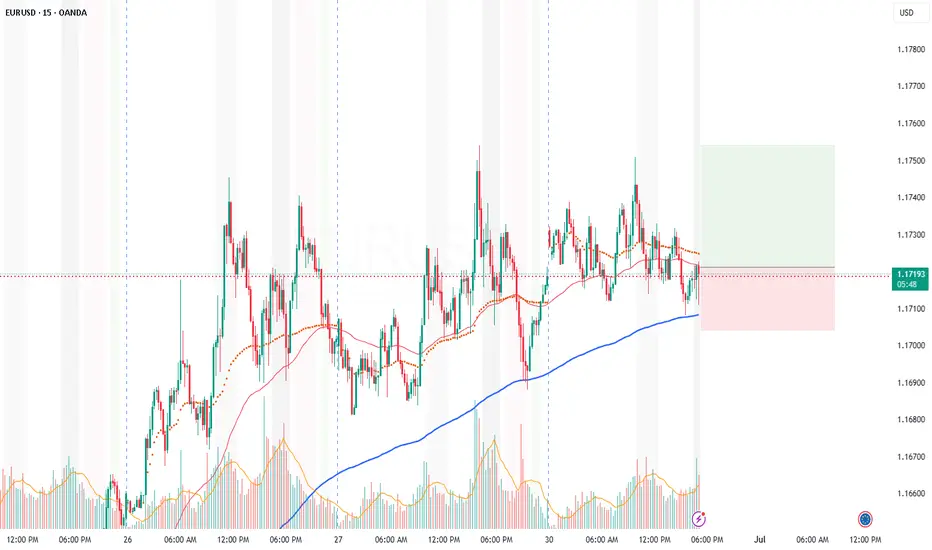
EURUSD tested the Resistance level 1.17460 👀 Possible scenario:
On June 30, the euro (EUR) rose 0.15% to 1.17500, briefly reaching 1.17540—its highest level since September 2021—marking a 1.57% weekly gain, the strongest since May 19. The rally was driven by broad U.S. dollar weakness as markets adjusted to signs of slowing U.S. growth and subdued inflation, fueling expectations of a more dovish Federal Reserve. Meanwhile, resilient European data supported the euro.
On June 30, investors will closely monitor speeches from European Central Bank (ECB) officials for policy signals, with particular focus on President Christine Lagarde’s address at 5:00 p.m. UTC, which may provide key insights into the ECB’s monetary stance.
✅Support and Resistance Levels
Now, the support level is located at 1.15900
Resistance level is located at 1.17460
EURUSD M15 Buy signal intradayTechnical:
1. Bullish FVG
2. False Breakdown
3. Bullish Reaction
Fundamental:
- neutral-bullish

EURUSD BUY SETUP 1:5HELLO HOW ARE YOU ?
What i think about market ?
I Think the market will take liquidity
and will reach imbalance , then touch the supply area
and last will go up boooom

EURUSD Sell signal at the top of the Channel Up.Last time we analyzed the EURUSD pair (June 23, see chart below) we gave a strong buy signals at the bottom of the 1.5-month Channel Up:
The price is almost near our Target but since it's been consolidating for so many 4H candles on the pattern's top, it is better to take the good profit and turn bearish.
The 0.5 Fibonacci retracement level has been a solid target for the previous two Bearish Legs, but since the last one bottomed just above it on the 4H MA100 (green trend-line), we will place the Target a little higher this time also at 1.16100.
-------------------------------------------------------------------------------
** Please LIKE 👍, FOLLOW ✅, SHARE 🙌 and COMMENT ✍ if you enjoy this idea! Also share your ideas and charts in the comments section below! This is best way to keep it relevant, support us, keep the content here free and allow the idea to reach as many people as possible. **
-------------------------------------------------------------------------------
Disclosure: I am part of Trade Nation's Influencer program and receive a monthly fee for using their TradingView charts in my analysis.
💸💸💸💸💸💸
👇 👇 👇 👇 👇 👇

Market Insights with Gary Thomson: 30 June - 4 JulyMarket Insights with Gary Thomson: Eurozone Inflation, US Jobs, ISM PMIs, ECB Forum Updates
In this video, we’ll explore the key economic events, market trends, and corporate news shaping the financial landscape. Get ready for expert insights into forex, commodities, and stocks to help you navigate the week ahead. Let’s dive in!
In this episode, we discuss:
— Euro Area Inflation Rate YoY Flash
— US Nonfarm Payrolls and Unemployment Rate
— US ISM Manufacturing and Services PMI
— ECB Forum on Central Banking
Note: U.S. markets may see thin trading ahead of the 4 July holiday, raising volatility risks.
Don’t miss out—gain insights to stay ahead in your trading journey.
This video represents the opinion of the Companies operating under the FXOpen brand only. It is not to be construed as an offer, solicitation, or recommendation with respect to products and services provided by the Companies operating under the FXOpen brand, nor is it to be considered financial advice.

EURUSDHello, I hope you have a good day ❤
Please don't forget to support us so that our activities can continue!🚀
The trend of the above times is completely upward and this move is not far from expected.
But since it is the first week of the new month, be sure to observe capital management.
Be profitable💲💎

DON'T BE CAUGHT OFFGUARD, EURUSD IS BEARISHEurusd is bearish, it is selling. Don't be caught off guard. Once we see another clear BOS, we enter more. I want you to learn compounding with this trade. I want you to learn holding trade. You can create separate account for my trades and you will see the huge difference it will make in your trading account.
Follow me as my trades are mostly market orders so you'll see them on time and enter on time.

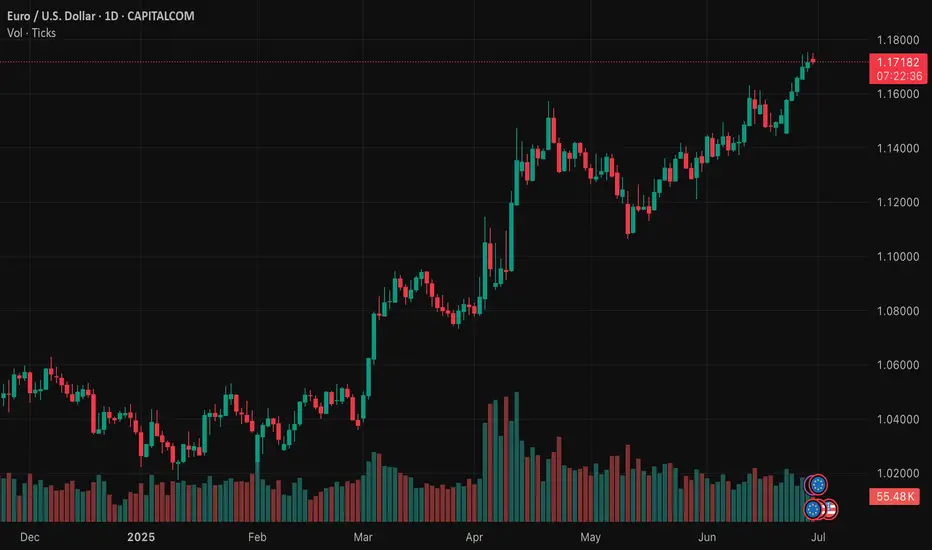
Buy setup TiqGpt1D Timeframe: The daily chart shows a strong bullish momentum with a series of green candles indicating a clear uptrend. This suggests institutional buying pressure and a lack of significant sell-side resistance.
4H Timeframe: The 4-hour chart presents a more consolidated view with price action oscillating around the 1.17200 level. This could indicate a phase of distribution or accumulation as institutions prepare for the next significant move.
1H Timeframe: The hourly chart shows a similar consolidation pattern with slight bullish bias as evidenced by the recent green candles. This could be a preparation phase before a potential liquidity sweep.
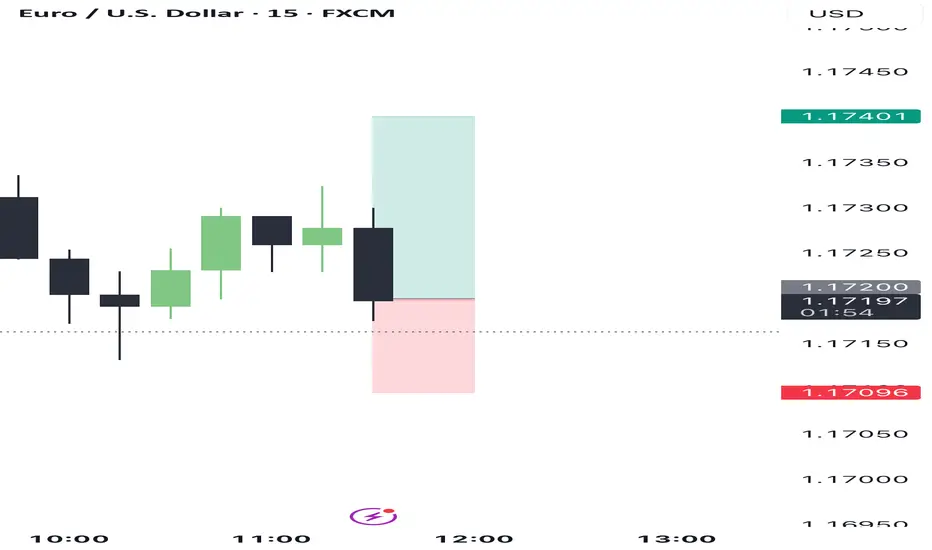
15M Timeframe: The 15-minute chart shows more volatility with price testing both higher and lower bounds around the central consolidation zone. This indicates active trading and potential setup for stop hunts.
5M Timeframe: On the 5-minute chart, there is a visible decline, suggesting a potential liquidity grab as price dips below the consolidation zone, possibly trapping late retail sellers.
1M Timeframe: The 1-minute chart shows a sharp drop followed by a quick recovery, indicative of a stop hunt or liquidity sweep, confirming the potential trap seen on the 5-minute chart.
INSTITUTIONAL THESIS:
Institutions appear to be in a phase of accumulation after a liquidity sweep, particularly visible on the lower timeframes. The recent sharp movements on the 1-minute and 5-minute charts suggest a trapping of retail positions, setting the stage for a potential bullish continuation.
LEARNING POINT:
"1M and 5M liquidity sweep and trapping of retail sellers before potential bullish continuation."
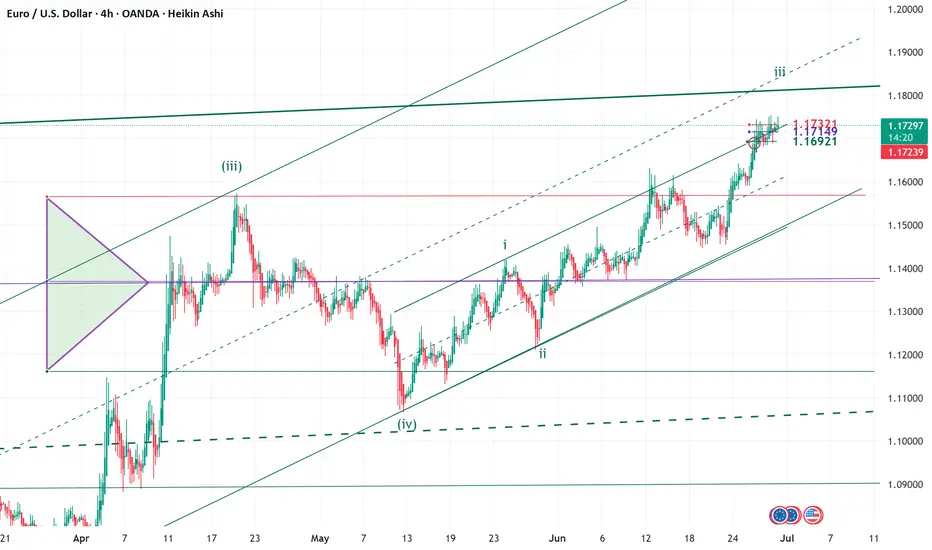
ELLIOTT WAVE EURUSD H4 update
EW Trade Set Up H4
minuette W4 ended, w5 running
with the decisive break of the 1.1570 level, wave 4 can be declared finished and wave 5 is underway in motive way. Not clear yet the type of motive wave impulsive or diagonal.
daily key levels (area)
1.1732
1.1715 POC
1.1690
EURUSD: Will Go Down! Short!
My dear friends,
Today we will analyse EURUSD together☺️
The recent price action suggests a shift in mid-term momentum. A break below the current local range around 1.17225 will confirm the new direction downwards with the target being the next key level of 1.17114.and a reconvened placement of a stop-loss beyond the range.
❤️Sending you lots of Love and Hugs❤️

EUR/USD – Weak Expectations, Neutral German CPI📉 EUR/USD – Weak Expectations, Neutral German CPI, and Bearish Momentum Ahead
Bias: Short / Sell Setup
EUR/USD recently surged toward the 1.0750 zone sooner than expected, driven more by market optimism and speculative flows than solid fundamentals.
Now, that optimism is starting to fade as data fails to back it up.
Meanwhile, the potential U.S. tax reform proposal (Trump) and signs of renewed trade negotiations are helping shift sentiment back toward the U.S. dollar in the coming 10 days.
---
🇩🇪 German CPI – Neutral Print, But Bearish Implications
Today's regional inflation figures across German states were mixed:
States like Saxony and Baden-Württemberg showed slightly rising prices
Others like Bavaria and North Rhine-Westphalia showed declining YoY inflation
Final national CPI due later today is unlikely to beat expectations meaningfully
🎯 Summary: A Neutral CPI Print
No upside surprise → No support for EUR
No major downside → No panic either
---
🧠 Why "Neutral" Data Can Still Be Bearish for EUR
The market was hoping for a strong CPI to signal that ECB may pause rate cuts
Neutral inflation = ECB may still lean dovish
EUR rose on hope — but data offered no confirmation
In financial markets, failed expectations often trigger stronger corrections than bad news.
---
🔍 Technical Overview:
Price approaching strong supply zone near 1.0740 – 1.0760
RSI showing divergence on lower timeframes (H1)
Structure on M15 suggests potential for lower highs
Price stalling under resistance, with no bullish momentum follow-through
---
🎯 Trade Plan:
Bias: Short
Entry Zone: 1.0730 – 1.0755
Stop Loss: Above 1.0775
Take Profit 1: 1.0630
Take Profit 2: 1.0600
Trigger: Break of M15 bearish structure or supply reaction
---
📌 Markets punish over-optimism more than fear.
EUR/USD may correct lower as hopes of a strong CPI fade and macro flows tilt toward the USD.

MASSIVE EURUSD SHORT We could see a breakdown of 30% on the MIL:EURO
There has been too much printing and liquidity is drying up

MarketBreakdown | EURUSD, GBPUSD, USDJPY, USDCHF
Here are the updates & outlook for multiple instruments in my watch list.
1️⃣ #EURUSD weekly time frame 🇪🇺🇺🇸
The pair is unstoppable.
The market violated a significant weekly resistance cluster last week.
It opens more growth potential after a pullback.
2️⃣ #GBPUSD weekly time frame 🇬🇧🇺🇸
In comparison to EURUSD, GBPUSD is now approaching a major
resistance area. I think that we can expect a retracement from that.
3️⃣ #USDJPY daily time frame 🇺🇸🇯🇵
The market continues a correctional movement lower.
The closest strong support that I see is based on a rising trend line.
I think that buying interest may spark again after its text.
4️⃣ #USDCHF daily time frame 🇺🇸🇨🇭
The price updated a historic low on Friday.
The next strong support that I see is based on a falling trend line.
We can expect a pullback from that.
Do you agree with my market breakdown?
❤️Please, support my work with like, thank you!❤️
I am part of Trade Nation's Influencer program and receive a monthly fee for using their TradingView charts in my analysis.

Lingrid | EURUSD Pullback - Continuation Trading OpportunityFX:EURUSD is consolidating above the upward trendline after forming a higher high and pulling back toward dynamic support. Price structure remains bullish within the rising channel, and a rebound from the 1.1640–1.1700 zone could trigger the next leg higher. If bulls regain momentum, the pair may aim for the 1.1850 resistance ceiling within the target area.
📈 Key Levels
Buy zone: 1.1640–1.1700
Sell trigger: breakdown below 1.1640
Target: 1.1850
Buy trigger: breakout and retest above 1.1750 with strong momentum
💡 Risks
Breakdown below the upward channel may signal a broader reversal
Weak bullish reaction from trendline could stall upside progress
Failure to reclaim 1.1750 resistance keeps price vulnerable to deeper pullbacks
If this idea resonates with you or you have your own opinion, traders, hit the comments. I’m excited to read your thoughts!

EURUSD: focus on jobs dataThe major macro data for this week, the PCE indicator, was posted on Friday. The Personal Consumption Expenditure index, Feds favorite inflation gauge, increased by 0,1% in May, bringing the index to the level of 2,3% on a yearly basis. Both figures were in line with market expectations. The core PCE was a bit higher than anticipated, at the level of 0,2% for the month and 2,7% for the year. A bit surprising figures came from Personal Income in May, which dropped by -0,4%, while the Personal Spending was down by -0,1% in May. Analysts are noting that implemented trade tariffs are slowly beginning to reflect in the personal spending of the US citizens. Also, this sort of potential development was noted by the Fed during the last two FOMC meetings.
The rest of posted macro data for the US included the Existing Home Sales in May reached 4,03M, which was an increase of 0,8% on a monthly basis. This was significantly above the market estimate of -1,3%. The Durable Goods Orders in May were higher by 16,4%, surpassing the market estimate of 8,5%. The GDP Growth Rate final for Q1was standing in a negative territory of -0,5% for the quarter, and was higher from market expectation of -0,2%. The end of the week brought University of Michigan Consumer Sentiment figures final for June, which was standing at 60,7 and was in line with estimates. The Inflation Expectations were a bit higher from the previous estimate, ending the June with expected 5% inflation, while the market was expecting to see 5,1%.
The HCOB Manufacturing PMI flash for June in Germany was standing at the level of 49, while the same index for the Euro Zone reached 49,4. Both indicators were in line with market expectations. The Ifo Business Climate in Germany in June reached 88,4, in line with market estimates. The GfK Consumer Confidence in July was at the level of -20,3, a bit higher from estimated -19,3.
The eurusd was traded with a bullish sentiment during the previous week. The currency pair started the week around the level of 1,1460 and continued toward the upside for the rest of the week. The highest weekly level at 1,1741 was reached in Friday's trading session. The RSI reached the clear overbought market side as of the end of the week, at the level of 71. The MA50 continues to diverge from MA200, without an indication that the potential cross is near.
The market favored the euro during the last two weeks. It comes as a result of insecurity when it comes to potential negative impact of implemented trade tariffs, which are slowly revealing in the US economy. The week ahead brings more jobs data, including JOLTs, NFP and unemployment rate, which will shape the investors sentiment. Some increased volatility might be ahead. The resistance level at 1,17 has been clearly tested during the previous week, and it will mark the beginning of the week ahead. The RSI is pointing to a higher probability of a short term reversal in the coming period, which might occur in the week ahead, impacted, most probably, by jobs data. In case of a reversal, the level of 1,1620 might easily be the next target. On the opposite side, there is a lower probability of a further move above the 1,17 level, however, the market might spend some time here, before a decision to make further move.
Important news to watch during the week ahead are:
EUR: Retail Sales in May in Germany, Inflation Rate preliminary in June for both Germany and the Euro Zone, Unemployment Rate in June in Germany,
USD: ISM Manufacturing PMI in June, JOLTs Job Openings in May, Non-farm Payrolls in June, Unemployment rate in June, Average Hourly Earnings and Spending, ISM Services PMI in June
