EURUSD H4 RISES 🔄 Disrupted EUR/USD Analysis (4H)
📉 Current Structure:
Price is hovering around 1.17298, showing hesitation at the resistance of a potential bearish flag.
While the chart labels this zone as “bullish,” there are signs of market indecision, possibly a fakeout trap.
⚠️ Key Disruptions:
1. Bullish Trap Risk:
The price formed a short-term M-pattern (double top inside the orange circle), indicating bearish exhaustion rather than continuation.
The expected breakout to the upside may fail if bulls don’t sustain volume.
2. Support Area Weakness:
The support zone around 1.17000 has been tested multiple times. If it breaks, it could turn into a strong resistance, flipping the sentiment.
3. Macro Influence:
Upcoming EUR and USD economic events (noted by icons) could cause high volatility and break structure unexpectedly.
A strong USD report could reverse bullish momentum, sending EUR/USD toward 1.16500 or lower.
4. Bearish Continuation Scenario:
If the market breaks down from the current consolidation, expect targets at:
USDEUR trade ideas

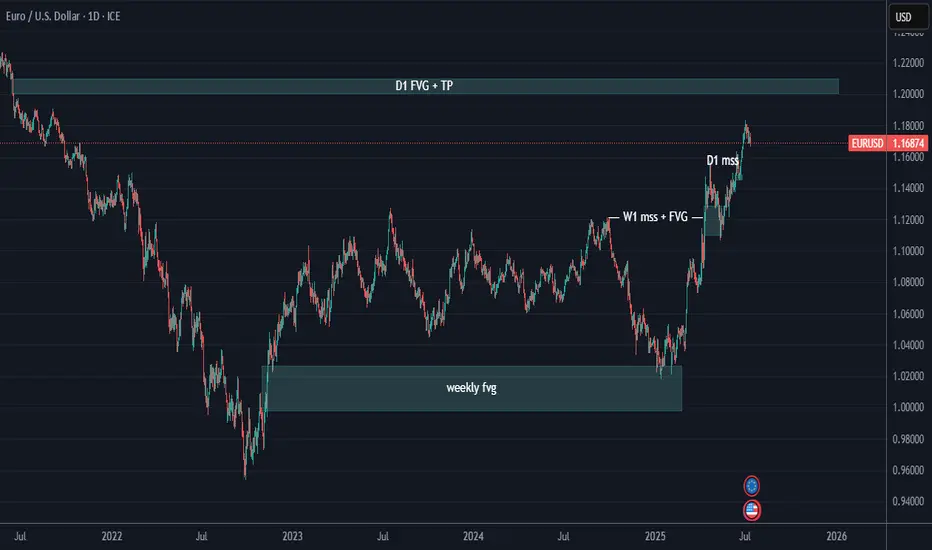
HTF analysis for EurUsdFollowing simple Ict concepts, we can see that EU has respected the higher time frames PD array.
Following the trend as price seems to be "drawn" to premium towards the D1 FVG area.
we can expect to see price fill that PD array around the 1.20800 area
EURUSD NEW HIGHS?The 1h timeframe reminds me of this book, LIQUIDITY AND MANIPULATION.
"The markets need to generate liquidity in order to move, so if liquidity isn´t
already there, it will be created. So when new traders come in to forex and
learn about it for the first time, what they usually do is gonna be retail based
trading.
So support and resistance, chart patterns which are extremely popular in the
industry, and things of that nature.
So what some brokers do is they offer free education for their clients once we
start trading. Now this education will usually be retail methods support and
resistance. "
Thanks for this idea.
here is the chart relative to this, see the price above it will clear?
I have more on this kind of idea.
This is not a financial advice.
Follow for more .
trade it or see it.
Goodluck

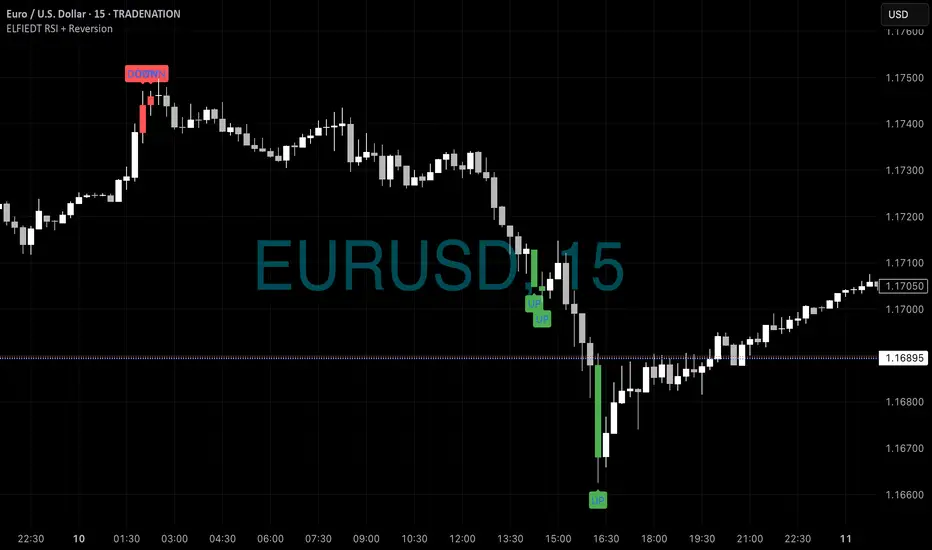
EU - Shorts into Longs📊 EURUSD 15min – Reversal Both Ways: Sell the Top, Buy the Bottom
🔄 Complete Cycle Coverage | Precision Short & Long | Real-Time Edge
This EURUSD chart is a textbook example of how the ELFIEDT RSI + Reversion system captures both ends of the market — printing a clean DOWN signal at the high, followed by multiple stacked UP signals at the low.
🔻 High-Precision Short Signal
At the early session high, a lone DOWN signal was printed at 01:45 — just as price peaked before entering a persistent downtrend.
🔹 Hypothetical Trade Idea:
Entry: Short at the close of the red DOWN candle
Stop-loss: Just above the signal candle’s high
Reward: Price dropped more than 60 pips before stabilizing
🟢 Strong Bottom Reversal with Triple Confirmation
After the sustained decline, the indicator printed three consecutive UP signals starting around 15:00 — catching the bottom of the selloff with minimal further downside.
🔹 Hypothetical Trade Idea:
Entry: After the last UP signal prints (aggressive traders could scale in earlier)
Stop-loss: Below the signal wick
Reward: Immediate reversal led to a steady move up into the next session
This setup offered a second high-probability opportunity, demonstrating the system’s strength in both directions.
🧠 What This Shows
The ELFIEDT system isn’t reactive. It pre-empts exhaustion, spotting the true shift in sentiment before traditional indicators catch on.
📣 Public Release – Limited Scope Only
This is a basic public version of the ELFIEDT RSI + Reversion engine.
🚀 Advanced versions include:
Multi-symbol confluence
Divergence overlays
Trendline breakouts
Re-entry logic
Institutional filter layers
📬 DM to apply for premium access — strictly invite-only.
#EURUSD #ForexSignals #MeanReversion #ReversalTrading #SmartForexTools #ELFIEDT #15MinuteChart #FXPrecision #TradingView
EUR/USD Daily Chart Analysis For Week of July 11, 2025Technical Analysis and Outlook:
In this week's trading session, as expected, the Euro continued its decline, reaching our Mean Support level of 1.168. Recent analyses suggest that the Euro is likely to experience a further downward trend, with the next target set at the Mean Support level of 1.160. However, it's essential to consider the possibility of a rebound toward the Key Resistance level of 1.181, which could lead to the completion of an Outer Currency Rally reaching 1.187.

EUR/USD SELLERS WILL DOMINATE THE MARKET|SHORT
Hello, Friends!
Previous week’s green candle means that for us the EUR/USD pair is in the uptrend. And the current movement leg was also up but the resistance line will be hit soon and upper BB band proximity will signal an overbought condition so we will go for a counter-trend short trade with the target being at 1.133.
Disclosure: I am part of Trade Nation's Influencer program and receive a monthly fee for using their TradingView charts in my analysis.
✅LIKE AND COMMENT MY IDEAS✅

EUR/USD Reversal Ahead? COT + DXY Strength Signal Price has broken below the ascending channel that started in mid-May.
The current candle is rejecting the weekly supply zone (1.17566–1.18319), leaving a significant upper wick.
Daily RSI is losing strength but has not yet reached extreme levels.
A key daily Fair Value Gap (FVG) lies between 1.1600 and 1.1480, with the first potential downside target at 1.14802, which aligns with support and the FVG zone.
A deeper bearish continuation could push price towards 1.1350, but only if the FVG lows are clearly broken.
📊 COT Data (CME - Euro FX & USD Index)
Euro FX
Net long: +15,334
Commercials increased both longs (+13,550) and shorts (+9,913) → mild divergence.
Non-Commercials (speculators) increased shorts (+4,786) more than longs (+1,188) → speculative bias tilting bearish.
USD Index
Strong net long accumulation across all trader types: +4,597 net.
Non-Commercials added +3,590 longs, with only a minor increase in shorts.
→ USD strength continues, reinforcing potential weakness in EUR/USD.
🧠 Retail Sentiment
67% of retail traders are short EUR/USD → typically a contrarian bullish signal.
However, the price is already showing distribution, not accumulation, so we may see price push lower first to trap remaining retail longs, invalidating the contrarian signal in the short term.
📅 Seasonality
July is historically bullish, especially on the 2Y (+0.0142) and 10Y (+0.0106) averages.
However, the 15Y and 20Y averages show a much more moderate performance (+0.007 / +0.0025).
Based on current price action, the seasonal rally may have already played out with the run-up to 1.1830. A correction now seems likely, even if the broader macro remains supportive mid-term.
🧩 Conclusion
Despite historically bullish seasonality for July, both price action and COT data indicate distribution with early signs of reversal.
Retail sentiment is too skewed short for a major breakdown just yet, but the technicals support a short-term pullback toward more balanced levels.
USD strength from COT and DXY structure reinforces a corrective short bias for now.

EURUSD LONG The dollar is looking to fall hard as the euro continues to gain we still see the market long on the euro in terms of institutions etc. we had a weak push to the downside and have now met trend line resistance will be interesting to see what happens from here . The trade isn’t perfect yet but this is what I’m looking at so far .

EURUSD is resting at support at lower channel line-consolidatingEURUSD is resting at support at lower channel line-consolidating. It may bounceback.

EURUSD – Breakout Confirms Bullish ContinuationEURUSD has just successfully broken out of a corrective triangle pattern, confirming that the bullish structure remains intact. The price reacted well to the support zone around 1.1660 and bounced back, opening the way toward the 1.1820 target in the short term.
On the news front, the euro is gaining support as the Eurozone’s July CPI held steady at 2.6%, indicating that inflationary pressures have not fully eased—this may prompt the ECB to maintain a tighter policy for longer. Meanwhile, the USD is under mild correction pressure after U.S. CPI came in higher than expected but not strong enough to reignite rate hike expectations from the Fed.
Given the current technical setup and news backdrop, EURUSD could continue rising in the coming sessions as long as it holds above the trendline support.

EUR_USD STRONG UPTREND|LONG|
✅EUR_USD is trading in an uptrend
With the pair set to retest
The rising support line
From where I think the growth will continue
LONG🚀
✅Like and subscribe to never miss a new idea!✅
Disclosure: I am part of Trade Nation's Influencer program and receive a monthly fee for using their TradingView charts in my analysis.

Rejection from Supply Zone, Bearish Continuation Toward PDLAfter failing to break out with strength and confirm the demand zone, EUR/USD is showing signs of a bearish continuation. The price was rejected from the Demand Zone near the NY High, indicating a possible shift in momentum.
This setup suggests the pair may continue its downward trend, aiming for the Previous Day Low (PDL) around 1.16620. With a favorable risk-to-reward ratio of 1:5, this move could present a clean and high-probability short opportunity as long as bearish structure holds.

EURUSD and Elliott Wave PrinciplesWe are currently on a Wave 5 that started when Wave 4(Red) completed. This 5th Wave expresses itself in 5 waves that are shown in Black. Our Wave 2 was a Zigzag and and we should expect a Flat correction for our Wave 4. When Wave 3 is complete an A Wave retests on the 261.8% Fib. level. Wave B goes beyond the end of Wave 3 and retests the confirms at the 423.6% Fib. level. This indicates the end of Wave B and the start of Wave C of the Flat, hence our Wave 4.

EURUSD: Bulls Are Winning! Long!
My dear friends,
Today we will analyse EURUSD together☺️
The price is near a wide key level
and the pair is approaching a significant decision level of 1.16915 Therefore, a strong bullish reaction here could determine the next move up.We will watch for a confirmation candle, and then target the next key level of 1.17015.Recommend Stop-loss is beyond the current level.
❤️Sending you lots of Love and Hugs❤️

HelenP. I Euro will drop more, breaking the support levelHi folks today I'm prepared for you Euro analytics. After analyzing the current structure of the EURUSD chart, I noticed a strong break of the ascending trend line, which had been respected for a long period. The price has now returned to test the broken trend line from below, aligning with the resistance zone between 1.1665 and 1.1700 points. This area used to serve as solid support, but after the breakout, it turned into resistance. The retest from below could become the final confirmation before the pair continues its downward movement. Right now, EUR is trading just inside this resistance zone. There is a small chance the price might move slightly higher to touch the upper boundary of the zone, but overall, the pressure looks bearish. I expect that after a minor bounce, EUR will decline again, breaking below the local support at 1.1665. Once that happens, a larger impulse down could be triggered, targeting even 1.1525 points, which is my main goal for this setup. This bearish scenario is supported by the failed attempts to recover above the trend line and the fact that previous support has already flipped to resistance. If you like my analytics you may support me with your like/comment.❤️
Disclaimer: As part of ThinkMarkets’ Influencer Program, I am sponsored to share and publish their charts in my analysis.

EURUSD: Long Trading Opportunity
EURUSD
- Classic bullish setup
- Our team expects bullish continuation
SUGGESTED TRADE:
Swing Trade
Long EURUSD
Entry Point - 1.1685
Stop Loss - 1.1664
Take Profit - 1.1728
Our Risk - 1%
Start protection of your profits from lower levels
Disclosure: I am part of Trade Nation's Influencer program and receive a monthly fee for using their TradingView charts in my analysis.
❤️ Please, support our work with like & comment! ❤️

EURUSD: Decision Time at Major Channel SupportToday we're looking at the EURUSD on the 4-hour timeframe, which presents a very clear and actionable technical setup. Price has been trading within a well-defined ascending channel since April. This channel has provided a reliable framework for the prevailing uptrend, with the green bands acting as dynamic support and the red band as resistance.
The Current Situation:
After a strong rejection from the top of the channel (red resistance zone) around the 1.1850 area, the price has entered a corrective phase. We are now approaching a critical inflection point where multiple support factors converge.
Primary Support: The lower boundary of the main ascending channel (green zone). This is the backbone of the entire bullish structure.
Horizontal Support: The purple zone around 1.1600-1.1625, which previously acted as resistance, is now a potential support floor.
Short-Term Resistance: A minor descending trendline is capping the immediate price action, forming a small wedge or triangle pattern.
The Bullish Scenario:
The dominant trend is up. Therefore, the primary thesis is to look for a bullish continuation. A long entry becomes compelling if we see the price hold at the confluence of the ascending channel support and the horizontal purple zone. A definitive bounce from this area, confirmed by a break and close above the short-term descending trendline, would be the trigger.
Initial Target: A retest of the recent highs around 1.1800.
Ultimate Target: A push towards the upper boundary of the ascending channel.
The Bearish Invalidation:
This bullish outlook becomes invalid if sellers manage to force a decisive 4-hour close below the ascending channel's support line. A break of this magnitude would negate the multi-month uptrend structure, signaling a significant shift in market sentiment and likely initiating a deeper sell-off.
Conclusion:
EURUSD is at a crossroads. The structure is clean, and the levels are well-defined. The bias remains bullish as long as the price respects the established channel. Watch the 1.1600-1.1650 support area for signs of a bounce. A break below this critical zone would warrant a shift to a bearish perspective.
Disclaimer:
The information provided in this chart is for educational and informational purposes only and should not be considered as investment advice. Trading and investing involve substantial risk and are not suitable for every investor. You should carefully consider your financial situation and consult with a financial advisor before making any investment decisions. The creator of this chart does not guarantee any specific outcome or profit and is not responsible for any losses incurred as a result of using this information. Past performance is not indicative of future results. Use this information at your own risk. This chart has been created for my own improvement in Trading and Investment Analysis. Please do your own analysis before any investments.

EURO - Price will continue to grow inside rising channelHi guys, this is my overview for EURUSD, feel free to check it and write your feedback in comments👊
Recently, price entered to rising channel, where it soon reached the support level, which coincided with the support area.
After this movement, the price broke this level, but soon turned around and corrected the support line of the channel.
Next, EUR went back to $1.1365 level and broke it again, after which it made a retest and continued to move up.
In a short time, EUR rose to the resistance line of the channel, made a correction, and then grew to $1.1700 support level.
Price broke this level too and reached the resistance line of the channel, but not long ago corrected.
At the moment, I expect that the Euro can correct to the support line of the channel and then rise to $1.1900
If this post is useful to you, you can support me with like/boost and advice in comments❤️
Disclaimer: As part of ThinkMarkets’ Influencer Program, I am sponsored to share and publish their charts in my analysis.

#AN019: Digital Currencies (CBDCs) Will Change Forex
How the world of official digital currencies (CBDCs) is already impacting Forex, opening up new opportunities rarely considered elsewhere. Hello, I'm Forex Trader Andrea Russo.
On the one hand, Shanghai is evaluating countermeasures against stablecoins and cryptocurrencies, including yuan-backed currencies, while China is moving closer to a reasonable transition to its own "soft" stablecoin, after years of restrictions on crypto trading. On the other, Pakistan is launching a pilot CBDC, aligning itself with a momentous shift: it is now shaping its own digital monetary system, with direct impacts on inflation, reserves, and currency pairs.
These initiatives are not isolated. They are part of a global phenomenon: over 130 central banks are studying or testing CBDCs, with Europe, China, and the Middle East at the forefront. American hostility (e.g., the ban on digital dollars) risks pushing others to consolidate their own digital currencies as a geopolitical and financial shield.
In Forex, these developments could generate repercussions even in the short term:
EUR/CNY or INR exchange rate: Retail and wholesale CBDCs will facilitate direct trade, reducing dependence on the dollar, and potentially giving rise to new flows in Asian crosses.
Reduced cross-border costs and times: Systems like mBridge (China, Hong Kong, Thailand, UAE, Saudi Arabia) will allow instant transactions and cross-border digital currencies, breaking down SWIFT's dominance and encouraging lower demand for USD payments.
New interest rate paradigm: CBDCs may include fixed interest rates, creating competitive pressure on swaps and futures, and forcing traditional central banks to clarify their strategies.
Digital Safe Havens: If EUR or CNY become globally interoperable, new forms of safe haven currencies could emerge, impacting crosses such as EUR/USD, USD/CNY, and INR/USD.
Actional conclusion for Forex traders:
We will soon enter uncharted territory: it will not just be a matter of evaluating central banks and SMEs, but also of understanding if and when official digital payment systems will have a real impact on currency routes.
For those who want to anticipate flows:
Monitor CBDC pilots in Asia and the Middle East.
Keep an eye on retail adoption in the BRICS countries: in the coming quarters, we could see direct flows from USD to digital CNY, INR, and AED.
Evaluate potential longs on digital-friendly crosses (e.g., USD/INR digital) and shorts on USD linked to interest in stablecoins.
Forex is entering its new digital era: the question is only one: are you ready to navigate it?


EURUSD Will Go Up! Buy!
Here is our detailed technical review for EURUSD.
Time Frame: 6h
Current Trend: Bullish
Sentiment: Oversold (based on 7-period RSI)
Forecast: Bullish
The market is trading around a solid horizontal structure 1.169.
The above observations make me that the market will inevitably achieve 1.177 level.
P.S
The term oversold refers to a condition where an asset has traded lower in price and has the potential for a price bounce.
Overbought refers to market scenarios where the instrument is traded considerably higher than its fair value. Overvaluation is caused by market sentiments when there is positive news.
Disclosure: I am part of Trade Nation's Influencer program and receive a monthly fee for using their TradingView charts in my analysis.
Like and subscribe and comment my ideas if you enjoy them!

EUR/USD Price Action – Liquidity Grab & Demand Zones This 1-hour EUR/USD chart highlights key intraday price levels and potential trading zones. The chart identifies the Previous Day High (PDH), New York Session High (NY HIGH), and Previous Day Low (PDL). A notable Trap/Demand Zone just below the Asia High suggests a potential liquidity grab before a reversal or continuation move. Price is currently reacting within this zone, and traders may watch for confirmations of either a bullish continuation toward the PDH or a bearish rejection back to the PDL. The marked zones serve as potential trade entry/exit reference points for intraday strategies.

EURUSD Energy buildup supported at 1.1590The EURUSD currency pair continues to exhibit a bullish price action bias, supported by a sustained rising trend. Recent intraday movement reflects a sideways consolidation breakout, suggesting potential continuation of the broader uptrend.
Key Technical Level: 1.1640
This level marks the prior consolidation range and now acts as pivotal support. A corrective pullback toward 1.1640 followed by a bullish rejection would reinforce the bullish trend, targeting the next resistance levels at:
1.1830 – Near-term resistance
1.1900 – Minor swing high
1.1940 – Longer-term bullish objective
On the other hand, a decisive daily close below 1.1640 would invalidate the bullish setup, shifting the outlook to bearish in the short term. This could trigger a deeper retracement toward:
1.1590 – Initial support
1.1530 – Key downside target
Conclusion:
As long as 1.1640 holds as support, the technical outlook remains bullish, favoring long positions on dips. A confirmed break below this level would signal a shift in sentiment and open the door to a corrective pullback phase.
This communication is for informational purposes only and should not be viewed as any form of recommendation as to a particular course of action or as investment advice. It is not intended as an offer or solicitation for the purchase or sale of any financial instrument or as an official confirmation of any transaction. Opinions, estimates and assumptions expressed herein are made as of the date of this communication and are subject to change without notice. This communication has been prepared based upon information, including market prices, data and other information, believed to be reliable; however, Trade Nation does not warrant its completeness or accuracy. All market prices and market data contained in or attached to this communication are indicative and subject to change without notice.
