EURUSD - OPPORTUNITY TO PLAY BOTH SIDES OF DESCENDING CHANNEL CMCMARKETS:EURUSD
TRADING IDEA - EURUSD MOVES WITHIN A DESCENDING CHANNEL - OPPORTUNITY TO PLAY BOTH SIDES
EURUSD has been trading within a descending channel since the beginning of the month. Nearby the upper border of the channel there is SMA200 on a 30-m timeframe, pushing on the pair. Generally speaking, all major moving averages are pushing on the EURUSD, the short-term bearish trend continues, so I decided to open
🔽 a market sell order at 1.16688 with
❌a stop loss at 1.16985 and
🤑a take profit at 1.16324
Later I expect a rebound from the lower border with a potential uprise towards upper border of the descending channel.
USDEUR trade ideas

Fundamental Market Analysis for July 14, 2025 EURUSDThe euro remains under pressure: on Monday the pair slipped to 1.16750 after the European Commission extended its pause on retaliatory tariffs against the United States until 1 August. With no resolution in sight, the trade dispute keeps European exporters on edge and turns the dollar into a safe-haven choice for investors looking to limit risk.
Additional support for the greenback comes from rising real yields. The 10-year U.S. Treasury rate is holding above 4.40 %, locking in a wide spread over German Bunds. That has led futures traders to price in just one 25 bp Federal Reserve rate cut for the rest of the year, reducing the euro’s relative appeal.
Macro data from the euro area offer little relief. German industrial production rose only 0.2 % m/m in May, while the July ZEW expectations index slid back into negative territory. With the ECB having already delivered a June cut and projecting lower inflation ahead, inward capital flows to the eurozone remain subdued.
Trading recommendation: SELL 1.16750, SL 1.17050, TP 1.16200

Eurousd techinical analysis.This chart is for EUR/USD on the 1-hour timeframe, showing a harmonic pattern (likely a bullish Gartley or Bat) identified between points A-B-C-D, along with trendlines, consolidation zones, and measured move annotations. Here’s a breakdown:
---
🔍 Key Observations:
1. Harmonic Pattern (ABCD or Gartley/Bat):
Points A → B → C → D are marked.
B retraces to 1.117 (likely 61.8%-78.6% Fibonacci).
C retraces to 0.93 (possibly 88.6% or 61.8%).
The full pattern suggests a potential bullish reversal from point D.
2. Descending Trendline (Pink):
A clear downtrend line intersects the chart.
Price recently broke above this trendline, indicating a potential breakout.
3. Support & Resistance Zones (Purple Rectangles):
Support around 1.1610–1.1630 (bottom zone).
Resistance at 1.1690–1.1710 (top zone).
Price is currently at 1.16676, right between zones.
4. Measured Move (Green Arrow):
Shows a projected upside move of 36.1 pips (0.31%) from D to the top resistance.
This suggests a target area if the bullish pattern plays out.
---
✅ Potential Setup:
Bullish Bias due to:
Harmonic pattern completion at D.
Break above descending trendline.
Holding near midrange with room to 1.1700+.
Confirmation Needed:
Strong bullish candlestick or volume at D.
Break and close above 1.1690 for continuation.
Invalidation:
Break below the purple support zone (~1.1610).
---
📌 Summary:
This chart illustrates a potential **bull

EURUSD InsightHello to all our subscribers.
Please share your personal thoughts in the comments. Don't forget to like and subscribe!
Key Points
- Attacks on Fed Chair Jerome Powell are intensifying, mainly from President Trump and his close aides. Analysts say the tension between the White House and the Federal Reserve has reached a serious level.
- President Trump announced on Truth Social that starting next month, a 30% reciprocal tariff will be imposed on both the EU and Mexico.
- Canada added 83,100 jobs in June compared to the previous month, in line with market expectations. The unemployment rate came in at 6.9%, slightly below the forecast of 6.9%. The strong labor market data likely reduced the chances of a rate cut by the Bank of Canada in July.
This Week’s Key Economic Events
+ July 15: U.S. June Consumer Price Index (CPI)
+ July 16: U.K. June Consumer Price Index, U.S. June Producer Price Index (PPI)
+ July 17: Eurozone June Consumer Price Index
EURUSD Chart Analysis
The price has broken below the trend channel and is now forming under the 1.17000 level. The downside appears more likely than an upward move. The expected support level is around 1.15000. Whether the price bounces from this area or breaks further downward will likely determine the future direction.

EUR/USD Breaks Major Trendline Support – Bearish Continuation In🔍 EUR/USD Technical Breakdown – Bearish Structure Confirmed
The EUR/USD pair has officially broken below a well-established ascending trendline that supported the bullish structure since early May. This technical break is a strong bearish signal, suggesting a potential shift in market sentiment as the pair loses upward momentum.
The pair is now trading around 1.16760, with sellers gaining control after failing to sustain above the 1.1700 region. The breakdown aligns with classic market structure principles, where a clean trendline violation often leads to a continuation move toward the next key support zone.
📍 Target Zone:
The identified downside target is around 1.1500, a critical demand zone that aligns with previous consolidation and potential liquidity pools. This area may act as a magnet for price before any significant reversal occurs.
📘 Trader's Insight:
This setup presents a clear example of a trendline break leading to a bearish continuation pattern. Professional traders may look for retests of the broken trendline for confirmation entries, or short-term rallies to add positions, while maintaining disciplined risk management.
✅ Technical Summary:
Structure: Bearish Breakout
Resistance: 1.1700
Support/Target: 1.1500
Bias: Bearish below trendline

bearish on eurusdNot much clarity on EUR/USD to kick off the week. We're consolidating within that weekly FVG, and DXY is beginning to show strength. If we start closing below the CE of the weekly FVG, I'd like to see the sell-side get targeted.

EUR/USD 4H Technical and Fundamental AnalysisEUR/USD 4H Technical and Fundamental Analysis
EUR/USD has dropped approximately –0.7% over the past week following a sharp risk-off move driven by geopolitical and economic tensions. The major catalyst was President Trump’s announcement of a 30% tariff on EU goods effective August 1, which triggered a strong rally in the U.S. dollar and put the euro under heavy pressure. Broader market concerns also intensified as traders braced for further tariffs targeting sectors like copper and pharmaceuticals, compounding bearish sentiment. On our Technical Side EUR/USD recently broke below a major support zone at 1.1700, confirming a Change of Character (CHoCH) and signaling that sellers are now in control. After the break, the pair entered a phase of bearish accumulation, suggesting institutional positioning ahead of a deeper move. A liquidity grab was observed above the previous short-term high, forming a potential stop-loss hunt a common smart money tactic before a major drop. The market now appears poised for another liquidity sweep before triggering our area of interest.
A clear break and close below 1.16870 would likely confirm continuation toward the next minor support at 1.16270, aligning with bearish momentum.
📌 Sell Setup:
Entry: Sell stop at 1.16870
Stop Loss: 1.17140 (above liquidity zone)
Take Profit: 1.16270 (next key support zone)
These developments are reinforcing downside pressure on the euro, while the U.S. dollar remains well-supported by risk aversion and safe-haven flows.
📌 Disclaimer:
This is not financial advice. Always wait for proper confirmation before executing trades. Manage risk wisely and trade what you see—not what you feel.

EUR USD -+As it's approximately in the middle of the channel, there is no clear direction for me. Also, today is a French bank holiday, so I expect little to no range to be created. Therefore, we might not trade this pair today. The price movement is as slow as a snail crawling toward the bottom..
good luck ...

EURUSD buy zoneEURUSD is holding around levels just below 1,1700.
Tomorrow, U.S. inflation data is expected, which could trigger bigger moves.
The key zone to watch for a reaction is between 1,1591 and 1,1682.
Look for a bounce and potential buying opportunities in that area.
Next resistance levels to keep in mind are 1,1813 and 1,1916!

Do you feel stuck in trading“Ask, and it will be given to you; seek, and you will find; knock, and the door will be opened to you.” — Matthew 7:7
This verse isn’t just spiritual—it’s strategic.
📈 Ask for clarity
🔍 Seek wisdom
🚪 Knock with action
Breakthrough starts with faith and persistence.
Let this be your reminder: You’re not stuck—you’re being positioned. 💡🙌

EUR/USD| - Bullish BiasHTF Context: Noted a clear break of structure to the upside, signaling strong bullish intent. Originally expected a deeper liquidity grab, but price shifted before reaching lower zones.
MTF Refinement: Dropped down to the 30M for better alignment — spotted a liquidity sweep confirming smart money interest.
LTF Execution Plan: Now watching for mitigation of the 30M OB. Once tapped, I’ll look for internal structure shift (1M/5M BOS or CHoCH) to confirm continuation.
Mindset: Staying patient — if price wants higher, it should respect this OB and show its hand first.
Bless Trading!

EUR/USD Holding Support — Watching for Bullish ReactionHi Everyone,
Since our last update, EUR/USD continues to range near the 1.16680 support level. We’re watching for buying interest to emerge above the key 1.16450 zone, which has acted as a critical level for the broader structure.
Should price manage to stabilise and form a base here, there’s potential for a move back towards the highlighted resistance area around 1.17450. A clear reaction from support could confirm renewed buying interest and set the stage for a retest of last week’s highs.
Our broader outlook remains unchanged: as long as price holds above 1.16450, we continue to look for the pair to build momentum for another move higher in the coming sessions. A decisive break above last week’s high could attract fresh buying interest, paving the way for a push towards the 1.19290 area and ultimately 1.20000.
We'll be watching closely to see if this recovery gains traction and whether buyers can sustain the move above resistance. The longer-term view remains bullish, provided price continues to respect the key support zone.
We’ll keep updating you through the week as the structure unfolds and share how we’re managing our active positions.
Thanks again for all the likes/boosts, comments and follows — we really appreciate the support!
All the best for the rest of the week. Trade safe.
BluetonaFX

EUR/USD Sells from 1.17200 back downWeekly Outlook: EUR/USD (EU)
This week, my bias on EUR/USD is similar to GBP/USD, as both pairs have been following a consistent bearish trend. Based on this structure, I’ll be watching to see if price begins a retracement back into an area of supply.
I’ve marked out the 8-hour supply zone, which sits at a premium level and was responsible for the last break of structure to the downside. If price retraces into this zone, I’ll look for potential sell confirmations on the lower time frames.
If price doesn’t tap into the supply zone first, I’ll then shift my focus to the 8-hour demand zone below. In that case, I’ll watch closely for signs of accumulation and a bullish reaction from this level, which could signal the start of a rally.
Confluences for EUR/USD Sells:
✅ Bearish trend has been consistent for the past few weeks.
✅ Breaks of structure have formed new supply zones to trade from.
✅ Liquidity exists below current price, which may be targeted first.
✅ The lower demand zone remains unmitigated, suggesting further downside movement.
📌 On the way down toward demand, I expect price to form another break of structure to the downside. The plan is to ride the sells down into demand, then look for potential buy opportunities if price begins to accumulate and react.
Let’s stay sharp and disciplined — have a solid trading week, everyone! 📊

EURUSD BUY So we have nice weekly fvg below along with a strong pivot point we could possibly see price reach this level before the push to the upside. I’m pretty confident we will have a strong push to the upside due to the macroeconomics and positioning of key players as they are still very bullish on the euro as we still creating higher highs consistently. A lot of people are in sells right now so we could see them taken out before the move to the downside they the EurUsd buy will be in play .

EURUSD IdeaOnce price gets to my poi I’m shorting EURUSD, make sure you use a proper risk management

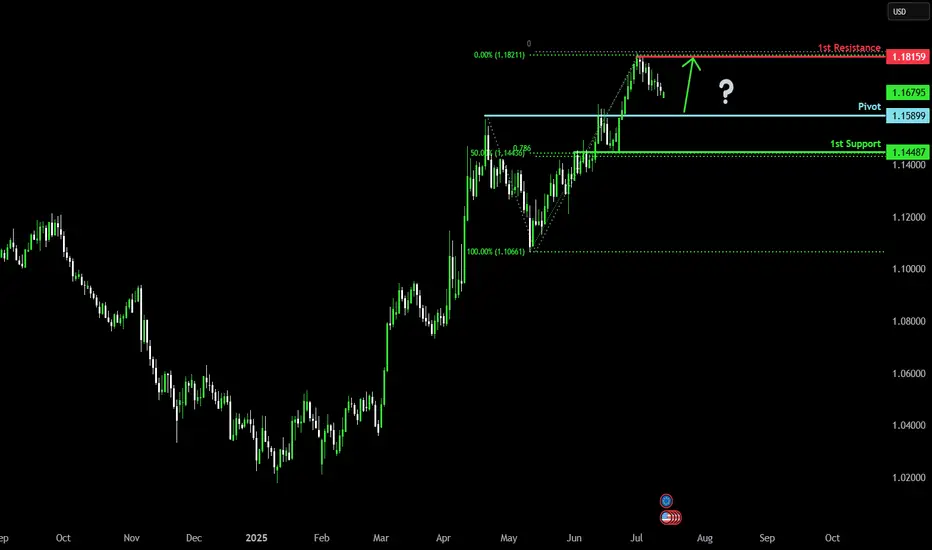
Bullish continuation?The Fiber (EUR/USD) is falling towards the pivot, which has been identified as a pullback support and could bounce to the 1st resistance.
Pivot: 1.1589
1st Support: 1.1448
1st Resistance: 1.1815
Risk Warning:
Trading Forex and CFDs carries a high level of risk to your capital and you should only trade with money you can afford to lose. Trading Forex and CFDs may not be suitable for all investors, so please ensure that you fully understand the risks involved and seek independent advice if necessary.
Disclaimer:
The above opinions given constitute general market commentary, and do not constitute the opinion or advice of IC Markets or any form of personal or investment advice.
Any opinions, news, research, analyses, prices, other information, or links to third-party sites contained on this website are provided on an "as-is" basis, are intended only to be informative, is not an advice nor a recommendation, nor research, or a record of our trading prices, or an offer of, or solicitation for a transaction in any financial instrument and thus should not be treated as such. The information provided does not involve any specific investment objectives, financial situation and needs of any specific person who may receive it. Please be aware, that past performance is not a reliable indicator of future performance and/or results. Past Performance or Forward-looking scenarios based upon the reasonable beliefs of the third-party provider are not a guarantee of future performance. Actual results may differ materially from those anticipated in forward-looking or past performance statements. IC Markets makes no representation or warranty and assumes no liability as to the accuracy or completeness of the information provided, nor any loss arising from any investment based on a recommendation, forecast or any information supplied by any third-party.
correctionThe correction trend at the support levels and the support trend line is expected to end and then we will see the start of the upward trend. Otherwise, the continuation of the downward trend with the breakdown of the support area will be possible.

Bullish bounce off 50% Fibonacci support?EUR/USD is falling towards the support level which is a pullback support that lines up with the 50% Fibonacci support and could bounce from this level to our take profit.
Entry: 1.1632
Why we like it:
There is a pullback support that lines up with the 50% Fibonacci retracement.
Stop loss: 1.1582
Why we like it:
There is an overlap support that is slightly below the 61.8% Fibonacci retracement.
Take profit: 1.1738
Why we like it:
There is an overlap resistance.
Enjoying your TradingView experience? Review us!
Please be advised that the information presented on TradingView is provided to Vantage (‘Vantage Global Limited’, ‘we’) by a third-party provider (‘Everest Fortune Group’). Please be reminded that you are solely responsible for the trading decisions on your account. There is a very high degree of risk involved in trading. Any information and/or content is intended entirely for research, educational and informational purposes only and does not constitute investment or consultation advice or investment strategy. The information is not tailored to the investment needs of any specific person and therefore does not involve a consideration of any of the investment objectives, financial situation or needs of any viewer that may receive it. Kindly also note that past performance is not a reliable indicator of future results. Actual results may differ materially from those anticipated in forward-looking or past performance statements. We assume no liability as to the accuracy or completeness of any of the information and/or content provided herein and the Company cannot be held responsible for any omission, mistake nor for any loss or damage including without limitation to any loss of profit which may arise from reliance on any information supplied by Everest Fortune Group.

EURUSD: focus on inflationThis week was calm when it comes to currently important US macro data. The most important event was related to the release of the FOMC meeting minutes from the June session. There was no new information revealed in the Minutes, which has not already been communicated with the public. The Fed is aimed to maintain flexibility around future rate cuts. They will most probably remain on hold until the economic data more clearly supports a slowdown. Analysts continue to be of the opinion that the Fed will most probably make the next rate cut somewhere in late 2025 and into 2026. Such opinion is supported with ongoing risks of both rising inflation and unemployment due to introduced trade tariffs, putting challenge to Fed officials.
Industrial Production in Germany during May increased by 1,2% for the month, which was much better from estimated 0%. Retail Sales in the Euro Zone dropped in May by -0,7%, bringing the indicator to the yearly level of 1,8%. Balance of Trade in Germany in May reached euro 18,4B, better from expected euro 15,5B. Inflation rate in Germany, final for June, was standing at the level of 0% for the month and 2% for the year. Both figures were in line with market expectations. Wholesale prices in Germany in June were higher by 0,2% and 0,9% on a yearly basis.
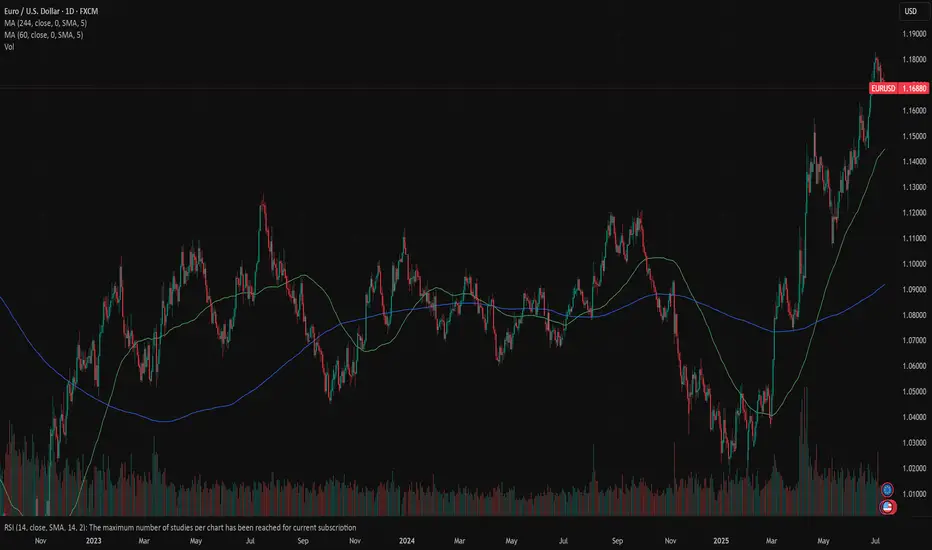
Markets favored US Dollar during the previous week, where the eurusd was traded within a range from 1,1790 down to 1,1670. The RSI moved from the overbought market side, ending the week at the level of 57. As long as the indicator is holding above the level of 50, there will be no indication that the market has started to clearly eye the oversold market side. At the same time, the MA50 continues to strongly diverge from MA200, within an indication of a potential slowdown in the coming period, as well as potential crossovers.
Although this week was a relatively calm one, the week ahead brings some important US macro data, including June inflation, PPI and University of Michigan Consumer Sentiment data. Considering current market sensitivity on any negative movements in inflation figures, the week ahead might bring some increased volatility on financial markets. As per current charts, eurusd has some space for a further move toward the downside, at least till the level of 1,1650. There is also potential for a short term reversal indicated on charts, with some potential that 1,1750 might be tested during the week.
Important news to watch during the week ahead are:
EUR: Industrial Production in the Euro Zone in May, ZEW Economic Sentiment Index in July in the EuroZone and Germany,
USD: Inflation Rate in June, Producers Price Index in June, Retail Sales in June, Building Permits preliminary for June, Housing Starts in June, Michigan Consumer Sentiment preliminary for July.
Week of 7/13/25: EURUSD AnalysisLast week's candle was a bearish engulfing meaning that most likely price will continue lower this week as a daily trend retracement. Waiting for LTF bearish price action before entering.
Major News:
Tuesday - CPI
Wednesday - PPI
Thursday - Unemployment

EURUSD Weakened By New Tariff Tensions With US This is the Weekly FOREX Forecast for the week of July 14 - 18th.
In this video, we will analyze the following FX market: EURSUD
The latest headlines tell the story. The tariffs are triggering a slow run to the USD safe haven. The previous week showed the USD Index closed pretty strong. There's a good chance we'll see more of the same this coming week.
Look for the strength in USD to continue to be supported by fundamental news, and outperform the other major currencies, including the EURO.
Buy USD/xxx
Sell xxx/USD
Enjoy!
May profits be upon you.
Leave any questions or comments in the comment section.
I appreciate any feedback from my viewers!
Like and/or subscribe if you want more accurate analysis.
Thank you so much!
Disclaimer:
I do not provide personal investment advice and I am not a qualified licensed investment advisor.
All information found here, including any ideas, opinions, views, predictions, forecasts, commentaries, suggestions, expressed or implied herein, are for informational, entertainment or educational purposes only and should not be construed as personal investment advice. While the information provided is believed to be accurate, it may include errors or inaccuracies.
I will not and cannot be held liable for any actions you take as a result of anything you read here.
Conduct your own due diligence, or consult a licensed financial advisor or broker before making any and all investment decisions. Any investments, trades, speculations, or decisions made on the basis of any information found on this channel, expressed or implied herein, are committed at your own risk, financial or otherwise.

ETHEREUM - ETH Weekly Recap & Projection 13.07.2025Current Structure
Ethereum is showing a clear bullish bias.
Last week’s price action broke above a significant weekly swing level with solid candle closures — suggesting continuation.
Short-Term Scenarios
We could see two potential outcomes:
• A consolidation range forming at current levels
• A short-term retracement influenced by Bitcoin’s movement
Due to ETH’s high correlation with BTC, traders should review Bitcoin’s chart to understand ETH’s likely path.
Trading Plan
Wait for Bitcoin to complete a retracement
Monitor ETH for LTF (lower timeframe) confirmation and bounce
Seek long setups below the CME Gap (pink line)
Step 2 will serve as the trigger to initiate any positions on ETH.
Macro Risk-On Catalyst – Powell Resignation?
There are growing rumors regarding Federal Reserve Chairman Jerome Powell potentially resigning.
If confirmed, this could result in a strong rally across risk assets, including ETH — likely pushing prices higher without traditional pullbacks.
Summary
• ETH broke major weekly structure
• Watch BTC for clues — correlation remains high
• Plan favors long entries after BTC retrace + ETH LTF confirmation
• Powell resignation rumors could accelerate bullish trend

EUR-USD Will Keep Growing! Buy!
Hello,Traders!
EUR-USD keep trading in
An uptrend along the rising support
So as the pair is approaching
A the support we will be
Expecting a bullish rebound
And a move up on Monday
Buy!
Comment and subscribe to help us grow!
Check out other forecasts below too!
Disclosure: I am part of Trade Nation's Influencer program and receive a monthly fee for using their TradingView charts in my analysis.
