A New Chapter Begins with EURUSD’s ABC Wave Formation!🎯 Hey Guys,
I’ve prepared a fresh EURUSD analysis for you.
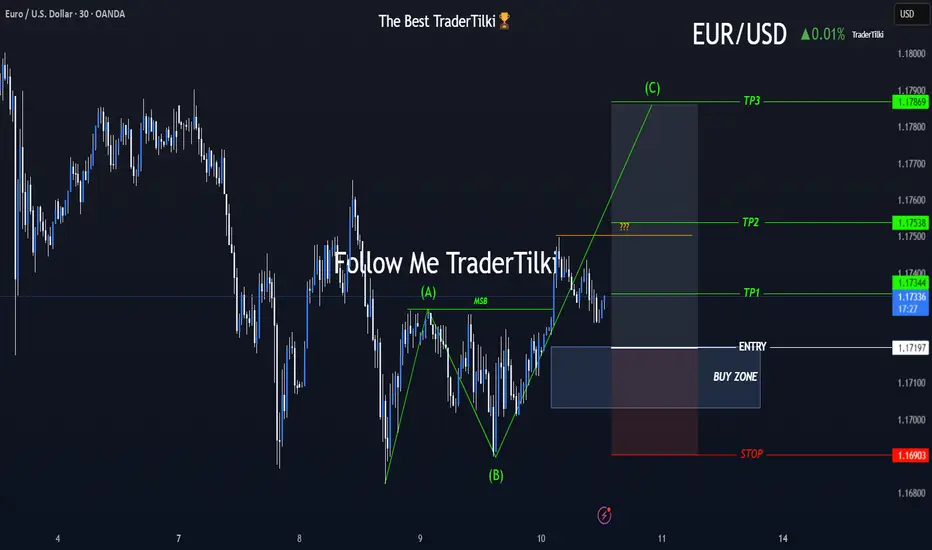
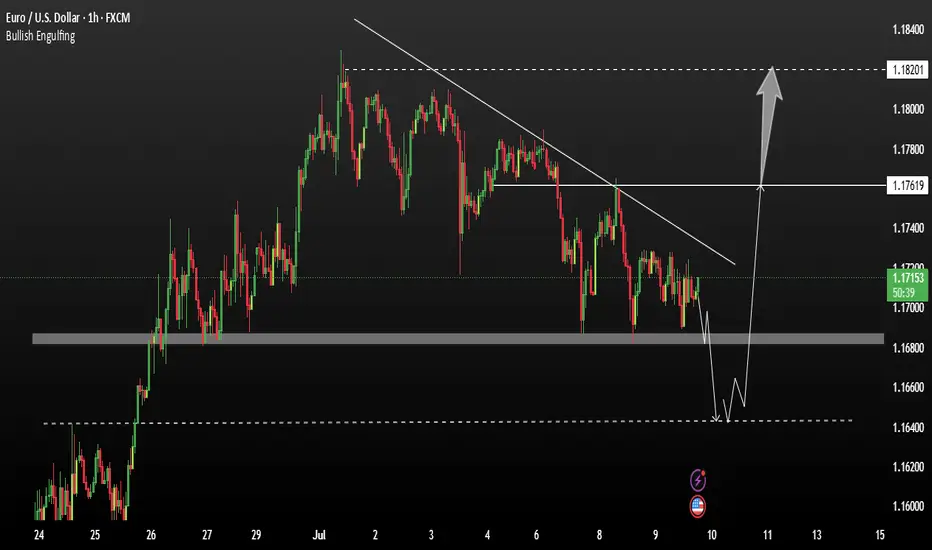
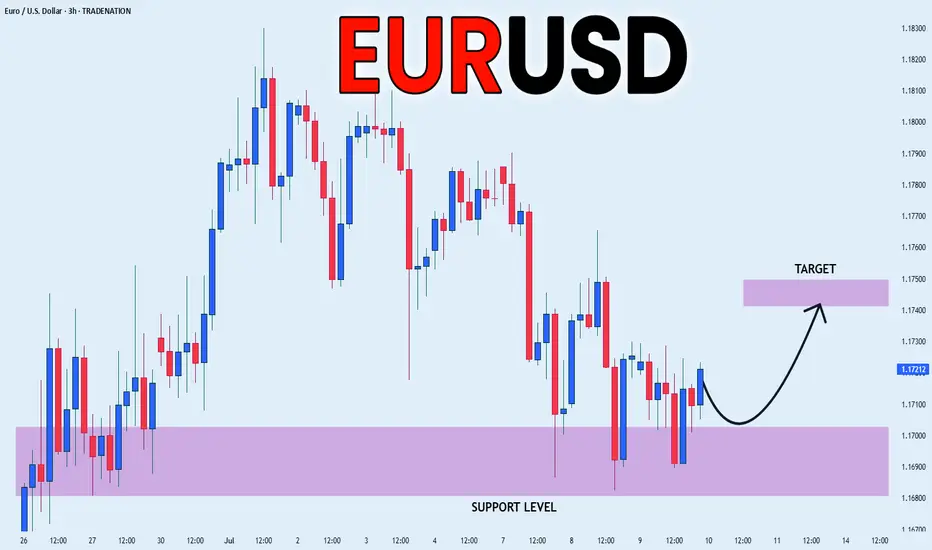
The market has shifted direction, and an ABC wave structure has emerged.
I’ve placed a Buy Limit order based on my entry level.
Below, you’ll find my detailed target zones and entry specifics:
🟩 Buy Limit Order: 1.17197
🟥 Stop Loss: 1.16903
📌 Targets:
🔹 TP1: 1.17344
🔹 TP2: 1.17538
🔹 TP3: 1.17869
📊 Risk/Reward Ratio: 2.27
Your likes and support are what keep me motivated to share these analyses consistently.
Huge thanks to everyone who shows love and appreciation! 🙏
USDEUR trade ideas
EURUSD & Gold Clean Trades & What’s Next | ARX InsightsIn this video, I walk through the key price action setups we observed today on EURUSD and Gold (XAUUSD), including why we took the trades and what structure we’re watching next.
This is an educational breakdown based on the ARX | Price & Time approach focused on confluence, execution logic, and trader mindset.
📌 Not financial advice. For educational purposes only.

MarketBreakdown | EURUSD, DOLLAR INDEX, BITCOIN, SILVER
Here are the updates & outlook for multiple instruments in my watch list.
1️⃣ #EURUSD daily time frame 🇪🇺🇺🇸
The price started a correctional movement after it updated
a high the first of July.
The market formed a bullish flag pattern.
Your next trend-following bullish signal will be a breakout and a daily
candle close above its resistance.
2️⃣ Dollar Index #DXY daily time frame 💵
The market corrects in a bearish flag pattern.
I see a test of a significant horizontal resistance cluster now.
Your signal to see will be a bearish violation of a support
of the flag and a daily candle close below.
3️⃣ #BITCOIN #BTCUSD daily time frame
Though the price managed to update the All-Time High
yesterday, the market did not manage to close above
a current major resistance.
I believe that we will see another attempt of the market to breakthrough.
Your bullish confirmation will be a daily candle close above the underlined resistance.
4️⃣ #SILVER #XAGUSD daily time frame 🪙
The price reached an important confluence demand zone
based on a rising trend line and a horizontal key structures support.
Probabilities will be high to see a bullish movement from that.
Do you agree with my market breakdown?
❤️Please, support my work with like, thank you!❤️
I am part of Trade Nation's Influencer program and receive a monthly fee for using their TradingView charts in my analysis.

US Jobless Claims: Why They Matter for EURUSD 🇺🇸FOREXCOM:EURUSD
📈 US Jobless Claims: Why They Matter for EURUSD 🇺🇸💼
While Trump’s tariff policies ⚔️ remain in focus, it’s important not to overlook today’s economic calendar 🗓️, with Initial Jobless Claims taking the spotlight.
🧐 What are Jobless Claims?
Initial Jobless Claims 📑 measure the number of people filing for state unemployment insurance for the first time. Released weekly by the US Department of Labor 🏛️, it’s a key indicator of the health of the US labor market 💪.
Why does it matter?
A strong labor market typically supports the US dollar 💵, as it reduces the likelihood of immediate Fed rate cuts 🕰️, while higher claims suggest a weakening economy, which could pressure the dollar lower.
📊 Latest Figures:
🔹 Previous: 233K
🔹 Forecast: 235K
Last week, claims fell from 237K to 233K, highlighting continued labor market resilience. If today’s data beats expectations (lower claims), the USD may strengthen 🛡️, potentially pushing EURUSD below 1.1700. Conversely, higher claims could weaken the USD ⚠️, lifting EURUSD above 1.1800.
💡 Trade Idea:
BUY EURUSD at 1.17300
❌ Stop Loss: 1.17600
✅ Take Profit: 1.16500
While the US labor market remains strong, technical factors and broader fundamentals can confirm a strong EURUSD reversal, keeping bearish opportunities in play.
🚀 Stay tuned for live reactions after the data drops!
💬 Support this post if you find it useful! 🔔
EURUSD Eyes Key Levels Ahead of DataFOREXCOM:EURUSD
EURUSD is trading within the 1.1680 – 1.1810 range 📊, continuing its upward momentum during the Asian and early European sessions 🌏⬆️.
⚡️ Markets are now focusing on potential trade negotiations with India and the EU 🤝, which could shape near-term currency moves and risk sentiment 🌐.
📈 Today at 12:30 p.m. UTC 🕧, the U.S. Jobless Claims report 📑 may trigger volatility across all USD pairs ⚠️. Stronger-than-expected data could delay Fed rate cuts 🕰️🔻 and push EURUSD below 1.1700 🩻, while weaker figures may weigh on the U.S. dollar 💵⬇️ and lift EURUSD above 1.1800 🚀.
👀 We will monitor these levels closely for potential breakout opportunities. Stay tuned for live updates!
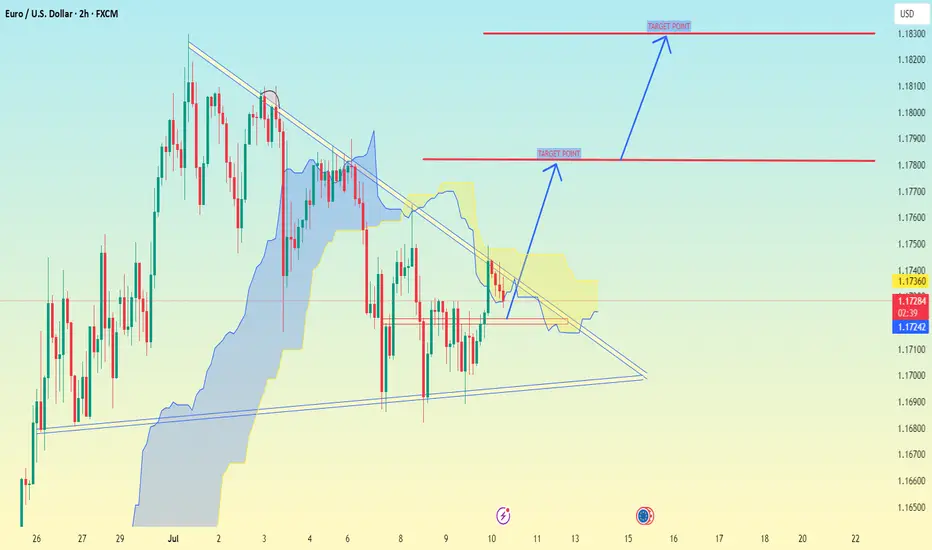
EUR/USD (Euro / U.S. Dollar) 2-hour chart analysis.EUR/USD (Euro / U.S. Dollar) 2-hour chart analysis, here's the breakdown:
---
📈 Chart Setup Observations:
The pair is showing a bullish breakout from a descending triangle or falling wedge pattern.
Price is above the Ichimoku Cloud, suggesting a potential shift to bullish momentum.
There are two clearly marked target points on your chart.
---
🎯 Target Levels:
1. Target Point 1 (TP1): Approximately 1.78000
2. Target Point 2 (TP2): Approximately 1.18300
---
🔰 Support Zone / Potential Stop-Loss:
Around 1.17200, where recent consolidation and trendline support can be seen.
---
✅ Summary:
If the bullish breakout holds and momentum continues, the pair could reach:
TP1: ~1.78000 (short-term target)
TP2: ~1.18300 (medium-term target)
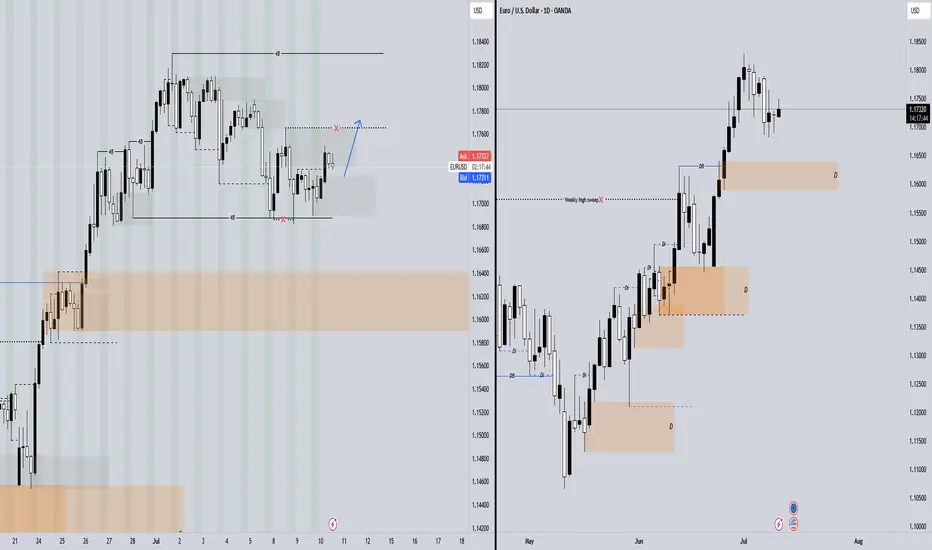
EURUSD Could leading Bullish correctionEURUSD has shown significant bullish momentum after breaking its previous structure. The pair is now undergoing a local corrective phase, which is healthy within an overall upward trend.
Currently, the price remains in a bullish model, suggesting that the correction may be short-lived before a continuation toward the key resistance zone.
Resistance zone 1.17620 / 1.18220
Support Level 1.16800 1.17450
A false breakdown below the identified support level could trigger renewed buying interest, shifting market sentiment in favour of bulls and potentially accelerating the next upward leg.
Ps Support with like and comments for more better analysis Thanks.
EURUSDeurusd, sell analysis. feel free to hop on this
not a financial advice. do your due dilligence
#AN017: Dirty Levels in Forex: How Banks Think
In the world of Forex, many retail traders are accustomed to seeking surgical precision in technical levels. Clear lines, pinpoint support, geometric resistance. But the truth is that the market doesn't move in such an orderly fashion.
I'm Forex Trader Andrea Russo, and I thank my Official Broker Partner in advance for supporting us in writing this article.
Institutions—banks, macro funds, hedge funds—don't operate to confirm textbook patterns. Instead, they work to manipulate, accumulate, and distribute positions as efficiently as possible. And often, they do so precisely at the so-called "dirty levels."
But what are these dirty levels?
They are price zones, not individual lines. They are areas where many traders place stop losses, pending orders, or breakout entries, making them an ideal target for institutional players. The concept of a dirty level arises from the fact that the price fails to respect the "perfect" level, but breaks it slightly and then retraces its steps: a false breakout, a trap, a hunt for stops.
Banks are very familiar with the behavior of retail traders. They have access to much more extensive information: aggregated positioning data, open interest in options, key levels monitored by algorithms. When they see concentrations of orders around a zone, they design actual liquidity triggers. They push the price just beyond the key level to "clean" the market, generate panic or euphoria, and then initiate their actual trade.
How are these levels identified?
A trader who wants to operate like an institution must stop drawing sharp lines and start thinking in trading bands. A dirty level is, on average, a zone 10 to 15 pips wide, around a psychological level, a previous high/low, or a breakout area. But technical structure alone is not enough. It's important to observe:
Volume density (volume profile or book visibility)
Aggregate retail sentiment (to understand where stops are placed)
Key option levels (especially gamma and maximum pain)
Rising open interest (as confirmation of institutional interest)
When a price approaches a dirty level, you shouldn't enter. You should wait for manipulation. The price often briefly breaks above that range, with a spike, and only then does it retrace its steps in the opposite direction. That's when banks enter: when retail has unloaded its positions or been forced into trading too late. The truly expert trader enters after the level has been "cleaned," not before.
This type of reading leads you to trade in the opposite way to the crowd. It forces you to think ahead: where they want you to enter... and where they actually enter. And only when you begin to recognize these invisible patterns, when you understand that the market is not linear but designed to deceive you, do you truly begin to become a professional trader.
Conclusion?
Trading isn't about predicting the price, but predicting the intentions of those who actually move the market. Dirty levels are key. Those who know how to read manipulation can enter profitably, before the real acceleration. And from that moment, they'll never look back.

EURUSD Will Go Lower! Short!
Please, check our technical outlook for EURUSD.
Time Frame: 30m
Current Trend: Bearish
Sentiment: Overbought (based on 7-period RSI)
Forecast: Bearish
The market is approaching a key horizontal level 1.172.
Considering the today's price action, probabilities will be high to see a movement to 1.170.
P.S
The term oversold refers to a condition where an asset has traded lower in price and has the potential for a price bounce.
Overbought refers to market scenarios where the instrument is traded considerably higher than its fair value. Overvaluation is caused by market sentiments when there is positive news.
Disclosure: I am part of Trade Nation's Influencer program and receive a monthly fee for using their TradingView charts in my analysis.
Like and subscribe and comment my ideas if you enjoy them!

Euro H4 | Multi-swing-low support at 38.2% Fibonacci retracementThe Euro (EUR/USD) is falling towards a multi-swing-low support and could potentially bounce off this level to climb higher.
Buy entry is at 1.1684 which is a multi-swing-low support that aligns with the 38.2% Fibonacci retracement.
Stop loss is at 1.1570 which is a level that lies underneath an overlap support and the 61.8% Fibonacci retracement.
Take profit is at 1.1807 which is a swing-high resistance.
High Risk Investment Warning
Trading Forex/CFDs on margin carries a high level of risk and may not be suitable for all investors. Leverage can work against you.
Stratos Markets Limited (tradu.com ):
CFDs are complex instruments and come with a high risk of losing money rapidly due to leverage. 63% of retail investor accounts lose money when trading CFDs with this provider. You should consider whether you understand how CFDs work and whether you can afford to take the high risk of losing your money.
Stratos Europe Ltd (tradu.com ):
CFDs are complex instruments and come with a high risk of losing money rapidly due to leverage. 63% of retail investor accounts lose money when trading CFDs with this provider. You should consider whether you understand how CFDs work and whether you can afford to take the high risk of losing your money.
Stratos Global LLC (tradu.com ):
Losses can exceed deposits.
Please be advised that the information presented on TradingView is provided to Tradu (‘Company’, ‘we’) by a third-party provider (‘TFA Global Pte Ltd’). Please be reminded that you are solely responsible for the trading decisions on your account. There is a very high degree of risk involved in trading. Any information and/or content is intended entirely for research, educational and informational purposes only and does not constitute investment or consultation advice or investment strategy. The information is not tailored to the investment needs of any specific person and therefore does not involve a consideration of any of the investment objectives, financial situation or needs of any viewer that may receive it. Kindly also note that past performance is not a reliable indicator of future results. Actual results may differ materially from those anticipated in forward-looking or past performance statements. We assume no liability as to the accuracy or completeness of any of the information and/or content provided herein and the Company cannot be held responsible for any omission, mistake nor for any loss or damage including without limitation to any loss of profit which may arise from reliance on any information supplied by TFA Global Pte Ltd.
The speaker(s) is neither an employee, agent nor representative of Tradu and is therefore acting independently. The opinions given are their own, constitute general market commentary, and do not constitute the opinion or advice of Tradu or any form of personal or investment advice. Tradu neither endorses nor guarantees offerings of third-party speakers, nor is Tradu responsible for the content, veracity or opinions of third-party speakers, presenters or participants.

EURUSD BUYTake trade on your own risk!
clear broke supply & demand zone, will now be moving upwards.
Set TP: 1.17607

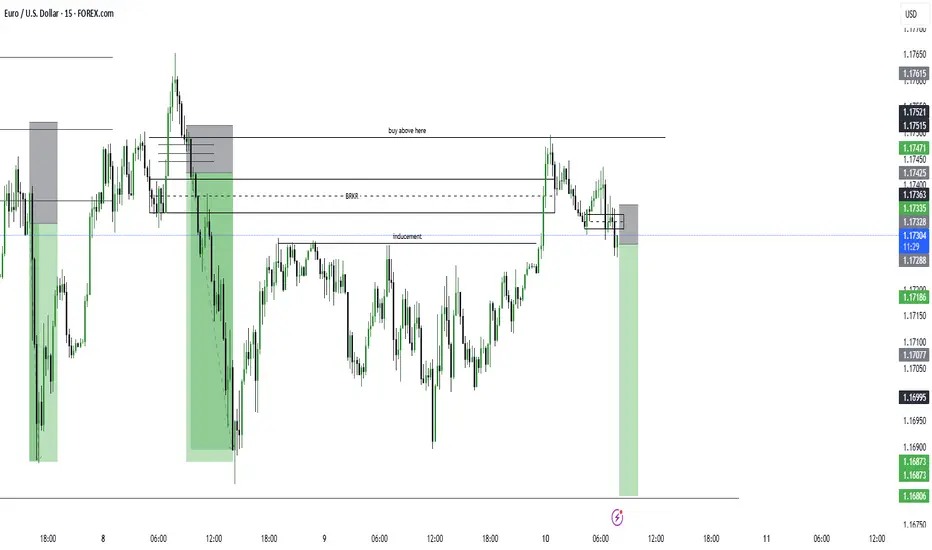
Price Grabbed Liquidity and Demand FormedHello Traders,
Today on EUR/USD, we observed a sweep of the sell-side liquidity (SSL), where price failed to close below and instead left a strong wick—indicating a potential institutional move. A fresh demand zone has now formed, suggesting that price is likely to target the nearest high before initiating a deeper move to the downside. With lower time frame (LTF) confirmation, this setup presents a high-probability trading opportunity.
Eurousd techinical analysis.Eurousd techinical analysis next move posibale at h1 time frame.not finchinal advice.

EURUSD Reaches Monthly Overbought RSI Last Seen in 2020Unlike the DXY, EURUSD has broken above the upper boundary of its 17-year descending channel. However, further upside may be capped as the DXY retests its 17-year support and monthly RSI retests 2020 overbought levels.
A clean break and hold above 1.1830 could open the path toward 1.20 and 1.24. On the downside, if the pair pulls back below 1.17, support levels at 1.14, 1.12, and 1.10 may come into play — aligning with the former channel resistance, now acting as support.
- Razan Hilal, CMT

The trend continues for EURUSDYesterday, EURUSD once again tested the support level at 1,1683 and bounced off it.
The uptrend remains strong, and we are monitoring for its continuation.
All positions should align with the main trend.
Watch for the end of the current pullback as a potential buying opportunity.
The next resistance levels are 1,1813 and 1,1916!

EUR/USD SHORT Entry Zone:
Sell #1: 1.17600
Sell #2: 1.17650
Sell #3: 1.17710
Stop Loss: 1.17960
TP1: 1.17250 (95%)
TP2: 1.17050 ( 87%)
TP3 (optional): 1.16840 (76%)
Good luck !

EURUSD IDEAExpecting a retracement to the supply zone to either clear liquidity before falling or rise further to the Economist predicted level of 120 level
Like and follow for more ideas on the market

EUR/USD: A High-Probability Short Setup at 1.1829At its core, this trade is driven by a powerful and growing divergence between the US and European economies. While technicals tell us where to trade, fundamentals tell us why we're trading.
1️⃣ The Interest Rate Gap: The U.S. currently offers significantly higher interest rates (4.25% - 4.50%) compared to the Eurozone (2.15%). This makes holding the US Dollar more attractive, creating natural downward pressure on the EUR/USD.
2️⃣ Central Bank Policy: The US Federal Reserve remains hawkish, focused on strength and fighting inflation. Meanwhile, the European Central Bank is dovish, signaling a willingness to keep conditions loose to support a weaker economy.
3️⃣ Labor Market Strength: The US enjoys a robust labor market with unemployment at just 4.1%, while the Eurozone's is significantly higher at 6.3%. This points to a stronger US economy.
In simple terms, the US economy is strong, and its central bank is acting like it. The Eurozone economy is weaker, and its central bank is acting accordingly. This fundamental imbalance is the fuel for a potential significant move down in EUR/USD.
The Technical Picture: The Wall at 1.1829
As you can see on the 4H chart, the price has run into a major wall of resistance at the 52-week high of 1.1829 . After a long uptrend, the momentum has stalled, and the price is now consolidating inside a symmetrical triangle . This coiling of price action often precedes a strong breakout.
Our strategy is not to guess the breakout, but to act on a high-probability retest of resistance. We are looking to enter a short position as the price pulls back towards the upper boundary of this triangle, anticipating a failure at resistance and a subsequent break to the downside.
The Actionable Trade Plan
This setup offers an excellent risk/reward profile.
📉 Asset: EUR/USD
👉 Entry (Limit Sell): 1.1780
⛔️ Stop Loss: 1.1850
🎯 Take Profit: 1.1600
📈 Risk/Reward Ratio: ~2.57:1
Trade safe and manage your risk.

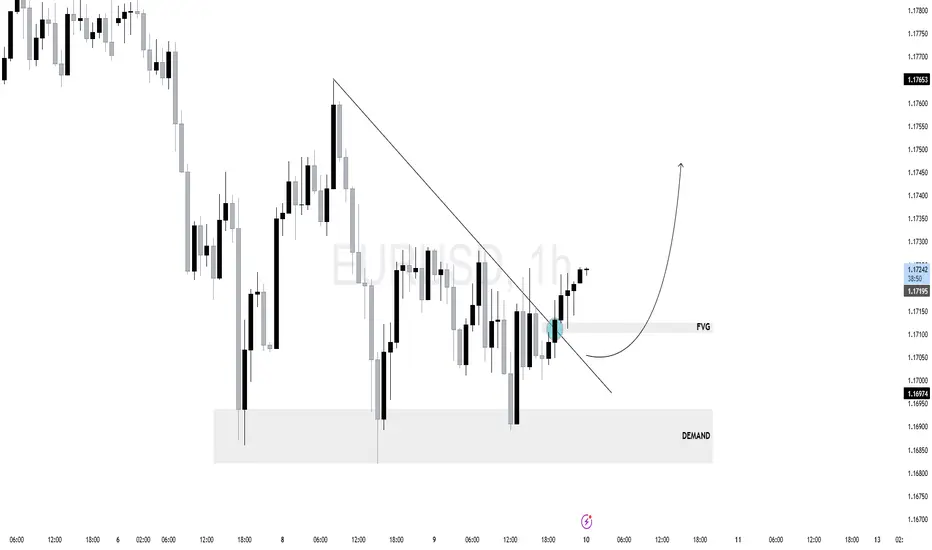
$EU (EURUSD) 1HPrice has been in a short-term downtrend with lower highs and lower lows. Recently, price tapped into a clear demand zone (marked gray at the bottom), showing strong bullish rejection and mitigation.
A clean break of the descending trendline confirms a potential shift in market structure.
Price has now retraced into a Fair Value Gap (FVG) after the breakout — a bullish continuation setup.
As long as price holds above the FVG and demand zone, expect a continuation toward external liquidity above - Demand Zone (1.16700–1.16950)
If price breaks back below the FVG and especially under the demand zone, the bullish scenario weakens
EUR_USD LOCAL REBOUND|LONG|
✅EUR_USD has retested a key support level of 1.1690
And as the pair is already making a bullish rebound
A move up to retest the supply level above at 1.1744 is likely
LONG🚀
✅Like and subscribe to never miss a new idea!✅
Disclosure: I am part of Trade Nation's Influencer program and receive a monthly fee for using their TradingView charts in my analysis.
EurUsd - This is the deadly breakout!EurUsd - FX:EURUSD - is about to fly:
(click chart above to see the in depth analysis👆🏻)
EurUsd has been rallying about +15% over the past couple of months. Additionally the breakout at the current resistance trendline is about to be confirmed. Subsequently EurUsd is setting up for another major move higher, which will be painful for all European traders.
Levels to watch: $1.23, $1.11
Keep your long term vision🙏🙏
Philip (BasicTrading)

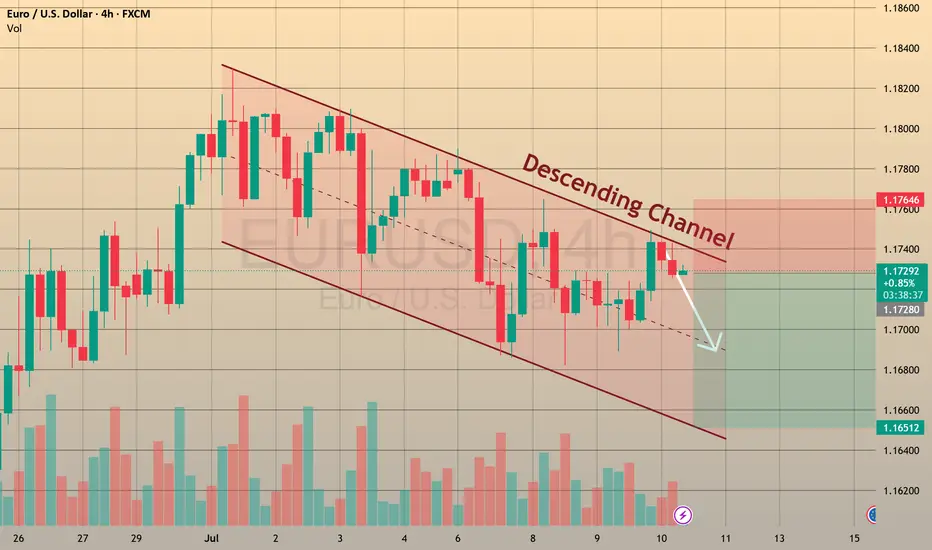
Eurousd techinical analysis.This chart of EUR/USD (1-hour timeframe) illustrates a bearish setup based on price action, resistance zones, and a descending trendline. Here's a breakdown of what's shown:
Key Components in the Chart:
1. Descending Trendline (Blue):
Indicates lower highs, showing bearish pressure.
2. Resistance Zone (~1.1725–1.1735):
Price is expected to test this zone.
If rejected again, it reinforces the bearish setup.
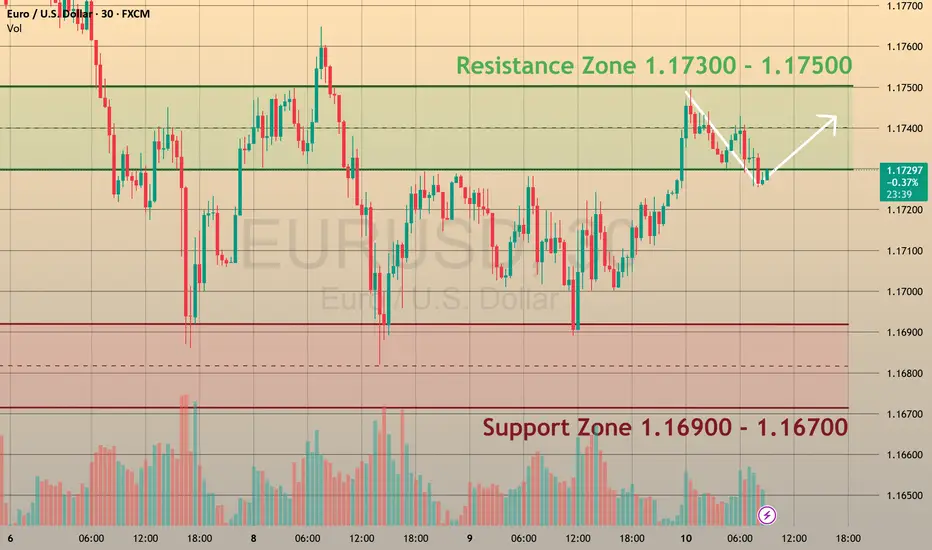
3. Short-Term Range (Mini Boxes):
Blue zigzag lines suggest a possible liquidity grab or false breakout above minor highs before reversal.
4. Bearish Target Zones:
First target: ~1.1700 (short-term support).
Second target: ~1.1690 (stronger support zone).
---
Outlook Based on This Chart:
Bias: Bearish (as long as price stays below the trendline).
Entry Zone: Near resistance (1.1725–1.1735).
Confirmation: Rejection candles or bearish engulfing in the resistance zone.
Invalidation: Clear breakout and close above the trendline.
Let me know if you want a trading plan based on this setup (entry, SL, TP), or if you'd like me to review the same pair in a different timeframe.
