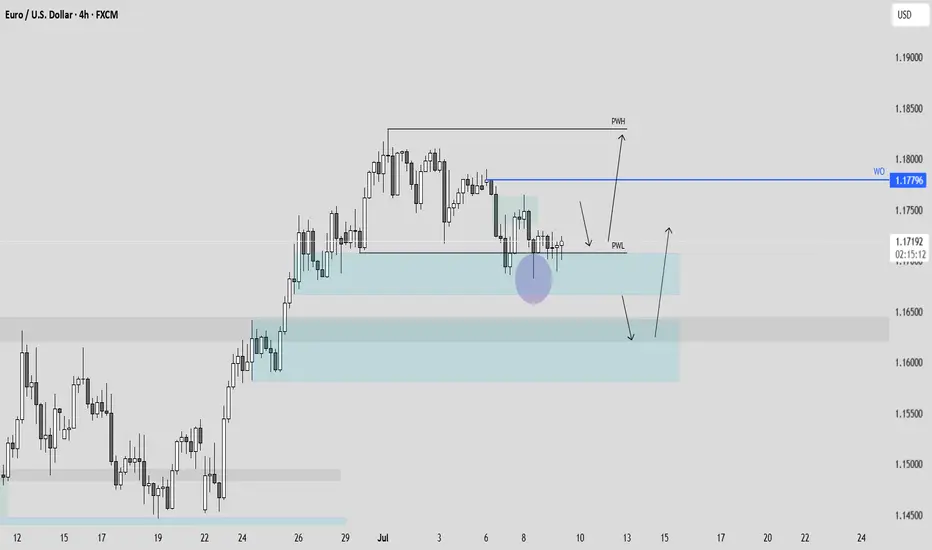
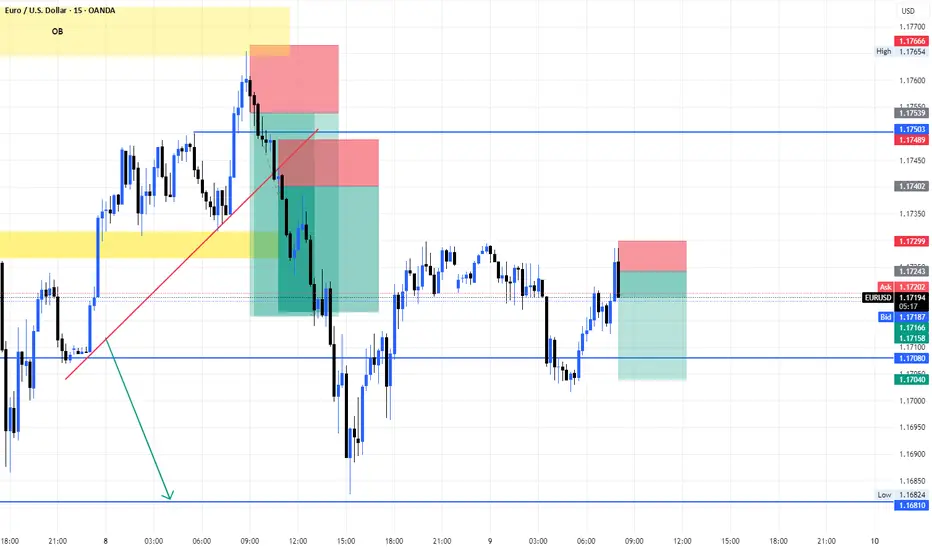
EURUSD - Compression Before Expansion? Key Reversal ZoneEURUSD is currently trading within a clear descending channel after rejecting a key resistance area. This move signals a shift in short-term sentiment, with bearish momentum guiding price action lower. The channel structure is intact, and as long as price respects this slope, lower levels remain in play.
Rejection From Resistance
After tapping into the major resistance zone, price failed to break higher and began forming lower highs and lower lows, confirming seller control. The rejection was clean and initiated the current bearish structure, which now serves as a roadmap for potential continuation lower.
Imbalance and Downside Targets
Below current price, there’s a visible imbalance that remains unfilled within the highlighted purple zone. This area acts as a magnet for price, especially if the bearish structure continues. A drop into this zone would align with a textbook move to fill inefficiency before a potential reversal can occur.
Support Structure and Liquidity Zone
There’s a strong support level marked just above the imbalance, which may offer a temporary reaction or even serve as a springboard for a reversal. This is also a likely liquidity pool, and a sweep of these lows could generate the fuel needed for a bullish move back toward mid-channel or even higher.
Projection and Scenarios
Price may either continue respecting the channel boundaries with stair-step retracements down into the imbalance, or break structure early with a more aggressive reversal once the inefficiency is filled. A deeper move into the purple zone followed by a reaction would suggest a potential shift in momentum.
Conclusion
The pair remains in a bearish corrective phase for now, with room to dip further into the unmitigated imbalance. Watch for how price reacts at support and whether a clean sweep and reversal setup presents itself. Until then, the channel remains the dominant structure guiding this move.
Disclosure: I am part of Trade Nation's Influencer program and receive a monthly fee for using their TradingView charts in my analysis.
___________________________________
Thanks for your support!
If you found this idea helpful or learned something new, drop a like 👍 and leave a comment, I’d love to hear your thoughts! 🚀
USDEUR trade ideas

EURUSD 60/15 Pullback ShortThe 1hr chart is showing bear. Drop down to 15min, for 2-day is also bear.
I have 2 plans. Plan A is immediate. But if poke through the sell zone, then the outer zone will eventually hit and fall.
Hope New York can bring it down soon.
Set alarm at 1.17321

EURUSD CONSOLIDATION BEFORE A BULLISH CONTINUATION?I've been bearish on TVC:DXY for the past months. Not only technically but also fundamentally. If you know DOLLAR AND CMCMARKETS:EURUSD have a negative correlation. In this case a bearish dollar means a bullish EU. Currently looking for more price action to confirm potential buy trades. If dollar decides to retrace more we will adapt and change the biais
WHAT DO YOU THINK?
EURUSD On The Rise! BUY!
My dear friends,
My technical analysis for EURUSD is below:
The market is trading on 1.1709 pivot level.
Bias - Bullish
Technical Indicators: Both Super Trend & Pivot HL indicate a highly probable Bullish continuation.
Target - 1.1729
About Used Indicators:
A pivot point is a technical analysis indicator, or calculations, used to determine the overall trend of the market over different time frames.
Disclosure: I am part of Trade Nation's Influencer program and receive a monthly fee for using their TradingView charts in my analysis.
———————————
WISH YOU ALL LUCK

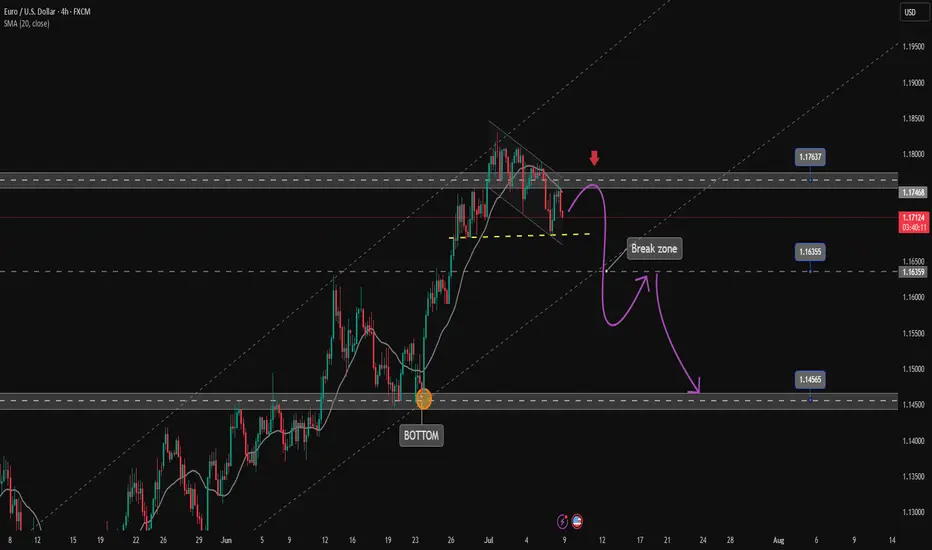
Confirming EURUSD corrective downtrend✏️EURUSD is trading in a downtrend channel. SELL signal is triggered at the current price around 1.172 as the H4 candle failed to break 1.176 and confirmed the Sellers' entry into the market clearly. Target for the downtrend is at 1.145, the Sellers' strength needs to overcome the Break out zone of 1.163 first.
📈 Key level
Support 1.163-1.146
Resistance 1.176
SELL DCA Trigger: Break 1.163
BUY Trigger: The price trades about 1.163.
EURUSD: Expecting Bullish Movement! Here is Why:
Looking at the chart of EURUSD right now we are seeing some interesting price action on the lower timeframes. Thus a local move up seems to be quite likely.
Disclosure: I am part of Trade Nation's Influencer program and receive a monthly fee for using their TradingView charts in my analysis.
❤️ Please, support our work with like & comment! ❤️
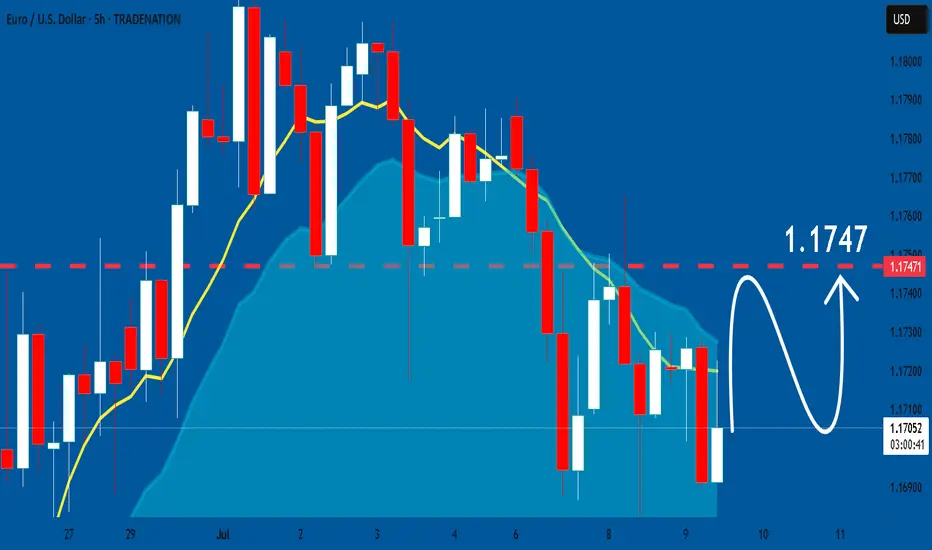
EURUSD: Next Move Is Up! Long!
My dear friends,
Today we will analyse EURUSD together☺️
The recent price action suggests a shift in mid-term momentum. A break above the current local range around 1.17041 will confirm the new direction upwards with the target being the next key level of 1.17163 and a reconvened placement of a stop-loss beyond the range.
❤️Sending you lots of Love and Hugs❤️

EURUSD – Smart Money Trap Setup in PlayPair: EURUSD
🔹 Timeframe: 30 Min
🔹 Bias: Bearish (Short Setup Expected)
🔹 Current Price: 1.17358
---
💡 Market Breakdown:
The pair is approaching a premium zone (1.17381 – 1.17567) where smart money may induce liquidity grabs before a sharp sell-off.
The structure shows a clear Break of Structure (BoS) followed by a Change of Character (Choch) confirming bearish intention.
---
📌 Key Zones:
🔵 Supply Zone: 1.17381 – 1.17567
🔺 Liquidity Sweep Zone (Fakeout Expected): 1.17400 – 1.17431
🔻 Target Zone 1: 1.17096
🔻 Target Zone 2: 1.16829
❌ Invalidation Above: 1.1760
---
🎯 Trade Plan:
Wait for price to tap into the red supply zone (1.174xx), then look for bearish confirmation like a strong rejection or engulfing candle.
Expect a fast drop after smart money traps buyers.
---
📌 Smart Money Concept Used:
🔹 Inducement → Entry → Expansion
🔹 BOS → CHoCH → Imbalance Fill
---
🧠 Remember:
"Price doesn’t move randomly — it’s engineered by intent."

EURUSD longWe are in clear up trend. Daily and all TF bellow are bullish. We are buying at low area. Price make divergence. We are already on breakeven and waiting for evening FOMC.

EURUSDHello Traders! 👋
What are your thoughts on EURUSD?
Following its recent rally, EURUSD has reached a key resistance zone, which also aligns with a trendline. The pair failed to break above this area and has been rejected.
Given the weak momentum and bearish reaction, we do not expect a breakout at this stage.
Instead, we anticipate some consolidation around the resistance, followed by a downward move toward the specified support level.
Don’t forget to like and share your thoughts in the comments! ❤️


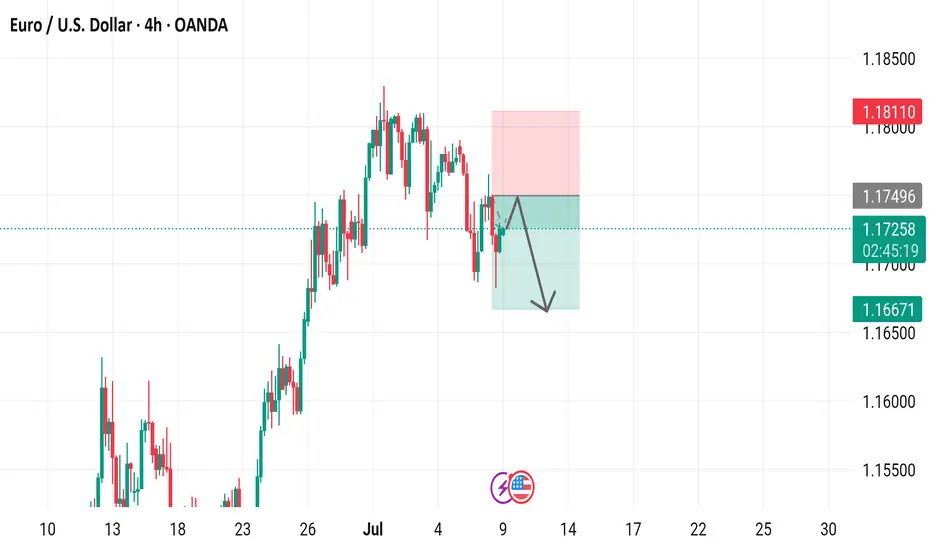
EUR/USD 4-Hour Chart Analysis4-hour candlestick chart for the Euro/U.S. Dollar (EUR/USD) currency pair on the OANDA platform. The chart shows a recent upward trend followed by a consolidation phase, with key technical levels and trading signals indicated. The presence of "SELL" and "BUY" signals suggests active trading opportunities. The downward arrow within the shaded area hints at a potential bearish move. This chart is likely used by traders to analyze short-term price movements and make informed decisions.


Btcusd techinical analysis.Btcusd techinical analysis next move posibale at h1 time frame.not finchinal advice.

What is Dynamic Support and Resistance Levels & Zones in Forex
Dynamic supports and resistances play a crucial role in technical analysis.
Unlike classic supports and resistances, these zones change and adapt to a market price action in real time.
Learn what is dynamic support and resistance in Forex, Gold trading and how to find it easily.
Discover its main types and real market examples.
Let's start with the basics.
There are 2 major types of supports and resistances in technical analysis.
The first type is called static .
Such supports and resistances are fixed and don't change with time.
It should be strictly horizontal key levels or the zones.
Market price action and momentum beyond them do not affect these supports and resistances.
In the example above, you can find static supports and resistances on Gold. The market may return to one of those levels or the zones today, tomorrow or in a month, but it will not move.
In comparison to static supports and resistances, the dynamic ones shift with time. They constantly change and adjust as the time flies.
One of the obvious types of dynamic supports and resistances is a trend line.
Above is the example of a dynamic rising support based on trend line.
As the time goes, a support shifts and becomes higher and higher.
I found a great example of a dynamic resistance on Dollar Index.
Depending on the moment when the price tests that, the resistance will be on different levels.
The later the price tests the trend line, the lower is the resistance.
When newbie traders learn dynamic supports and resistances, they usually stop on trend lines.
But it is just a beginning.
Really significant dynamic supports are resistances will be the zones .
The areas based on static horizontal supports and resistances and trend lines.
Examine a price action on GBPCHF forex pair.
We have a static horizontal support area and a dynamic rising trend line.
Two supports intersect, composing a contracting dynamic support zone.
With time, it will become narrower, accumulating buy orders within.
On NZDCAD forex pair, I underlined a contracting dynamic resistance zone that is based on an intersection of a static horizontal resistance area and a falling trend line.
Selling orders will be distributed within.
The 2 dynamic support and resistance zones that we discussed are narrowing , but that is not always the case.
A dynamic support zone that I found on GBPNZD is expanding and broaden with time.
It is based on a dynamic falling trend line and a static horizontal support.
With time its boundaries will be wider and a bullish reaction may initiate from any level within that.
A dynamic resistance area that I spotted on EURCAD forex pair is a great example of an expanding resistance.
It is based on a static horizontal resistance and a rising trend line.
We can easily recognize how it grows with time.
Of course, another types of dynamic supports and resistances exist. But they are more nuanced and rare.
As soon as you learn to recognize the clusters that we discussed in this article, you will be able to recognize the less obvious ones as well.
Next time, when you execute a support and resistance analysis, try to find a dynamic zone. You can find it on any time frame, and forex pair and gold, and it will completely change your perspective on the market.
❤️Please, support my work with like, thank you!❤️
I am part of Trade Nation's Influencer program and receive a monthly fee for using their TradingView charts in my analysis.

check the trendIt is expected that the correction trend will continue to form until the specified support levels. Then there will be a possibility of a trend change. The specified time frame can cause a trend change on the chart.

EUR/USD Bears Maintain Control as ECB Caution Weigh on EuroTechnical Analysis
The EUR/USD 4-hour chart reflects ongoing bearish pressure after failing to sustain above the 1.17647 resistance zone, indicating sellers are currently dominating the market. The pair trades below the 20-period EMA (blue line), which is beginning to slope downwards, confirming short-term bearish momentum.
Price action remains beneath the middle Bollinger Band, emphasizing seller control over the near-term price direction. Recent candlesticks show multiple rejections from the 1.17164 level (61.8% Fibonacci retracement), indicating strong resistance and failed attempts to push higher. The overall momentum suggests a potential continuation of the downward move unless bullish momentum returns decisively.
Failure to hold the support near 1.16865 would expose the pair to deeper declines targeting the Fibonacci extension zones between 1.16650 and 1.16380 and possibly lower.
Alternative Scenario:
Conversely, a break and sustained close above 1.17164 (61.8% retracement) could trigger a short-term rebound, potentially challenging the 1.17647 resistance level.
Fundamental Outlook
ECB officials' speeches today will reinforce the cautious policy stance, maintaining rates steady amid external uncertainties.
US crude oil inventory reports and the Atlanta Fed GDPNow forecast will be key in assessing inflationary pressures and economic growth.
The FOMC meeting minutes release will be critical for signaling the Fed's future monetary policy intentions, which remain a key driver for the dollar’s strength.

Eurusd so we have a potential Long setup but we need to look for SMS Shift in market structure to place a long otherwise we have to go with short so as of now monitor the price and then place your Trade

EURUSD and GBPUSD Analysis todayHello traders, this is a complete multiple timeframe analysis of this pair. We see could find significant trading opportunities as per analysis upon price action confirmation we may take this trade. Smash the like button if you find value in this analysis and drop a comment if you have any questions or let me know which pair to cover in my next analysis.

EURusd Short position 09/07/2025English : According to our analysis, we anticipate a bearish scenario.
Morocan Darija : kanchofo d'apres l'analyse dyalna antsanaw hboot
ATENTION : I only share my ideas, not signal
Fundamental Analysis of EUR/USD – Prolonged War and the Contagio🔍 Fundamental Analysis of EUR/USD – Prolonged War and the Contagion of Uncertainty
German Chancellor Olaf Scholz has stated that diplomatic efforts to end the war in Ukraine have reached a deadlock. In parallel, Donald Trump’s recent remarks expressing dissatisfaction with Putin further reinforce expectations that the conflict may continue.
The recent 300-pip rally in the euro was primarily fueled by optimism over a potential ceasefire. However, as I previously noted, a broader underlying factor contributing to the euro’s strength has been capital flight from the U.S. dollar, driven by increasing uncertainty in the U.S. political and financial outlook.
Now, with the possibility of a prolonged war back on the table, investor confidence in the eurozone may also start to waver. This uncertainty is not solely rooted in the war itself, but rather reflects a spillover effect—as capital fleeing U.S. markets seeks alternatives, it simultaneously transmits fear and instability into the euro area.
In this context, one might say that the economy behaves like a virus: not because of geopolitical conflict alone, but because investor sentiment and uncertainty spread rapidly across borders, infecting markets on a global scale.

EURUSD BearishRemember that markets hunt liquidity
Euro has much better liquidity lower for better buys
Euros is forming lower lows and lower highs
1.16900 is still high to buy
Looking to sell around 1.17145
TP 1.16300
