USDEUR trade ideas

EURUSD Will Go Up! Buy!
Here is our detailed technical review for EURUSD.
Time Frame: 6h
Current Trend: Bullish
Sentiment: Oversold (based on 7-period RSI)
Forecast: Bullish
The market is trading around a solid horizontal structure 1.169.
The above observations make me that the market will inevitably achieve 1.177 level.
P.S
The term oversold refers to a condition where an asset has traded lower in price and has the potential for a price bounce.
Overbought refers to market scenarios where the instrument is traded considerably higher than its fair value. Overvaluation is caused by market sentiments when there is positive news.
Disclosure: I am part of Trade Nation's Influencer program and receive a monthly fee for using their TradingView charts in my analysis.
Like and subscribe and comment my ideas if you enjoy them!

EUR/USD Price Action – Liquidity Grab & Demand Zones This 1-hour EUR/USD chart highlights key intraday price levels and potential trading zones. The chart identifies the Previous Day High (PDH), New York Session High (NY HIGH), and Previous Day Low (PDL). A notable Trap/Demand Zone just below the Asia High suggests a potential liquidity grab before a reversal or continuation move. Price is currently reacting within this zone, and traders may watch for confirmations of either a bullish continuation toward the PDH or a bearish rejection back to the PDL. The marked zones serve as potential trade entry/exit reference points for intraday strategies.

EURUSD Energy buildup supported at 1.1590The EURUSD currency pair continues to exhibit a bullish price action bias, supported by a sustained rising trend. Recent intraday movement reflects a sideways consolidation breakout, suggesting potential continuation of the broader uptrend.
Key Technical Level: 1.1640
This level marks the prior consolidation range and now acts as pivotal support. A corrective pullback toward 1.1640 followed by a bullish rejection would reinforce the bullish trend, targeting the next resistance levels at:
1.1830 – Near-term resistance
1.1900 – Minor swing high
1.1940 – Longer-term bullish objective
On the other hand, a decisive daily close below 1.1640 would invalidate the bullish setup, shifting the outlook to bearish in the short term. This could trigger a deeper retracement toward:
1.1590 – Initial support
1.1530 – Key downside target
Conclusion:
As long as 1.1640 holds as support, the technical outlook remains bullish, favoring long positions on dips. A confirmed break below this level would signal a shift in sentiment and open the door to a corrective pullback phase.
This communication is for informational purposes only and should not be viewed as any form of recommendation as to a particular course of action or as investment advice. It is not intended as an offer or solicitation for the purchase or sale of any financial instrument or as an official confirmation of any transaction. Opinions, estimates and assumptions expressed herein are made as of the date of this communication and are subject to change without notice. This communication has been prepared based upon information, including market prices, data and other information, believed to be reliable; however, Trade Nation does not warrant its completeness or accuracy. All market prices and market data contained in or attached to this communication are indicative and subject to change without notice.

The Day AheadFriday, July 11 – Key Economic Data Summary:
US: June federal budget balance will shed light on fiscal health. A wider deficit may raise debt concerns and impact bond markets.
UK: May monthly GDP is crucial for gauging recession risk. Weak growth could pressure the pound and fuel rate cut expectations.
Germany: June wholesale prices and May current account data will influence ECB policy views and Euro sentiment. Falling prices support easing; a lower surplus signals trade weakness.
Canada: June jobs report and May building permits highlight labor and housing trends. Strong jobs may delay rate cuts; weak permits suggest housing softness.
Market Focus: Currency and bond market volatility likely, especially in GBP, CAD, and EUR, with equities reacting to growth signals.
This communication is for informational purposes only and should not be viewed as any form of recommendation as to a particular course of action or as investment advice. It is not intended as an offer or solicitation for the purchase or sale of any financial instrument or as an official confirmation of any transaction. Opinions, estimates and assumptions expressed herein are made as of the date of this communication and are subject to change without notice. This communication has been prepared based upon information, including market prices, data and other information, believed to be reliable; however, Trade Nation does not warrant its completeness or accuracy. All market prices and market data contained in or attached to this communication are indicative and subject to change without notice.

EURUSD I Daily CLS I Model 1 I KL FVG I Target 50%Yo Market Warriors ⚔️
Fresh outlook drop — if you’ve been riding with me, you already know:
🎯My system is 100% mechanical. No emotions. No trend lines. No subjective guessing. Just precision, structure, and sniper entries.
🧠 What’s CLS?
It’s the real smart money. The invisible hand behind $7T/day — banks, algos, central players.
📍Model 1:
HTF bias based on the daily and weekly candles closes,
Wait for CLS candle to be created and manipulated. Switch to correct LTF and spot CIOD. Enter and target 50% of the CLS candle.
For high probability include Dealing Ranges, Weekly Profiles and CLS Timing.
Trading is like a sport. If you consistently practice you can learn it.
“Adapt what is useful. Reject whats useless and add whats is specifically yours.”
David Perk aka Dave FX Hunter
💬 Don't hesitate to ask any questions or share your opinions

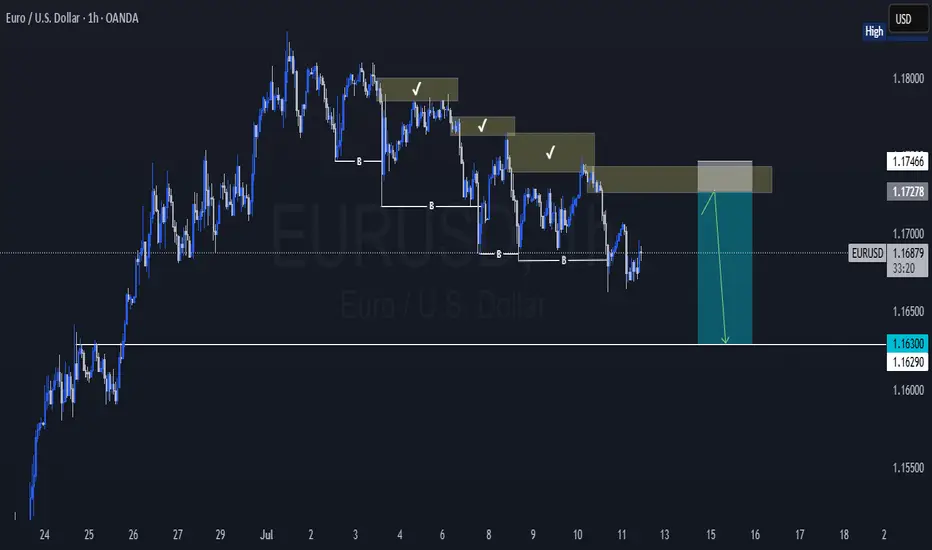
EURUSD Bearish IdeaAs you can see, EURUSD is in a small retracement of its uptrend, and in this retracement, it is constantly mitigating the supply zones. Therefore, in this current idea, we will wait for the price to reach the supply zone, if it gives confirmation, execute the sell order, and our target is the HTF demand zone.
EURUSD: Strong Bullish Confirmation?! 🇪🇺🇺🇸
There is a high chance that EURUSD will move up from the
underlined intraday support.
An ascending triangle formation and a violation of its neckline
indicate a strength of the buyers.
Goal - 1.1705
❤️Please, support my work with like, thank you!❤️
I am part of Trade Nation's Influencer program and receive a monthly fee for using their TradingView charts in my analysis.

EURUSDRecent Price Action
• Price attempted to break the descending structure but failed near 1.1705.
• A bearish rejection followed by a drop to 1.1667 shows sellers remain in control.
• Current bounce to 1.1680 is weak — no strong bullish follow-through.
Next Move Scenarios
Scenario 1: Bearish Continuation (Base Case)
• If 1.1685–1.1700 holds as resistance, a move down is expected.
• Breakdown of 1.1667 likely leads to:
• Target 1: 1.1650
• Target 2: 1.1600
Sell Setup
• Entry: 1.1685–1.1695
• Stop Loss: 1.1715
• Take Profit: 1.1650 , 1.1600 and 1.15250

EURUSD - Bears Are on the MoveHello TradingView Family / Fellow Traders. This is Richard, also known as theSignalyst.
📈EURUSD has been overall bearish trading within the falling wedge pattern marked in red. And it is currently retesting the upper bound of the wedge.
Moreover, the blue zone is a strong structure.
🏹 Thus, the highlighted red circle is a strong area to look for sell setups as it is the intersection of the upper red trendline and structure.
📚 As per my trading style:
As #EURUSD approaches the red circle zone, I will be looking for bearish reversal setups (like a double top pattern, trendline break , and so on...)
📚 Always follow your trading plan regarding entry, risk management, and trade management.
Good luck!
All Strategies Are Good; If Managed Properly!
~Rich
Disclosure: I am part of Trade Nation's Influencer program and receive a monthly fee for using their TradingView charts in my analysis.

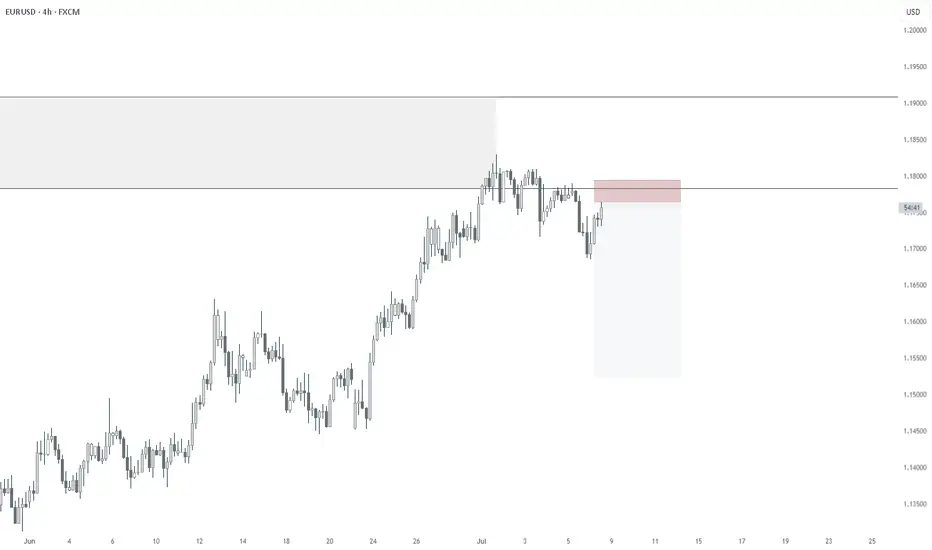
07/08/2025 - EURUSD - HEDGE SHORTHedge Short for FX:GBPUSD
COT Retailer still extended
We are on the higher timeframe weekly zone
Substructure is already confirmed bearish
With EUR/USD at 1.20, is Europe at risk of collapse? With EUR/USD at 1.20, is Europe at risk of collapse?
EUR/USD surpassed $1.175, reaching levels last seen in August 2021, following news of a US proposal to the EU regarding a trade agreement. The proposal provides for the maintenance of a 10% base tariff with exemptions for certain sectors, including aeronautics and alcohol.
Washington has not provided details regarding possible exemptions for other sectors such as automobiles, steel, aluminum, and pharmaceuticals, as requested by the EU. The European Union aims to reach a preliminary agreement with the United States by the end of the week to maintain the 10% tariff beyond the August 1 deadline, while negotiations for a permanent agreement continue.
Meanwhile, the European Union has announced its intention to introduce compensatory tariffs on a selection of US products in response to US tariffs on metals. European authorities have also signaled that, if no agreement is reached, further measures could be implemented, including export controls and restrictions on US companies' access to public procurement. In terms of monetary policy, market operators are discounting the possibility of only one further rate cut by the ECB before the end of the year.
Following a period of marked acceleration, the inflation rate in the Eurozone has aligned with the 2% target. According to preliminary estimates provided by Eurostat, the core index—which excludes food and energy components—also remains stable at 2.3%, reinforcing evidence of a decline in overall inflationary pressures. However, tensions remain in the services and food sectors, where persistent price increases are still being observed.
Inflation in the services sector rose by 3.3% in June, while food prices continue to be one of the main factors putting pressure on household budgets. Consumers' perception of inflation remains significantly higher than official figures: suffice it to say that the average inflation perceived by European consumers has been stable at 3.1% for several months. This gap contributes to social dissatisfaction and undermines confidence in the economic policies adopted.
At the same time, the European Central Bank is maintaining a cautious stance. Although short-term inflation expectations are declining, analysts consider a further rate cut at the next meeting in July unlikely. The central bank aims to avoid a premature rise in demand that could translate into further price increases, especially in light of the persistent geopolitical uncertainties affecting energy markets.
In summary, although the stabilization of inflation is a significant achievement, it remains fragile and subject to exogenous variables that are difficult to control, such as energy prices, which are heavily influenced by geopolitical balances. Furthermore, this stabilization does not appear sufficient to stimulate economic recovery in a context characterized by clear signs of weakness.
The exchange rate is now approaching 1.20, and it is important to analyze the potential consequences of such a high rate.
The appreciation of the euro is another critical factor: the strengthening of the single currency against the dollar is causing concern.
An exchange rate of up to USD 1.20 remains manageable; however, an appreciation beyond that level could put significant pressure on the European economy.
An excessively strong euro penalizes exports, reducing the competitiveness of European companies on international markets. This dynamic exacerbates the difficulties already encountered by the manufacturing sector, which continues to operate below the expansion threshold: for example, the PMI index remains below 50 points in many key economies, including Italy and France, indicating a phase of contraction. Only Spain is showing moderate growth.
In light of the weakness of the dollar and the continued strengthening of the euro, a reallocation of investments is expected, with an increase in exposure to US markets and a simultaneous reduction in the weight of European stocks in the portfolio.
Currently, I hold open long positions in the following stocks: CODEXIS, PALISADE, RMS, AZO, HYMC, and INTU.

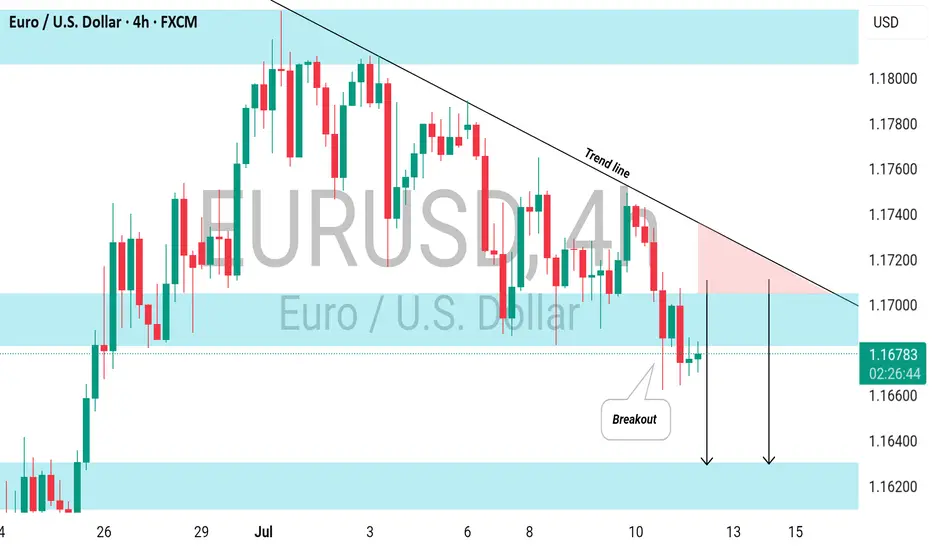
EURUSD: Bearish Continuation Ahead EURUSD is expected to maintain a bearish trend following a confirmed breakout below a significant horizontal support level.
The broken structure, along with a descending trend line, creates a contracting supply zone, indicating a strong likelihood of further downward movement.
The next target is 1.1620 support
#AN018: Summer shock, tariffs, Fed delays, and the dollar's shif
In recent days, the forex world has experienced a sequence of key events that could redefine the global currency landscape in the coming months. Risk to the dollar has become structural, the threat of tariffs is multiplying again, and the combination of geopolitical uncertainty and monetary policy creates an extremely risky mix for exchange rates.
Let's start with the Fed minutes: Jerome Powell attributed tariff risk to the main reason for postponing possible rate cuts. Market expectations are realigning toward a longer rate cycle, fueling a climate of global uncertainty. At the same time, Goldman Sachs warns that the dollar is increasingly moving as a "risky" currency, correlated with equity markets—an emerging market rather than a safe haven.
On the geopolitical front, President Trump has relaunched the trade war: announcements of tariffs of up to 35% on Canada, up to 20% on Europe, and 50% on copper from Brazil have caused futures volatility to soar and sent the dollar into a short-term rally. But Deutsche Bank is sounding the alarm: the summer period of low liquidity and rising trade tensions represents a potential trigger for prolonged currency turbulence.
The Financial Times envisions a scenario in which the dollar loses ground as the dominant currency, ushering in a multipolar currency world in which the euro, renminbi, gold, and even cryptocurrencies could gain ground.
The impact on Forex:
USD: The narrative is changing: no longer a net safe haven, but an asset correlated with political and risk cycles. The weakness of the DXY index in the first half of 2025 (-10%) reflects this transition.
EUR/USD: Potentially favored if the dollar continues its consolidation. However, new tariffs and US-EU uncertainty could provide temporary support for the greenback.
USD/JPY and USD/CHF: These crosses will be subject to greater volatility, with the next catalyst being the Fed minutes and the timing of tariffs. Safe-haven currencies strengthen during periods of uncertainty.
CAD, AUD, NZD: penalized by tariffs on Canada and Brazil and a weak dollar. OPEC+ and geopolitical tensions could boost commodities, but data confirmation is needed.
Commodity cross-correlation: USD/CAD could rebound if oil loses momentum, while AUD/JPY is sensitive to both the RBA and increased global risk.
Conclusion:
The current currency environment appears unstable and sensitive to political and trade developments. Summer volatility could persist, and those who can read the macro and institutional signals (Fed, tariffs, geopolitics) will have the opportunity to enter accurately. Until a stable direction emerges, EUR/USD looks like the most interesting cross to capture a potential structural correction in the dollar.

EUR USD SHORT RESULT Price faked out of the resistance Trendline of the major 4HTF ascending range and showed signs of weakness in momentum and to the downside.
From where I took the short position, it moved down nice but the NFP news volatility took out my trailing stop. But overall moved in our direction 🔥
_THE_KLASSIC_TRADER_.

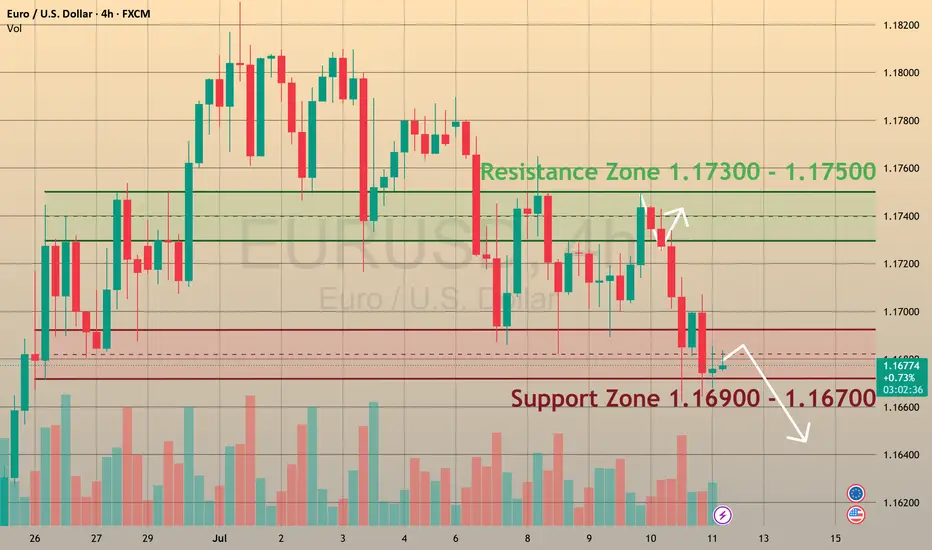
EURUSD is ready to break supportCMCMARKETS:EURUSD
The Euro fell to 1.1670 on Friday, positioning for nearly a 1% weekly loss 📊, as investors recalibrated risk exposure amid escalating trade tensions ⚔️ and shifting monetary policy signals 🏦.
📉 Market Structure:
🔻 EURUSD has traded in a bearish trend since July 1.
🔹 Support levels: 1.1680 and 1.1590.
🔹 Retested the 1.1680 support zone on Friday.
💡 How to Trade This:
✅ If the pair rebounds from support 🔄, consider BUYING with a Take Profit near the next resistance level.
❌ If the support breaks with confirmation 🩻, consider SELLING to target lower support zones.
📰 What’s Driving the Move?
🏦 Monetary Policy:
Chicago Fed President Austan Goolsbee pushed back against calls for aggressive rate cuts 🗣️, reaffirming the Fed’s focus on its dual mandate of maximum employment and price stability ⚖️. His cautious stance adds uncertainty 🤔 to the policy outlook for the second half of the year as markets weigh inflation risks vs. growth slowdown signals.
💼 Economic Data:
The labor market remains solid 💪, but recent jobless claims data show early signs of cooling 🧊, following last week’s strong NFP report.
💵 Dollar Strength:
The dollar advanced sharply against the euro 🚀, driven by risk aversion, relative yield advantages, and investor positioning ahead of upcoming inflation data and the Fed’s next policy signals 📈.
🚨 Watch for:
🔸 A confirmed breakout or rebound at 1.1680 to guide trade entries.
🔸 Upcoming U.S. inflation data 🪙 for direction on Fed policy and USD strength.
🔸 Further developments in trade tensions 🌐, which could drive risk sentiment.